
Abstract
Across international brewing operations corn grits from different suppliers vary substantially in terms of their physical properties and chemical composition. Present research aimed to highlight the key factors determining the brewing quality of stored corn grits.
Six grits samples were sourced with different particle sizes (that ranged from 0% to 74% of particles ≤0.355 mm) and stored at 10 °C, 20 °C, or 30 °C for 0, 2, 4, 8, 12, and 16 months. Samples were analysed for moisture, extract, lipid, trihydroxy fatty acids (THFA) and pro-oxidant metal ion contents. Particle size range was measured using sieve analysis. Increasing levels of THFA occurred on storage due to lipid oxidation and are negative indicators of brewing quality. PLS-R modelling of THFA levels (R2 = 0.83) revealed particle size (hence surface area for oxidation) was the most important factor (∼60% of the total R2) followed by storage time (∼25%) and temperature (∼7%). Metal ion content and lipid content of grits were minor contributors. Results showed that coarser milling of grits offers protection against lipid oxidation even after 8 months at 30 °C. These insights into key factors determining the rate of lipid oxidation in stored corn grits will help to develop better supply chain management and storage practices with which to assure their brewing quality.
Introduction
Corn is the most widely used brewing adjunct in Europe and America.[Citation1] Corn grits (particles of de-germed endosperm) are a commonly used brewing adjunct across the global industry. As with other grist materials, the sourcing, storage, and stock rotation of grits are key factors determining their brewing quality and shelf-life. For international operations grits will be sourced from multiple regions and suppliers and will experience different processing and temperatures across the supply chain and in storage. This makes standardisation of storage practices for quality control difficult.
The usage of unmalted adjuncts can be a cost-effective practice to increase extract in wort, whilst reducing energy and water consumption. Furthermore, the usage of adjuncts is associated with the flavour profiles of many key global beer brands. Growing conditions, availability, or the brewing recipe will determine the type of corn used. Dependent on source, raw materials will vary in extract, lipid content or other physico-chemical properties, such as particle size distribution.[Citation1,Citation2] Beer quality is highly influenced by the quality of its raw materials and it is generally accepted that most cereal grains have a storage stability of 12 months if kept intact under dry conditions[Citation3]. Factors that influence cereal grains storability include temperature, moisture content, surface area and lipid content.[Citation2–4] Therefore, understanding the importance of each particular factor and how these factors interact to determine brewing quality is key to determine the best storage conditions at the brewery.
Neutral lipids in cereals, such as triglycerides, free fatty acids, and sterols mainly act as energy storage molecules. Polar lipids (important for the structural matrix of cellular membranes) can be broadly categorized into (glycero)phospholipids and glycolipids (such as mono- and digalactosyl acylglycerides).[Citation5] Brewing yeast requires lipids for growth during the early aerobic phase of industrial fermentations – in particular unsaturated fatty acids and sterols for membrane synthesis. However, oxidation of unsaturated fatty acids can have negative impacts on beer quality. The enzymatic- or auto-oxidation of linoleic and linolenic acids results in the formation of their hydroperoxides[Citation6] which are transformed into mono, di, and trihydroxy fatty acids (THFA) and split into flavour active carbonyls. THFA have been identified as quantitatively the most important hydroxy fatty acids in wort and beer.[Citation7] In brewing, lipid degradation by lipoxygenase occurs mainly during mashing. The products of lipoxygenase activity (hydroperoxides) can further undergo decomposition in the brewhouse and/or in the packaged beer generating flavour active aldehydes such as hexanal and trans-2-nonenal.[Citation8]
In beer, hydroxy fatty acids have been associated with astringent taste and reduction in foam stability.[Citation9] Brewing grist materials will contribute pre-formed hydroxy fatty acids into the brew stream, particularly where oxidation has occurred during storage or prior processing. For example, an increase in THFA in malt samples has been associated with length of storage and with quality decrease of malt samples.[Citation10] Lipid degradation during storage of raw materials (malt or adjuncts) can occur through the action of enzymes (lipases or lipoxygenases) or through autoxidation by non-enzymatic reactions of grain lipids with atmospheric oxygen ().
Figure 1. The formation of fatty acid hydroperoxides and trihydroxy fatty acids through enzymatic lipid oxidation (lipase, lipoxygenase (LOX), and autoxidation [adapted from Refs.[Citation28,Citation29]]).
![Figure 1. The formation of fatty acid hydroperoxides and trihydroxy fatty acids through enzymatic lipid oxidation (lipase, lipoxygenase (LOX), and autoxidation [adapted from Refs.[Citation28,Citation29]]).](/cms/asset/db1f0b5d-9057-4dc6-9b44-108eb5420906/ujbc_a_2338609_f0001_c.jpg)
Lipids represent around 2% (dry basis) of barley malt and around 1–2% in degermed corn used for brewing. Linoleic acid is the most abundant fatty acid in malt and corn (∼60% of the total lipid content). In corn samples, triglycerides were reported as the major lipid class (52.4% of the total lipids in the endosperm) followed by fatty acids (36.5% of the total lipids in the endosperm) and polar lipids which accounted for 10.9% of total lipids in the endosperm.[Citation11] In malt, about 70% of fatty acids are present as triglycerides.[Citation12]
Temperature and moisture content are key factors in determining grain quality during storage.[Citation3,Citation13] In a recent study, brown rice kernels were stored at 15 °C, 25 °C, and 35 °C in cloth bags under 75% relative humidity over 270 d. The impact of temperature on the formation of free fatty acid levels was clear after 45 d of storage, with significantly higher amounts formed in samples stored at 25 °C or 35 °C relative to those stored at 15 °C.[Citation14] Hoff et al.[Citation3] investigated the chemical changes of pilsner malt stored for 0, 6, and 12 months at 10 °C and 20 °C at two levels of water activity (0.231 and 0.432). The intensity of radical formation in the malt kernels was measured by EPR spectroscopy. At low storage water activity (0.231), the radical intensity was not influenced by the storage temperature (10 °C and 20 °C) after 12 months of storage. However, when the water activity of the malt was higher (0.432), the storage temperature had a significant influence on radical formation (20 °C stored malt had significantly lower oxidative stability compared with 10 °C stored malt).[Citation3] Coradi et al.[Citation2] evaluated how different storage conditions (10 °C and 23 °C) and surface area of corn (stored whole or cracked) affected its chemical quality over a period of 6 months. The results showed that storing at 23 °C reduced the chemical quality (free fatty acids, ash and crude protein) in comparison to the samples stored at 10 °C. In addition, the whole corn presented better stability in comparison to the cracked corn when stored under the same conditions.[Citation2] In the case of brown rice kernels and whole grain wheat, lipid oxidation (free fatty acids) was significantly higher in the respective flours than in the kernels over a period of storage of 3 months at 26 °C.[Citation4]
Transition-metals like Fe, Cu, and Mn are catalysts of free radical generation and oxidation during beer production and ageing.[Citation15,Citation16] A previous study has reported that adjuncts, such as corn and rice, had significantly lower contents of Fe, Cu, and Mn in comparison to barley malt. Hence, their incorporation may be important in the reduction of oxidative reactions catalysed by transition metals, particularly during wort production.[Citation17]
The objective of the present project was to investigate the factors which determine the brewing quality of stored corn grits. Six grits samples, selected as varying in particle size distribution and lipid content, were sourced from six different breweries. Samples were stored at either 10 °C, 20 °C, or 30 °C for periods of 0 (fresh), 2, 4, 8, 12, and 16 months. The samples were stored in low density polythene (LDPE) bags for its high oxygen and low water vapour permeability. The choice of this material aimed to better represent how corn materials are typically stored in breweries – in large containers open to air in dry or humidity-controlled spaces.[Citation2] At each time point, quality was evaluated by measuring extract, in addition to the measurement of moisture, lipid content, transition metal ions (Fe, Cu, and Mn) as well as THFA levels as an indicator of lipid oxidation. The influence of storage conditions and of grits particle size, iron and lipid contents on the formation of THFA is reported and modelled using PLS-R. This enables the relative contribution of the factors to lipid oxidation to be identified.
Materials and methods
Materials
Six corn samples (Zea mays) were sourced from six different suppliers, as fresh as possible and already milled. These samples (coded A– F) were selected from an initial larger survey of 16 samples which were all analysed for moisture content, particle size range, metal ion and lipid contents (data not shown). The selection was based on identifying samples for the storage trial which exhibited a range of each of these parameters. Barley variety Flagon (2-row, winter sown) was sourced from Crisp Malting Company, UK. High-purity water from a Water Purification Systems (SUEZ Water, Thame, UK) was used for all chemical analysis and for glassware washing. LDPE bags were used for the storage of the corn samples for its high oxygen (44.756 × 10⁷ mL m m−2 day−1 Pa−1) and low water vapour (6.673–8.704 × 10¹⁴ g m m−2 s−1 Pa−1) permeability.[Citation18]
Storage conditions
Corn samples (150 g) were stored in tightly closed double layered plastic bags in the dark at 10 °C, 20 °C, and 30 °C for periods of 0 (fresh), 2, 4, 8, 12, and 16 months. The samples were stored in LDPE bags for its high oxygen and low water vapour permeability. Prior to its use in extract measurements, the same malt sample (see Materials section) was stored in vacuum packed foil pouches in the dark at 4 °C over the full storage trial.
At each of the above time points, a bagged sample was removed and analysed as outlined below for contents of moisture, lipid, THFA, and brewing extract. Fresh samples only were analysed for iron content and particle size range (sieve fractions).
Particle size analysis
Particle size distribution of fresh corn samples was determined in triplicate using a vibratory sieve shaker (Cole-Parmer Vibratory Sieve Shaker 115 V, UK) with a set of sieves with a mesh pore size comprising 2.00, 1.25, 1.00, 0.500, 0.355, 0.250, 0.125, and 0.075 mm (Cole-Parmer, UK). For the analysis, 100.0 ± 0.3 g of sample was weighed and placed on the top sieve (largest to smallest from the top), lidded and the vibratory sieve shaker was activated for 10 min. The fraction remaining on each sieve was weighed and the percentage retained was calculated from the total mass.
Metal ions analysis
For analysis of the solid milled raw materials digestions were undertaken using 0.2–0.5 g of grain and 6.0 mL nitric acid, heated at 95 °C for 2 h, cooled and then diluted to 50 mL with ultra-pure water. A further 1-in-6 dilution with ultra-pure water was applied prior to analysis. Quantification of a wide range of minerals was achieved by using inductively coupled plasma–mass spectrometry (ICP–MS) (Thermo-Fisher iCAP-Q, Waltham, MA, U.S.A.) with a ‘Flatopole collision cell’ (charged with helium gas) upstream of the analytical quadrupole. Internal standards were introduced to the sample stream via a T-piece and included Sc (50 μg/L), Ge (20 μg/L) Rh (10 μg/L), and Ir (5 μg/L) in the matrix of 2% HNO3. External calibration standards were used for quantification. Samples were introduced via an autosampler (Cetac ASX- 520; Thermo-Fisher Scientific, Waltham, MA, U.S.A.) through a venturi nebuliser (Thermo-Fisher Scientific). Sample processing was undertaken using Qtegra software (Thermo-Fisher Scientific, Waltham, MA, U.S.A).
Moisture content determination
Moisture contents of barley and corn samples were measured by mass loss on drying according to Analytica EBC Method 4.2 (Moisture content of malt) and Analytica EBC Method 6.2.2 (Moisture content of maize), respectively.
Lipid content
Lipid content of corn grits samples was measured using a Soxtherm Soxhlet Extraction system (Gerhardt GmbH, Königswinter, Germany). Finely ground corn grits (10g; particle size <0.500 mm) were extracted with 140 mL of petroleum ether for 2 h at 150 °C, followed by 30 min solvent rinse and 15 min of solvent evaporation at 103 °C. The samples were cooled down at room temperature for a minimum of 30 min in a desiccator. The yield of oily extract was weighed and expressed as oil content (% dry weight).
Extract content of corn adjuncts
Extract of corn adjunct materials was determined following a pre-gelatinization step. For each sample, 25 g of corn grits were mixed with 200 mL of water at 90 °C for 10 min. The temperature was then reduced to 70–75 °C and 1 g of the malt flour was added, mixed and temperature was maintained for 5 min. Afterwards the temperature was brought to 95 °C and held for 10 min. The temperature was then reduced to 45 °C at a 1.5 °C/min rate and then 25 g of malt combined with 100 mL of water at 45 °C were added to the corn mixture. Mashing was then carried out as in Analytica EBC Method 4.5.1 (Malt: Extract of Malt: Congress Mash): the temperature of 45 °C was maintained for 30 min followed by an increase in temperature to 70 °C for 25 min (increase of 1 °C per min). RO water (100 mL) was added to the mash when the temperature reached 70 °C. The temperature was held at 70 °C for 60 min (saccharification rest) after which the mash was cooled to room temperature. Finally, each beaker was adjusted to the same weight of 450.0 g by the addition of RO water. The mash was subsequently filtered through an open-folded filter (Whatman, grade 2555 ½ pre-pleated 320 mm, Sigma-Aldrich, UK). Extract was measured using an Anton Paar DMA 4500 (Anton Paar, Graz, Austria).
Analysis of trihydroxy fatty acids in corn grits samples
A 300 µL aliquot of lipid sample (∼0.022–0.100 g) dissolved in 5.0 mL of chloroform was mixed with heneicosane as internal standard (500 µL, 0.15 mM). Then, the sample was dried down in a stream of nitrogen. The hydroxy fatty acids were derivatized with pyridine (100 µL) and BSTFA (300 µL) at 90 °C for 60 min. Subsequently, the samples were frozen at −20 °C until the time of analysis. Gas chromatographic analysis of THFA in wort was based on the published procedures of Wackerbauer et al.[Citation10] GC analysis was performed using a SCION 456-GC (Bruker, Coventry, UK) fitted with a Combi PAL autosampler. The GC was equipped with a split/splitless injector and a flame ionization detector (FID). The column used was CP-Sil 5 CB low bleed/MS (50 m × 0.25 mm i.d., 0.25 µm film thickness; Agilent, Santa Clara, CA) and helium (BOC, U.K.) was used as a carrier gas at 1.4 mL/min in constant pressure mode. The programmed oven temperature was: 40 °C for 5 min, 40–290 °C at 6.0 °C/min, 290 °C for 20 min. The split ratio was set at 10:1. The temperatures of injector and detector were 250 °C and 280 °C, respectively. Peak areas were measured using Compass CDS software. The hydroxy fatty acids were analysed as trimethylsilyl derivatives. A blank (pyridine) was run in-between samples.
Statistical analysis of data
To analyse the impacts of particle size distribution, time and temperature a three-way ANOVA with Tukey’s post-hoc test was performed to understand the interactions of these factors on the THFA formation during the storage trial. Spearman’s correlation coefficients were calculated to construct a correlation map to understand the relationships between factors. Partial least squares regression (PLS-R) analysis was conducted, with the particle size distribution, time and temperature of storage, lipid and iron content as the independent variables. THFA concentration acted as the dependent variable to model the relationship between these variables. Cross-validation was performed with the ‘leave one out’ method. Homoscedasticy, has been considered in the statistical tests performed. A p value below 0.05 was considered as statistically significant. Statistical analyses were conducted using RStudio (1.3.959, Boston, MA, U.S.A.), R software (4.4.1, R Foundation for Statistical Computing, Vienna, Austria). All statistical analyses were performed at 95% confidence (p > 0.05).
Results
Particle size distribution
Results to the sieve fraction particle size distribution analysis are shown in .
Figure 2. Particle size distribution of each corn grits sample by shaking sieve analysis. Data are the mean of three independent measurements.
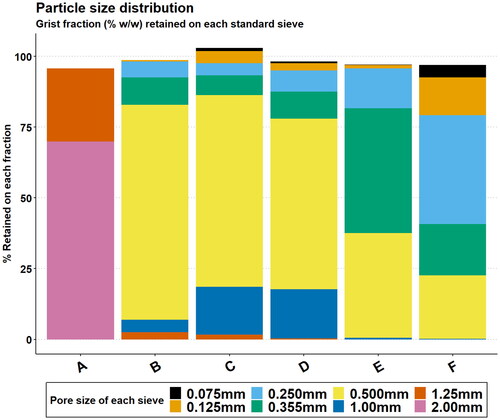
It is apparent that particle size range differed substantially between the grits samples, varying from the coarsest which was mainly retained on a 2 mm sieve (A) to the finest which had no particles >1.25 mm and was mainly retained on sieves of 0.25 mm pore size and less (F).
Analytical results: fresh to aged samples
Analytical data for the fresh corn grits materials are reported in . Particle size distribution () is summarised here as the percentage of particles ≤0.355 mm.
Table 1. Analytical data for the fresh corn grits samples.
Analytical differences between samples and the subsequent trends on storage will now be discussed for each parameter in turn.
Moisture content
Moisture content is a key factor determining storage stability of cereal grains. According to supplier specifications (Maizecor Foods Ltd) the moisture of corn grits should range between 12.5% and 14.5%. Higher moisture values result in higher mobility of reactive compounds within the product and therefore the possibility of more degrading reactions taking place. The moisture content of fresh samples () ranged from 12.8 ± 0.3 to 14.5 ± 0.2% (for samples D and B, respectively) revealing that all samples complied with typical moisture requirements ().[Citation19] The moisture contents of samples were analysed throughout storage. Data are reported in Supplementary Table 1 and Supplementary Figure 1 and are summarised here for succinctness. There was a maximum variation in absolute values of ∼ ± 4% between fresh and respective aged samples. When stored at 10–20 °C, the variation in absolute values was within ±2%. When stored at 30 °C samples B, D. and F had a higher reduction (from 3% to 4%) in moisture content after 12 and 16 months of storage. Overall, storage at 10–20 °C in the most part maintained the initial moisture content, whereas storage at 30 °C showed a trend towards decrease across all samples. The highest decrease in moisture content (3–4% in absolute values) was observed only after 12–16 months for the three latter samples with no correlation with the particle size distribution (Table S1).
Metal ions
In fresh samples the Cu content varied from 0.47 ± 0.10 to 0.75 ± 0.08 ppm and Mn content from 0.82 ± 0.05 to 2.98 ± 0.28 ppm (). The iron content of the samples ranged from 1.64 ± 0.67 to 23.99 ± 1.1 ppm (A and F, respectively). As might have been expected, the metal ion concentrations did not significantly change during the course of the ageing trial. The extremely high iron content observed in sample F – up to ×15 higher than the other corn samples – is likely due to differences in soil or natural growing conditions, artificial enrichment through fertilizers or contamination from industrial activities.[Citation20]
Extract
The extract of the fresh samples is reported in and ranged from 84.0 ± 2.4 to 91.7 ± 1.2%. These extract values did not change significantly throughout the storage trial (data not shown), indicating that the major components of the corn samples/malt and the starch-degrading enzymatic activity (derived mainly from malt, stored at 4 °C in vacuum during the full storage trial) remained intact.
Lipid content
The lipid content of fresh samples varied from 0.70 ± 0.02 to 2.38 ± 0.03% (dry basis m/m), . During ageing only the samples with 0% and 17% of particles ≤0.355 mm did not significantly change their lipid content ().
Figure 3. Lipid content % m/m (db) for each corn grits sample analysed across each time-point of analysis and storage temperature. a–cSuperscripts represent the ANOVA post-hoc groupings across each sample individually, p < 0.05.
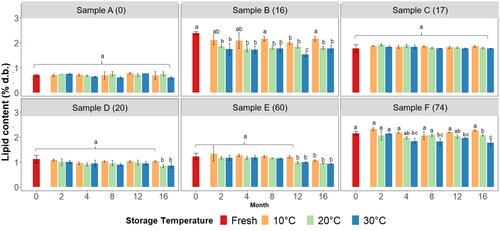
The sample with 16% of particles smaller than 0.355 mm (B -which had the highest lipid levels fresh, 2.38 ± 0.03%) was the sample with the steepest decline in lipid content. After 2 months at 20 °C or 30 °C a significant decline in the lipid content was observed with no further variation until the end of the trial. However, when stored at 10 °C no significant reduction in the lipid content was observed across the entire trial (). Regarding sample D (20% particles ≤0.355 mm) a significant decrease in the lipid content was observed only after 16 months of storage at 20 °C or 30 °C. Sample E (with 60% of particles smaller than 0.355 mm) showed a significant decrease in lipid content after 12 months of storage at 20 °C or 30 °C. After 16 months of storage no further decrease was observed at 20 °C and 30 °C but the sample stored at 10 °C was now significantly lower in lipid in comparison to the fresh sample. Finally, for sample F (with 74% of particles smaller than 0.355 mm) a significant decline in the lipid content was observed after 4 months of storage at 30 °C (with no further reduction at this temperature) and after 16 months of storage at 20 °C.
In grits stored at 10 °C, only sample E (with 60% of particles smaller than 0.355 mm) showed a significant reduction in lipid content relative to fresh values after 16 months. Overall, the two samples with the highest initial lipid contents (B and F) presented the highest losses and greater sensitivity towards storage temperature.
Trihydroxy fatty acids
THFA were determined in the fat extracted from the corn samples at each time-point of analysis. Firstly, to determine if differences existed in THFA formation during storage as the particle size varied, a three-way ANOVA (particle size, time-point, and temperature) with interactions was performed followed by a comparison of means calculated by Tukey’s HSD post-hoc test (). There was a significant 3-way interaction, F(75,174) = 5.92, p < 0.001). Examination of the THFA concentrations () reveals that the pattern of this interaction was that the samples with a smaller particle size (C, D, E, and F) from 8 months of storage onwards presented an increase in THFA which was dependent on the storage temperature (higher for 20 °C and 30 °C). There was also a significant 2-way interaction of time and temperature, F(8, 174) = 21.27, p < 0.001. The pattern of this interaction was that, as the time increased the effect of the storage at 30 °C on the THFA formation was in general higher in comparison to storage at 10 °C and 20 °C. This 2-way pattern was observed in each different sample. Significant main effects were observed for particle size, time, and temperature. This indicated that the different fresh samples had significantly different THFA baseline concentrations and that, regardless of the temperature, a significant increase in THFA was observed for all the samples. Also, different levels of THFA were observed at different temperatures, irrespective of the time-point of storage.
Figure 4. Trihydroxy fatty acid (THFA) concentration for each corn sample analysed across each time-point of analysis and storage temperature. a–cSuperscripts represent the ANOVA post-hoc groupings across storage of each sample individually, p < 0.05.
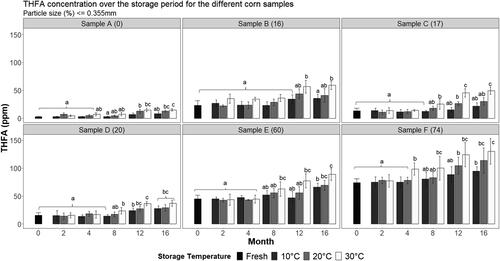
In summary, the fresh samples differed significantly in THFA baseline concentrations (p < 0.05) with the highest values corresponding to smallest particle size (F) and vice versa (lowest in sample A which had the highest particle size on average). These oxidation products of unsaturated fatty acids trended upwards, as expected, across storage, in particular at the higher storage temperatures (). Samples with a smaller particle size (C, D, E, and F) from 8 months of storage onwards presented an increase in THFA which was dependent on the storage temperature (higher for 20 °C and 30 °C). As the time of storage increased, THFA formation in all samples was higher at 30 °C relative 10 °C or 20 °C storage.
To illustrate how lipid content and particle size influenced the THFA concentration, the THFA values for each corn sample, obtained from all time-points (and storage temperatures) were plotted against the THFA concentrations ().
Figure 5. Trihydroxy fatty acid (THFA) concentrations across all time points of analysis (at all storage temperatures) for each corn sample analysed.
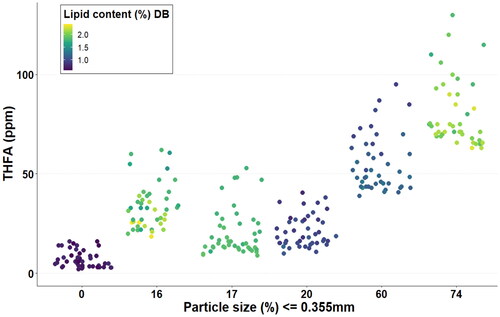
A clear indication of the impact of the particle size on the formation of THFA can be observed. Contrary to expectations, concentrations of THFA in the samples with higher lipid contents (16%, 17%, and 74% of particles ≤0.355 mm) were not necessarily the greatest. Samples 16% and 17%, regardless of similar lipid content to the 74% sample, had significantly lower concentrations of THFA across the full storage trial. On the other hand, sample E (60%) had similar lipid content to the 20% sample (D), but the latter had overall significantly lower THFA production ().
Spearman’s correlation coefficients were calculated to identify correlations between the variables within the full data set (with exception of extract which didn’t significantly differ between samples). The results indicated a positive and significant correlation between THFA levels and particle size (r = 0.79) and with lipid content (r = 0.51). The ratio THFA/lipid had a weak correlation with the lipid content (r = 0.15) but correlated strongly with the particle size distribution (r = 0.76), confirming, as can be seen in , that the rate of THFA formation was more dependent on the particle size than the baseline lipid content. Interestingly, the samples with higher lipid content also had higher iron contents (r = 0.83). Sample moisture content did not correlate significantly with the THFA concentration nor with time.
Modelling the THFA formation with partial least squares regression (PLS-R)
Partial least squares regression computes principal components of the predictor variables (highly correlated or even collinear) that both explain variance in the predictor variables and are maximally useful for modelling the response variable. PLS-R then models the response as a function of these.[Citation21,Citation22] Each of the predictors is typically tested by cross-validation, and the optimum number of components is that with the highest R2cv. PLS-R was used here to model the relationship between THFA formation and particle size (PS), storage time (months), storage temperature, and iron and lipid contents. Residual plots help in detecting outliers that might be harming the fit;[Citation21] sample F was identified as an outlier (due to the much higher Fe content) and removed from the PLS-R analysis.
For the best fit model () including all 5 predictor variables, the relative importance of each for the formation of THFA was calculated (). Particle size (∼60% of the total R2) and storage time (∼25% of the total R2) were assessed by the model as key drivers on the formation of THFA.
Figure 6. The relative importance of the predictor variables in the 5-component PLS-R model for THFA concentrations reported in ; % particle size distribution ≤0.355 mm (PS), storage time (month), temperature (temp), lipid content (lipid), and Fe content.
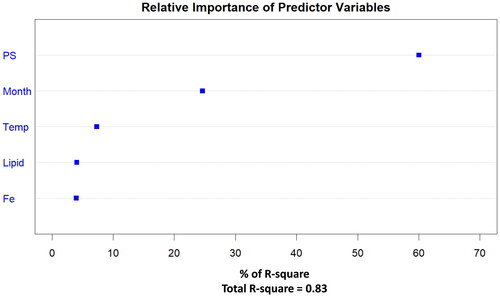
Table 2. PLS-R models relating THFA concentration to temperature, time (month), iron, % particles ≤0.355 mm (PS) and lipid content.
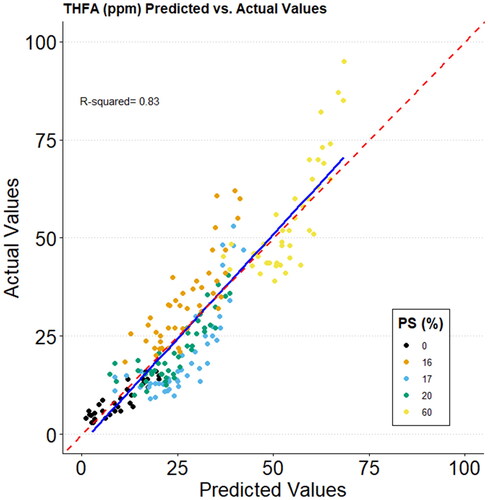
The derived models were fairly strong (R2cv 0.766–0.819; ), indicating that it is readily possible to predict the extent of THFA formation as a function of the analysed components (). Data points in are coloured according to particle size classification (% ≤0.355 mm) which once again confirms the predominance of particle size as the over-riding factor determining THFA levels in this trial.
Figure 7. Regression plot of the PLS-R model for the prediction of THFA levels obtained at various levels of particle size distribution, storage time and temperature, lipid content and iron content. PS (%) refers to the % of particle size distribution ≤0.355 mm. Red dashed line: Perfect fit; blue line: Trend line (R2 = 0.83).
Discussion and conclusions
Lipid oxidation markers – THFA – were measured in six different corn samples varying in lipid content, particle size distribution, and iron content over a period of 16 months at three different temperatures. After 12 months of storage all samples showed a significant increase in THFA at all temperatures (with the exception of sample B stored at 10 °C) with higher values resulting at 30 °C. The samples stored at 10 °C were more stable and developed lower levels of lipid oxidation products, in accordance with previous findings. Chen et al.[Citation13] analysed the free fatty acid content of whole grain corn samples stored in 11 large granaries in China over a period of 18 months and with constant temperature monitoring (which varied across the storage time and within granaries from below 0 to above 25 °C). The results showed significant increases after 4 months of storage in free fatty acid values (or acidity) (mg/100 g) with a strong and significant correlation with higher storage temperatures.[Citation13] In this study, THFA were analysed to assess lipid oxidation of the corn samples. Whilst THFA and acid value (or free fatty acids) are not interchangeable terms () they both give a measure of the degradation of lipid samples. In a recent study by Kechkin et al.[Citation23] wheat samples were stored at 10 °C, 20 °C, and 30 °C and relative air humidities ≥ 65% presented the highest free fatty acid values.[Citation23]
From the current results, the impact of particle size and storage time was clear on the THFA formation, showing the importance of avoiding early/extensive milling to reduce the amount of rancidity materials entering the brewing process. In addition to the higher surface area for reactions to occur with extensive milling, the milling process can also promote interactions between hydrolytic enzymes (e.g. lipases) and lipoxygenases with lipids resulting in the enhancement of lipid degradation.[Citation4] Following the particle size distribution, the time of storage was identified as a key factor impacting on the THFA formation followed by temperature and lipid content (and lastly iron content). The sample with greatest prevalence of small particles (F) showed the quickest increase in THFA regardless of having a similar lipid content to samples with larger particle sizes (). It is not a new observation that cereals stored in kernels show greater resistance towards lipid oxidation than when stored in flours. Tsuzuki et al.[Citation4] showed that the accumulation of free fatty acids in brown rice kernels and respective flour was significantly higher in the flours when stored at 26 °C over a period of 8 months. They also showed that when storing rice kernels at 4 °C and 26 °C no significant differences in free fatty acids were observed after 8 months of storage but a significant increase was found in the respective flours stored at 26 °C than when stored at 4 °C.[Citation4] A minor correlation between higher THFA content and Fe content was observed. This finding warrants further studies investigating how the content of metals affects lipid oxidation rate of grains during storage. It has been shown that Fe(II) reacts with lipid peroxides leading to the formation of flavour active carbonyl compounds.[Citation24] Hence, higher levels of metals in the raw materials could potentially increase the ‘pool’ of off-flavours going into the brewing process and thus reduce flavour stability.
Lipid deterioration in corn grains involves enzymatic and non-enzymatic reactions. It primarily comprises autoxidation by free radical chain reactions, photo-oxidation and enzymatic oxidation catalysed by lipoxygenases – the main enzyme that oxidises cereal lipids. Previous studies have found lipoxygenase activity to decrease with storage of malt and corn.[Citation25,Citation26] In this study, the THFA content continued to increase with time, which may suggest that auto-oxidation played a role in the formation of THFA. The conditions of grain bulk-stored in large-scale breweries are quite different compared with the tests carried out at small scale, including constituents (e.g. damaged grains), temperature gradients, and air exposure.[Citation13] In this project, the samples were stored in tightly closed double layered plastic bags (permeable to oxygen) in the dark. Thus the lower exposure to air of the corn samples (in comparison to storage in bulk industrially) during the present trial may explain the longer period taken for the significant increase in THFA (∼8–12 months for the majority of the samples), in comparison to previous studies with corn stored at large scale (significant increase in free fatty acids after ∼4 months of storage at room temperature[Citation13]). Gras et al.[Citation27] stored white corn for 9 months at ∼30 °C in 50 kg bags, either sealed and treated with an initial dose of carbon dioxide for disinfestation, or left unsealed in air, but fumigated and sprayed. The free fatty acids value (or acidity) (mg/100 g) of the unsealed bags was significantly lower (29.0) in comparison with the sealed bags (48.6) after the storage period, indicating the importance of air exposure on lipid oxidation.[Citation27]
Nevertheless, the present results and in particular the derived PLS-R model emphasise the predominant impact of particle size on the rate of formation of oxidation markers, over and above all other factors investigated in the study. Indeed, our data suggest that corn grits could be stored under the test conditions for at least 8 months at 30 °C with only minor increases in THFA provided that the grits particle size was greater. This relative significance of factors is important because grits could easily be subjected to 30 °C or higher temperatures in the supply chain, but temperature control is relatively expensive. Whilst it remains important to maintain good supply chain management and stock control to minimise the exposure of stored grits to prolonged periods at elevated temperatures, some protection could be offered by sourcing and storing coarser milled grits. The brewer can then mill to a finer particle size immediately prior to use to assure factors such as extract efficiency and mash filterability. It is noted that the extent to which suppliers mill grits is subject to logistical factors – for example the bulk density of grits increases as particle size reduces, meaning that a greater mass per unit volume is transported.
Supplementary Data
Download MS Word (72.6 KB)Disclosure statement
No potential competing interest was reported by the authors.
Additional information
Funding
References
- Bogdan, P.; Kordialik-Bogacka, E. Alternatives to Malt in Brewing. Trend. Food Sci. Technol. 2017, 65, 1–9. DOI: 10.1016/j.tifs.2017.05.001.
- Coradi, P. C.; Maldaner, V.; Lutz, É.; da Silva Daí, P. V.; Teodoro, P. E. Influences of Drying Temperature and Storage Conditions for Preserving the Quality of Maize Postharvest on Laboratory and Field Scales. Sci. Rep. 2020, 10(1), 22006. DOI: 10.1038/s41598-020-78914-x.
- Hoff, S.; Lund, M. N.; Petersen, M. A.; Jespersen, B. M.; Andersen, M. L. Quality of Pilsner Malt and Roasted Malt during Storage. J. Inst. Brew. 2014, 120, 331–340. DOI: 10.1002/jib.144.
- Tsuzuki, W.; Suzuki, Y.; Yamada, S.; Kano, S.; Ohnishi, H.; Fujimoto, T.; Horigane, A. Effect of Oxygen Absorber on Accumulation of Free Fatty Acids in Brown Rice and Whole Grain Wheat during Storage. Lwt-Food Sci. Technol. 2014, 58(1), 222–229. DOI: 10.1016/j.lwt.2014.02.015.
- Bahrami, N.; Yonekura, L.; Linforth, R.; Carvalho DA Silva, M.; Hill, S.; Penson, S.; Chope, G.; Fisk, I. D. Comparison of Ambient Solvent Extraction Methods for the Analysis of Fatty Acids in Non-starch Lipids of Flour and Starch. J. Sci. Food Agric. 2014, 94(3), 415–423. DOI: 10.1002/jsfa.6449.
- Gordon, R.; Power, A.; Chapman, J.; Chandra, S.; Cozzolino, D. A Review on the Source of Lipids and Their Interactions during Beer Fermentation that Affect Beer Quality. Fermentation 2018, 4(4), 89. DOI: 10.3390/fermentation4040089.
- Kobayashi, N.; Kaneda, H.; Kuroda, H.; Kobayashi, M.; Kurihara, T.; Watari, J.; Shinotsuka, K. Simultaneous Determination of Mono-, di-, and Trihydroxyoctadecenoic Acids in Beer and Wort. J. Inst. Brew. 2000, 106(2), 107–110. DOI: 10.1002/j.2050-0416.2000.tb00046.x.
- Sovrano, S.; Buiatti, S.; Cossi, S.; Anese, M. Influence of Malt Browning Degree on Lipoxygenase Activity (vol 99, pg 711, 2006. Food Chem. 2010, 118(2), 436–436. DOI: 10.1016/j.foodchem.2009.06.027.
- Kuroda, H.; Kobayashi, N.; Kaneda, H.; Watari, J.; Takashio, M. Characterization of Factors that Transform Linoleic Acid into Di- and Trihydroxyoctadecenoic Acids in Mash. J. Biosci. Bioeng. 2002, 93(1), 73–77. DOI: 10.1016/S1389-1723(02)80057-3.
- Wackerbauer, K.; Meyna, S. Hydroxy Fatty Acids as Indicators for Ageing and the Influence of Oxygen in the Brewhouse on the Flavour Stability of Beer. Monatsschif. Brauwissenschaf. 2003, 56, 174–178.
- Weber, E. J. Lipids of Corn Germ and Endosperm. J. Americ. Oil Chem. Soc. 1979, 56(6), 637–641. DOI: 10.1007/BF02679340.
- Anness, B. J. Lipids of Barley, Malt and Adjuncts. J. Inst. Brew. 1984, 90(5), 315–318. DOI: 10.1002/j.2050-0416.1984.tb04282.x.
- Chen, K.; Wu, W. F.; Lan, Y. K.; Liu, Z.; Han, F.; Xu, Y. Assessment and Prediction of Free Fatty Acids Changes in Maize Based on Effective Accumulated Temperature in Large Granaries. Int. J. Food Prop. 2022, 25(1), 1156–1170. DOI: 10.1080/10942912.2022.2074031.
- Liu, K. L.; Li, Y.; Chen, F. S.; Yong, F. Lipid Oxidation of Brown Rice Stored at Different Temperatures. Int. J. Food Sci. Tech. 2017, 52(1), 188–195. DOI: 10.1111/ijfs.13265.
- Jenkins, D.; James, S.; Dehrmann, F.; Smart, K.; Cook, D. Impacts of Copper, Iron, and Manganese Metal Ions on the EPR Assessment of Beer Oxidative Stability. J. Am. Soc. Brew. Chem. 2018, 76(1), 50–57. DOI: 10.1080/03610470.2017.1402585.
- Van Mieghem, T.; Delvaux, F.; Dekleermaeker, S.; Britton, S. J. Top of the Ferrous Wheel–The Influence of Iron Ions on Flavor Deterioration in Beer. J. Am. Soc. Brew. Chem. 2023, 81(4), 493–503. DOI: 10.1080/03610470.2022.2124363.
- Maia, C.; Cunha, S.; Debyser, W.; Cook, D. Impacts of Adjunct Incorporation on Flavor Stability Metrics at Early Stages of Beer Production. J. Am. Soc. Brew. Chem. 2021, 81(1), 54–65. DOI: 10.1080/03610470.2021.1993054.
- Bastarrachea, L.; Dhawan, S.; Sablani, S. S. Engineering Properties of Polymeric-Based Antimicrobial Films for Food Packaging. Food Eng. Rev. 2011, 3(2), 79–93. DOI: 10.1007/s12393-011-9034-8.
- Kunze, W. Technology Brewing&Malting; VLB Berlin, Berlin, Germany, 2004.
- Xu, D. C.; Shen, Z. J.; Dou, C. M.; Dou, Z. Y.; Li, Y.; Gao, Y.; Sun, Q. Y. Effects of Soil Properties on Heavy Metal Bioavailability and Accumulation in Crop Grains Under Different Farmland Use Patterns. Sci. Rep. 2022, 12(1), 9211. DOI: 10.1038/s41598-022-13140-1.
- Vandeginste, B.; Massart, D. L.; Buydens, L. M. C.; DE Jong, S.; Lewi, P. J.; J, S.-V. Handbook of Chemometrics and Qualimetrics: Part B ; Elsevier Science: Amsterdam, the Netherlands, 1988.
- Tan, Y.; Siebert, K. J. Modeling Bovine Serum Albumin Binding of Flavor Compounds (Alcohols, Aldehydes, Esters, and Ketones) as a Function of Molecular Properties. J. Food Sci. 2008, 73(1), S56–S63. DOI: 10.1111/j.1750-3841.2007.00591.x.
- Kechkin, I. A.; Ermolaev, V. A.; Ivanov, M. V.; Romanenko, A. I.; Gurkovskaya, E. A. Dependence of Fat Acidity Value on Wheat Grain Storage Conditions. Kazan, Russia, International Scientific-Practical Conference - Agriculture and Food Security: Technology, Innovation, Markets, Human Resources (Fies 2019), 2020; 17.
- Glindemann, D.; Dietrich, A.; Taerk, H. J.; Kuschk, P. The Two Odors of Iron When Touched or Pickled: (Skin) Carbonyl Compounds and Organophosphines. Angew. Chem. Int. Ed. Engl. 2006, 45(42), 7006–7009. DOI: 10.1002/anie.200602100.
- Kaukovirta-Norja, A.; Reinikainen, P.; Olkku, J.; Laakso, S. Influence of Barley and Malt Storage on Lipoxygenase Reaction. Cereal. Chem. 1998, 75(5), 742–746. DOI: 10.1094/CCHEM.1998.75.5.742.
- Rodriguez-saona, L. E.; Barrett, D. M.; Selivonchick, D. P. Peroxidase and Lipoxygenase Influence on Stability of Polyunsaturated Fatty-Acids in Sweet Corn (Zea-mays L) during Frozen Storage. J. Food Sci. 1995, 60(5), 1041–1044. DOI: 10.1111/j.1365-2621.1995.tb06288.x.
- Gras, P. W.; Bason, M. L.; Esteves, L. A.; Sabio, G. C.; Annis, P. C.; Graver, J. E. V. Quality Changes in Maize Stored in Sealed Bag Stacks. J. Stored Prod. Res. 1990, 26(4), 199–206. DOI: 10.1016/0022-474X(90)90022-K.
- Sakaino, M.; Sano, T.; Kato, S.; Shimizu, N.; Ito, J.; Rahmania, H.; Imagi, J.; Nakagawa, K. Carboxylic acids derived from triacylglycerols that contribute to the increase in acid value during the thermal oxidation of oils. Sci. Rep. 2022, 12(1), 12460. DOI: 10.1038/s41598-022-15627-3.
- Baert, J. J.; DE Clippeleer, J.; Hughes, P. S.; DE Cooman, L.; Aerts, G. On the Origin of Free and Bound Staling Aldehydes in Beer. J. Agric. Food Chem. 2012, 60(46), 11449–11472. DOI: 10.1021/jf303670z.