Abstract
Multi-level models can be used to account for clustering in data from multi-stage surveys. In some cases, the intraclass correlation may be close to zero, so that it may seem reasonable to ignore clustering and fit a single-level model. This article proposes several adaptive strategies for allowing for clustering in regression analysis of multi-stage survey data. The approach is based on testing whether the PSU-level variance component is zero. If this hypothesis is retained, then variance estimates are calculated ignoring clustering; otherwise, clustering is reflected in variance estimation. A simple simulation study is used to evaluate the various procedures.
1. Introduction
Two-stage sampling is used in many surveys of social, health, economic, and demographic topics. Final population units are grouped into primary sampling units (PSUs). The first stage of selection is a sample of PSUs and the second stage is a sample of units within selected PSUs. For example, PSUs might be schools and units might be students in schools, or PSUs might be households and units might be people, or PSUs might be geographic areas and units might be households (for example, see, Cochran, Citation1977; Kish, Citation1965).
Two-stage sampling is typically used because of the following.
There is no sampling frame of final units, but a frame of PSUs (e.g., a list of suburbs) is available. | |||||
Cost efficiency—for example, it is much cheaper to draw a two-stage sample of 100 students from 10 schools than draw a simple random sample of 100 students, as those students might be dispersed over 100 schools (Snijders, Citation2005). | |||||
Within-group correlations may be of interest in their own right. For instance, the correlation between values for students in the same school might be of interest. | |||||
A complication of two-stage sampling is that values of interest may tend to be more similar for units from the same PSU than for units from different PSUs. If so, this should be reflected in the analysis procedure. One way of doing this is by fitting a multi-level model.
Multi-level models are generalization of regression models. Let y ij be a dependent variable of interest, and x ij a vector of covariates for unit j in PSU i. The two-level linear mixed model (LMM) (Goldstein, Citation2003) is given by
The intra-class correlation (ρ) is a measure of the association between the regression residuals for members of the same PSU. It is the ratio of the population variance between PSUs and the total variance. Consequently, it is given by the formula (Commenges and Jacqmin, Citation1994).
In practice, the intra-class correlation is often quite small. For example, if units within PSUs are no more homogenous than units over all PSUs, then the intra-class correlation is zero. On the other hand, if units from the same PSU have equal values then the intra-class correlation is 1. Generally, the intra-class correlation is positive, but in the case of equal number of observations in each PSU, it is usually less than 0.1 when PSUs are geographic areas and final units are households in these areas (Verma et al., Citation1980). When PSUs are households and final units are people in households it is typically between 0 and 0.2 (Clark and Steel, Citation2002).
There are number of possible approaches to estimating the regression coefficients and their variances when the intraclass correlation (ρ) is thought to be small or has been estimated as a small value. One is to fit a linear mixed model regardless. Another is to fit a linear model assuming independent observations. However, if the sample design is relatively clustered, that is a large number of final units are selected from each PSU, the estimated variances resulting from a linear mixed model can be a lot larger than those obtained from a linear model assuming independent observations, leading to wider confidence intervals. Moreover, a linear mixed model is more complicated to fit and explain than a simple linear model, so the latter is preferable provided it does not give misleading inference. A third alternative is to use an adaptive strategy based on testing the null hypothesis that the random effect variance component, , is zero. If the null hypothesis is accepted we use the linear model for estimating the variances of the estimated regression coefficients
. On the other hand, if the null hypothesis is rejected we use the estimated variance for
either using the standard likelihood theory variance estimator for the LMM or the Huber–White method.
Adaptive confidence intervals calculated in this way do not incorporate the model selection uncertainty, and so may not have the correct coverage rates. The extent of this problem will be evaluated by simulation. An alternative approach would be to fit both the LM and LMM and base estimates and inference on model averaging of these two models (Hoeting et al., Citation1999; Yuan and Yang, Citation2005). We do not develop this approach here, as one of our aims is to simplify the modeling process when the intraclass correlation is small.
This article is divided into five sections. Section 2 will describe the linear mixed model including an outline of the standard likelihood theory estimators of β and and the Huber–White estimator of
. Section 3 will describe an adaptive strategy. A simulation study of the adaptive and other methods will be described in Sec. 4. In Sec. 5, we will draw conclusions.
2. Fitting the Linear Mixed Model
2.1. The Model
Let X be the n × p design matrix, which is assumed to be of rank p, and be the complete set of
observations in the c PSUs, where y
i
= (y
i1,…, y
im
i
)′ is the observed vector for the ith PSU.
Model (Equation1) can also be written as
REML was first introduced by Patterson and Thompson (Citation1971) as a modification of Maximum Likelihood. The REML method is often presented as a technique based on maximization of the likelihood of a set of linear combinations of the elements of the response variable y, say k′y, where k is chosen so that k′y is free of fixed effects. One of the attractive aspects of REML is that it takes into account the degrees of freedom used up by the estimation of the fixed effects (Diggle et al., Citation1994). There is also no loss of information about the variance components when the inference is derived from k′y rather than y.
The restricted log-likelihood function is given by
The simple special case of model (Equation1) where the model includes just a grand mean parameter will be used in the simulation study in Sec. 4. This model is given by defining x ij to be 1 for all i:
In the intercept-only model, the REML estimates are defined by the following system of equations:
2.2. Likelihood Theory Estimator of 
In this section, we will discuss the variances of the estimated regression coefficients and their estimators. The estimated variance of the REML , defined by expression (Equation5), is given by
In the balanced data case, the variance estimator simplifies further to
A confidence interval for could be constructed using the formula
2.3. Huber–White Estimator
The estimator in (Equation9) will be approximately unbiased provided the variance model (Equation3) is correct. If this is not the case,
will be biased and inference will be incorrect. An alternative to ML or REML estimates of
is the robust variance estimation approach described by Liang and Zeger (Citation1986), in the context of modeling longitudinal data using generalized estimating equations (GEE). This approach can be applied to the analysis of data collected using PSUs, where observations within PSUs might be correlated and the observations in different PSUs are independent.
This approach can be referred to as robust or Huber–White variance estimation (Huber, Citation1967; White, Citation1982). It will be used as an alternative approach to estimating in this article. The method yields asymptotically consistent covariance matrix estimates even if the variances and covariances assumed in model (Equation2) are incorrect. It is still necessary to assume that observations from different PSUs are independent.
In Eq. (Equation9) in Sec. 2.2, we suggested estimating the variance of based on substituting REML estimates of
and
into V
i
. An alternative estimator of V
i
is
, where
.
is approximately unbiased for V
i
even if (Equation3) does not apply:
Note that
One way to construct a robust estimator of is to substitute the robust estimator
in (Equation14) as follows:
When there is only an intercept in the model (x i = 1), (Equation14) becomes
Exact confidence intervals can then be calculated using (12) with degrees of freedom equal to c − 1 (MacKinnon and White, Citation1985).
2.4. REML Likelihood Ratio Test (RLRT) for Testing
Suppose we want to test vs.
. The REML approach can be used to derive the likelihood ratio test (LRT) statistic for this test.
Visscher (Citation2006) showed that the REML-based likelihood ratio test (RLRT) for testing in model (Equation1) is given by:
3. Adaptive Strategies
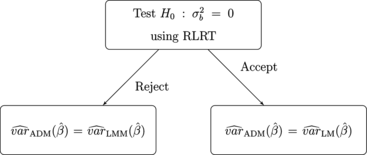
In this article, we consider two adaptive strategies. Both of them rely on the idea of testing the variance component in model (Equation1). In the first adaptive strategy, if we reject
, we use the LMM estimators of
defined in Eq. (Equation9). On the other hand, if we accept H
0, then we assume that
and we fit the standard linear model with independent errors. This strategy is explained in Fig. , where
is the estimator of
using the LM strategy,
is the estimator of
using the LMM strategy and
is the adaptive estimator.
Figure 1 Flowchart explaining the adaptive procedure using the estimated variance extracted from the LMM.
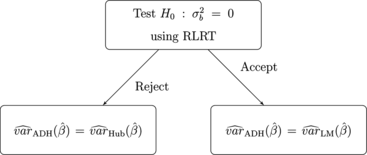
The second adaptive strategy, explained in Fig. , is identical, except that the robust Huber–White estimator is used instead of
when H
0 is rejected.
Figure 2 Flowchart explaining the adaptive procedure using Huber–White estimator.
The advantage of the adaptive strategy is that we use the simple linear model to derive variance estimators, unless there is strong evidence that . This has the benefit of simplifying the model and may also give tighter confidence intervals. However, it is not clear whether the adaptive approaches will give valid confidence intervals for β, because the confidence intervals assume non adaptive procedures.
4. Simulation Study
A simulation study was conducted to compare the adaptive and non adaptive methods for estimating . Data were generated from model (Equation6), with m
i
= m and an intercept only model. The values of ρ, m, and c were varied. One thousand samples were generated in each case. The values of
and
were set to
and 1 respectively, to ensure that the intraclass correlation was ρ.
For each sample the estimated regression coefficients and the estimators of
were calculated for the LMM and LM models using the lme and lm packages (Pinheiro and Bates, Citation2000) in the R statistical environment (R Development Core Team, Citation2007). The true variance of
was determined by calculating the variance over all 1,000 simulations.
The hypothesis was tested as described in Sec. 2.4. The two adaptive strategies, ADM and ADH, were as defined in Sec. 3. 90% confidence intervals were calculated for the LMM method using the method of Faes et al. (Citation2009), as described in Sec. 2.2. Huber–White confidence intervals were calculated as discussed in Sec. 2.3, and the adaptive confidence intervals were calculated as discussed in Sec. 3.
Tables show the ratio of the mean estimated variance of to the true variance using the four strategies of estimation (ADM, ADH, LMM, and Huber) with values of ρ of 0, 0.025, 0.05, and 0.1. In all tables we used β = 0 and significance level α = 0.1 for testing
. The tables show the non coverage rates of 90% confidence intervals for β and the lengths of these confidence intervals. The proportion of samples where
was rejected are also shown. Results on non coverage and 90% confidence intervals length are also shown in graphical form in Figs. . In the graphs we also include the LM strategy of estimation so that the effect of completely ignoring the clustered nature of the data can be examined.
Figure 3 Confidence interval non coverage rates (%) for different variance estimation methods and various numbers of PSUs (c) and units per PSU (m) for intraclass correlation (ρ) of 0.
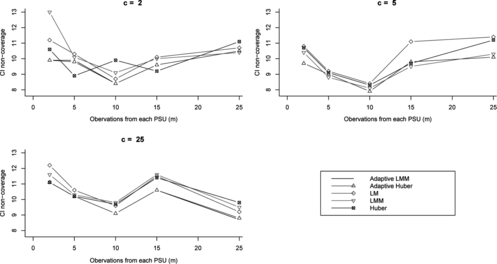
Figure 4 Confidence interval non coverage rates (%) for different variance estimation methods and various numbers of PSUs (c) and units per PSU (m) for intraclass correlation (ρ) of 0.05.
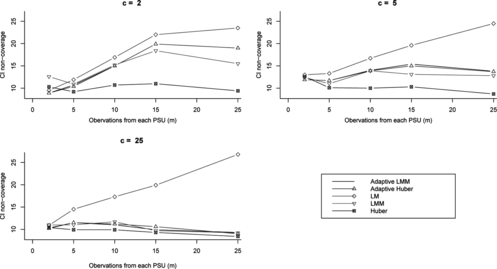
Figure 5 Confidence interval non coverage rates (%) for different variance estimation methods and various numbers of PSUs (c) and units per PSU (m) for intraclass correlation (ρ) of 0.1.
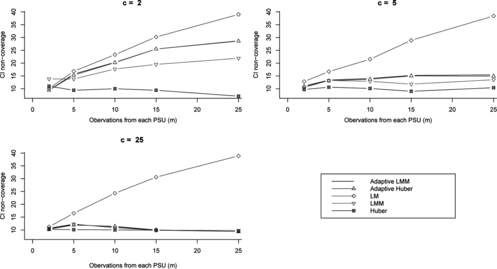
Figure 6 Confidence interval lengths for different variance estimation methods and various numbers of PSUs (c) and units per PSU (m) for intraclass correlation (ρ) of 0.
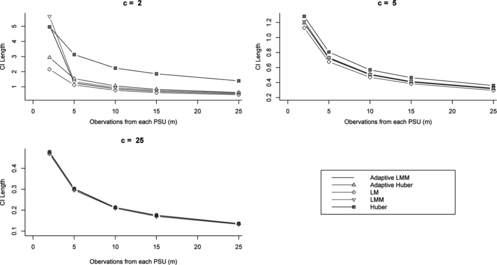
Figure 7 Confidence interval lengths for different variance estimation methods and various numbers of PSUs (c) and units per PSU (m) for intraclass correlation (ρ) of 0.05.
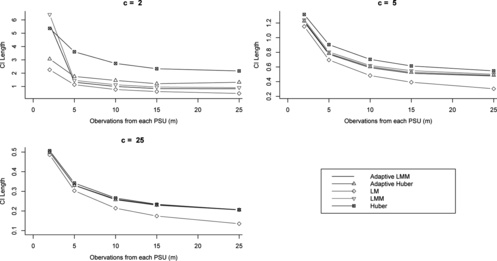
Figure 8 Confidence interval lengths for different variance estimation methods and various numbers of PSUs (c) and units per PSU (m) for intraclass correlation (ρ) of 0.1.
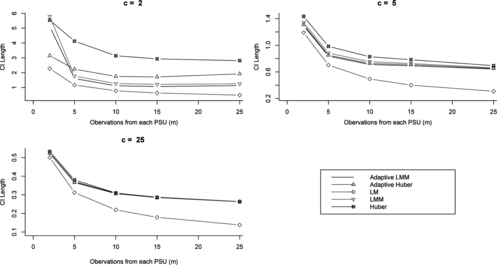
Table 1 Variance ratios, length, and non coverage of the 90% confidence intervals for β, and power of testing with ρ = 0
Table 2 Variance ratios, length, and non coverage of the 90% confidence intervals for β, and power of testing with ρ = 0.025
Table 3 Variance ratios, length, and non coverage of the 90% confidence intervals for β, and power of testing with ρ = 0.05
Table 4 Variance ratios, length, and non coverage of the 90% confidence intervals for β, and power of testing with ρ = 0.1
The variance estimators are approximately unbiased as all ratios are approximately 1. The only exception is the variance estimator using the LMM strategy, it tends to be biased when we have 2 PSUs with all numbers of observations per PSU for values of ρ of 0, 0.025, and 0.05. For ρ = 0.1, it tends to be biased when there are 2 PSUs with 5 or less observations per PSU. It tends to be biased when we have 5 PSUs with all numbers of observations per PSU in case of ρ = 0, as well.
Non coverage rates for confidence intervals for β were close to the nominal rate of 10% when ρ = 0 for all methods.
For ρ ≠ 0, Huber non coverage was close to 10% in all cases. When ρ was non zero, the LMM non coverage was high when c was 2 and m was high. LMM non coverage rates were reasonably close to nominal in all other cases.
The ADM and ADH methods generally had similar non coverage rates. Both had high non coverage when ρ and m were large and c was small. In particular, when c = 2 and m was 5 or more, or when c = 5 and m was 10 or more, the two adaptive methods had high non coverage (around 15–20%). In all other cases, the ADM and ADH non coverage rates were close to nominal.
Figure shows that LM non coverage was close to 10% when ρ = 0. It was very high otherwise as shown by Figs. and . Hence, use of LM without at least checking is not a viable strategy.
Figures show that confidence intervals using the LM strategy are the shortest, however this strategy is not viable because of its high non coverage when ρ ≠ 0. The Huber-based approach gives the widest confidence intervals in general. The ADM and ADH confidence intervals are almost always shorter than the LMM and Huber ones, respectively. When there were 2 and 5 PSUs it is very clear that ADM and ADH confidence intervals are much shorter than LMM and Hub confidence intervals, for all values of ρ ≠ 0. In the case where there were 25 PSUs, these lengths become closer.
5. Conclusions
1. Adaptive confidence intervals are non robust to intraclass correlation in designs with few PSUs and large sample sizes in each PSU. In these designs, even a small intraclass correlation will substantially inflate the variance of the mean, however the PSU-level variance component is unlikely to be statistically significant even if the intraclass correlation is as high as 0.1. As a result, when the number of PSUs (c) is 2 or 5, and the number of observations per PSU (m) is 25, both of the adaptive estimators have higher than desirable non coverage when the ICC is non zero, of the order of 15–20%. It appears that for extreme design where c is 5 or less and m is 25 or more, clustering must be allowed for in variance estimates, even if it is not statistically significant. However, provided c is 10 or more, clustering need only to be allowed for when is significant, even if m is large.
2. In comparing the Linear Mixed Model (LMM) with the adaptive version (ADM), we find that:
Both the LMM and ADM approaches have close to nominal non coverage, except for extreme designs of the kind discussed in 1. For these designs, the adaptive and non adaptive LMM methods both have high non coverage. In the case of the adaptive method, this is presumably because there is not much power to detect the PSU-level variance component, even when it is substantial. For the non adaptive LMM, the problem seems to be that the confidence intervals used are not exact and do not do well for very small sample sizes. | |||||
The ADM confidence intervals are noticeably narrower for c equal to 2 and 5, but there is not much to choose between ADM and LMM for c = 25. | |||||
3. In comparing the robust Huber–White approach with the adaptive version (ADH), we find that:
The Huber approach has close to nominal non coverage in all cases. So does the ADH approach, except for the extreme designs mentioned in 1. | |||||
The Huber method gives wide confidence intervals when c is small (2 or 5) even though the non coverage is close to the nominal 10%. This is because the degrees of freedom for this method is equal to (c − 1). ADH has much narrower confidence intervals, because its degrees of freedom are equal to (n − 1) rather than (c − 1) if the PSU-level variance component is not significant. | |||||
4. This leads to the following recommendations:
Designs with fewer than 10 PSUs, and a large sample size in each PSU should be avoided, even if the intraclass correlation is believed to be low. | |||||
Provided this advice is followed, clustering can be ignored if the PSU-level variance effect is insignificant. This gives close to correct coverage, while giving shorter confidence intervals (at least slightly). | |||||
5. Future research will focus on whether different criteria (other than significance for the PSU-level variance component) give better adaptive confidence intervals, and on unbalanced designs and non normal data. It is possible that model averaging of the linear and linear mixed models would improve on the coverage properties of the adaptive approach, even for highly clustered designs, and this approach would also be worth investigating.
Acknowledgments
An anonymous referee made detailed suggestions which considerably improved the article. The authors also thank Dr. Steven Roberts of the School of Finance and Applied Statistics at the Australian National University for his advice on model averaging.
References
- Al-Zou'bi , L. M. , Clark , R. G. , Steel , D. G. ( 2009 ). Adaptive inference for multi-stage survey data. Working Paper, No. 01-09. University of Wollongong .
- Clark , R. G. , Steel , D. G. (2002). The effect of using household as a sampling unit. Int. Statist. Rev. 70(2):289–314.
- Cochran , W. G. ( 1977 ). Sampling Techniques . New York : John Wiley & Sons .
- Commenges , D. , Jacqmin , H. ( 1994 ). The intraclass correlation coefficient: distribution-free definition and test . Biometrics 50 ( 2 ): 517 – 526 .
- Diggle , P. J. , Liang , K. Y. , Zeger , S. L. ( 1994 ). Analysis of Longitudinal Data . New York : Clarendon Press .
- Faes , C. , Molenberghs , H. , Aerts , M. , Verbeke , G. , Kenward , M. G. ( 2009 ). The effective sample size and an alternative small-sample degrees-of-freedom method . The Amer. Statistician 63 ( 4 ): 389 – 399 .
- Goldstein , H. ( 2003 ). Multilevel Statistical Models. , 3rd ed. Kendall's Library of Statistics 3. London : Arnold .
- Hoeting , J. A. , Madigan , D. , Raftery , A. E. , Volinsky , C. T. ( 1999 ). Bayesian model averaging: a tutorial . Statist. Sci. 14 ( 4 ): 382 – 417 .
- Huber , P. J. ( 1967 ). The behavior of maximum likelihood estimates under non standard conditions . Proc. Fifth Berekley Symp. Mathemat. Statist. Probab. Univ. California, Berekley 11 : 221 – 233 .
- Kenward , M. G. , Roger , J. H. ( 1997 ). Small sample inference for fixed effects from restricted maximum likelihood . Biometrics 53 : 983 – 997 .
- Kish , L. ( 1965 ). Survey Sampling . New York : John Wiley & Sons .
- Liang , K. Y. , Zeger , S. L. ( 1986 ). Longitudinal data analysis using generalized linear models . Biometrika 73 ( 1 ): 13 – 22 .
- MacKinnon , J. G. , White , H. ( 1985 ). Some heteroskedasticity-consistent covariance matrix estimators with improved finite sample properties . J. Econometrics 29 : 305 – 325 .
- Patterson , H. , Thompson , R. ( 1971 ). Recovery of inter-block information when block sizes are unequal . Biometrika 58 ( 3 ): 545 – 554 .
- Pfeffermann , D. , Skinner , C. J. , Holmes , D. , Goldstein , H. , Rasbash , J. ( 1998 ). Weighting for unequal selection probabilities in multilevel models . J. Roy. Statist. Soc. Ser. B 60 : 23 – 56 .
- Pinheiro , J. C. , Bates , D. M. ( 2000 ). Mixed-Effects Models in S and S-Plus . New York : Springer .
- R Development Core Team ( 2007 ). R: A Language and Environment for Statistical Computing . R Foundation for Statistical Computing, Vienna .
- Sahai , H. , Ojeda , M. M. ( 2004 ). Analysis of Variance for Random Models Volume 1: Balanced Data, Theory, Methods, Applications and Data Analysis . Boston : Birkhauser .
- Sahai , H. , Ojeda , M. M. ( 2005 ). Analysis of Variance for Random Models Volume 2: Unbalanced Data, Theory, Methods, Applications and Data Analysis . Boston : Birkhauser .
- Satterthwaite , F. E. ( 1941 ). Synthesis of variance . Psychometrika 6 : 309 – 316 .
- Self , S. G. , Liang , K. Y. ( 1987 ). Asymptotic properties of maximum likelihood estimators and likelihood ratio tests under nonstandard conditions . J. Amer. Statist. Assoc. 82 ( 398 ): 605 – 610 .
- Snijders , T. A. B. ( 2005 ). Power and sample size in multilevel modeling . Ency. Statist. Behav. Sci. 3 : 1570 .
- Sugden , R. A. , Smith , T. M. ( 1984 ). Ignorable and informative designs in survey sampling inference . Biometrika 71 ( 3 ): 495 – 506 .
- Verma , V. , Scott , C. , O'Muircheartaigh , C. ( 1980 ). Sample design and sampling errors for the world fertility survey . J. Roy. Statist. Soc. Ser. A 143 : 431 – 473 .
- Visscher , P. M. ( 2006 ). A note on the asymptotic distribution of likelihood ratio tests to test variance components . Twin Res. Hum. Genet. 9 ( 4 ): 490 – 495 .
- West , B. T. , Welch , K. B. , Galecki , A. T. ( 2007 ). Linear Mixed Models: A Practical Guide Using Statistical Software . London : Chapman and Hall/CRC .
- White , H. ( 1982 ). Maximum likelihood estimation of misspecified models . Econometrica 50 : 1 – 25 .
- Yuan , Z. , Yang , Y. ( 2005 ). Combining linear regression models: when and how? J. Amer. Statist. Assoc. 100 : 1202 – 1214 .