
 ?Mathematical formulae have been encoded as MathML and are displayed in this HTML version using MathJax in order to improve their display. Uncheck the box to turn MathJax off. This feature requires Javascript. Click on a formula to zoom.
Abstract
In this article, we propose two new scale invariant test statistics when the available data are subject to progressively Type-II censoring. The proposed tests are based on Gini index of spacings. It is observed thorough extensive Monte Carlo simulations that the proposed tests are quite powerful in compare to similar existing goodness-of-fit tests studied by Balakrishnan et al. and Wang. We also illustrate the method proposed here using a real data from reliability literature.
1. Introduction
In parametric procedures, we assume a specific distribution for a given dataset, on the contrary to the nonparametric methods that are distribution free and no particular probability model is considered. The goodness-of-fit technique first introduced by Karl Pearson (Citation1900) is a statistical procedure for testing whether or not a probability distribution may be considered for modeling a given set of data. Many authors have been considered this problem and presented several methods for complete and censored data. See, e.g., D’Agostino and Stephens (Citation1986), Huber-Carol et al. (Citation2002) and Nikulin and Chimitova (Citation2017) among others.
Censoring is a sampling method that allows the researcher to control the experimental time and costs by censoring a proportion of the sample while using the information of all the experimental units. Progressive Type-II censoring introduced first by Herd (Citation1956) and Cohen (Citation1963) is very common in reliability and life testing methods. In this type of censoring, n units are placed on a test according to the following plan. Remove R1 units when the first failure occurs. Remove R2 units when the second failure occurs. Finally, remove Rm units when the mth failure occurs. So, units will be censored and m failure will be observed. The vector
is called the progressive censoring scheme which is fixed prior to the study. See Balakrishnan and Aggrawala (Citation2000), Balakrishnan (Citation2007) and Balakrishnan and Cramer (Citation2014) for an excellent overview on progressive Type-II censoring and related developments.
Several authors have been considered the goodness-of-fit testing problem based on progressively Type-II censored data. Pakyari and Balakrishnan (Citation2012) presented a modification to the empirical distribution function (EDF)-based statistics. Balakrishnan, Habibi Rad, and Arghami (Citation2007), Rad, Yousefzadeh, and Balakrishnan (Citation2011), Park and Pakyari (Citation2015), Baratpour and Habibi Rad (Citation2016) and Noughabi (Citation2017b) proposed statistics based on Kullback–Leibler information. Balakrishnan et al. (Citation2002), Balakrishnan, Ng, and Kannan (Citation2004) and Pakyari and Balakrishnan (Citation2013) adopted spacings-based tests. Interested readers may also refer to Balakrishnan and Lin (Citation2003), Balakrishnan, Habibi Rad, and Arghami (Citation2007), Wang (Citation2008), Kohansal and Rezakhah (Citation2013) and Doring and Cramer (Citation2019) among others.
There are some discussions in the literature that tests based on empirical distribution function (EDF-based), such as Kolmogorov-Smirnov, Cramér-von Mises and Anderson-Darling perform well in determining differences between distribution functions, whilst tests based on spasings are usuful for detecting the differences between densities (see e.g., Pyke Citation1965).
In this article, we present a test statistic based on Gini index of spacings. Gini index is a measure of dispersion based on the sum of pairwise distances between spacings. Several authors have employed Gini index for the problem of goodness-of-fit in the case of complete samples. See e.g., Jammalamadaka and Goria (Citation2004), Noughabi, Arghami, and Mohtashami Borzadaran (Citation2014), Noughabi (Citation2017a). However, little works have been done when the available data are subject to censoring.
The rest of this article is organized as follows. In Sec. 2, the proposed test statistics are studied. The new tests are based on the weighted mean of the differences of overlapping spacings. The weights are designed in such a way that earlier differences assign more weights than the later differences. The power of these tests is studied by Monte Carlo simulations in Sec. 3. We will see that the new tests exhibit more power in comparison to competing spacing-based methods for most cases. We have considered the testing for the exponential and the normal models with different choice of alternative distributions. Finally, in Sec. 4, we present a real dataset and explain the proposed method.
2. Proposed tests
Let be the progressively Type-II right censored sample with progressive censoring scheme
from a distribution with CDF, F(x).
We are interested to test that the censored data come from a population with a specific distribution function That is, the null and alternative hypothesis are of the form:
Without loss of generality, one may use the probability integral transformation to reduce the above hypothesis to the hypothesis of uniformity by the transformation That is, the problem reduces to testing the hypothesis of the form:
(1)
(1)
The overlapping spacings are defined by
(2)
(2)
where
Note that γj is the number of items under risk before the jth failure has occurred. The defined above is called one-step spacings and is the differences between consecutive observations. If the null hypothesis Equation(1)
(1)
(1) is in fact false, then the spacings in Equation(2)
(2)
(2) gives values more irregular than those from a uniform spacings. Hence, very small or very large values of Equation(2)
(2)
(2) will indicate highly irregular spacings and will tend to reject the null hypothesis of uniformity. Statistics of the form Equation(2)
(3)
(3) are of great interest in contexts like goodness-of-fit testing (see, e.g., Pyke Citation1965 and Kale Citation1969 for a somewhat back dated but an excellent review). The idea of spacings can be generalized to say h-step (or higher-order) spacings for
defined by
Note that are the spacings between h observations (see, e.g., Hartley and Pfaffenberger Citation1972).
Jammalamadaka and Goria (Citation2004) introduced the Gini index of spacings for complete data defined by This measure of dispersion provides sum of pairwise distances between the spacings. In this paper, we introduce the Gini mean difference of spacings for progressively Type-II censored data and propose two test statistics based on that, say
(3)
(3)
where
is the number of double sigma terms and
and
are decreasing weights defined respectively by:
and
Note that for k = 1, 2. The two weights
and
are defined to be decreasing so that more weights are assigned to adjacent spacings. Also,
employ linear weights whilst
assigns quadratic weights. The exact distribution of G1 and G2 is not specified and in Sec. 3 we will use Monte Carlo simulations to find the emprical critical points. We will show that these tests exhibit more power in compare to existing tests based on spacings. The test statistics G1 and G2 are clearly location-scale invariant, with large and small values tend to rejection the null hypothesis.
Note that one may consider the generalized Gini mean difference of spacings defined by
We have not considered this statistic here, however the special case of r = 2 corresponds to the Greenwood statistic (Greenwood Citation1946).
3. Simulation study
In this section, we will study the power of the proposed test statistics G1 and G2 thorough extensive Monte Carlo simulations using statistical software R. We generated 100, 000 random samples for different combinations of sample size n, number of failures m and censoring schemes R. The tests are evaluated at the 5% and 10% significance levels. We used the 27 censoring schemes employed by Balakrishnan, Ng, and Kannan (Citation2004) and these are listed in for convenience.
Table 1. Progressive censoring schemes used in the Monte Carlo simulations.
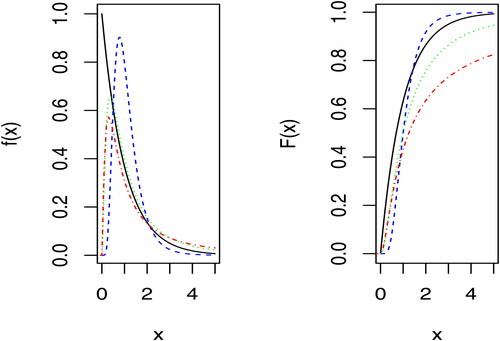
We studied testing for the exponential and normal models as the null hypothesis. For the exponential model we considered the log-normal (LN) and F distributions as alternatives. Specifically, the following alternatives were used:
1. The log-normal distribution with scale parameter 1.0 and shape parameters 0.5 and 1.0, denoted, respectively, by and LN(0, 1) with the following pdf:
where μ and σ are the mean and standard deviation of the logarithm. Both alternative models have skewed to the right density functions; however, the
model is almost symmetric and will be easily distinguishable from the exponential distribution.
2. The Fisher’s F distribution with (5, 2) degrees of freedom denoted by F(5, 2) with pdf given by
This alternative model has positively skewed density function. All the pdfs and CDFs are depicted in .
Figure 1. Plot of pdf and CDF of standard exponential (solid black line), (dashed blue line), LN(0, 1) (dotted green) and F(5, 2) (dotted dashed red line).
See Johnson, Kotz, and Balakrishnan (Citation1994, Citation1995) for detailed discussion of the above mentioned distributions. We compare the empirical powers for the above mentioned alternatives to the Wang (Citation2008) statistic:
where
are the spacings based on the censored data
Note that the Wang statistic TW has chi-squared distribution with
degrees of freedom under the null hypothesis of exponentiality.
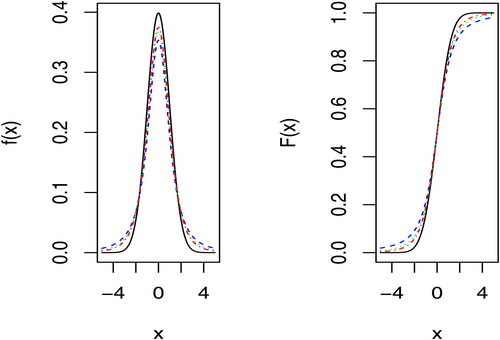
For testing the normal distribution we considered the student’s t distribution with 2, 3 and 4 degrees of freedom, denoted respectively by t(2), t(3), and t(4). In , the pdfs and CDFs of the normal model and the alternative student’s t models are depicted. We compared the empirical power with the Balakrishnan, Ng, and Kannan (Citation2004) statistic
where
and
is the expected value of the ith progressively Type-II censored order statistic from the standard normal distribution. We used Royston (Citation1982) approximation for
as
in our simulation study.
Figure 2. Plot of pdf and CDF of standard normal (solid black line), t(2) (dashed blue line), t(3) (dotted green) and t(4) (dotted dashed red line).
shows the empirical power when testing for exponential model with alternative distributions LN(0, 1) and F(5, 2) for 5% and 10% significance levels. In most cases except the proposed tests G1 and G2 exhibit more power in compare to the Wang statistic. Indeed, for the log-normal alternative G2 outperforms G1 and both perform better than Wang statistic for most cases, specifically for LN(0, 1). In F(5, 2) alternative, for almost all schemes both tests G1 and G2 performs better than the Wang statistic TW. Moreover, for scheme numbers 2, 5, 8, 14, 17 and 23 (all corresponding to the conventional Type-II right censoring), the G2 statistic performs than G1.
Table 2. Estimated power (%) for the log-normal and F distribution when testing for exponential model with and
(in parenthesis).
shows empirical power for the student’s t distribution with 2, 3, and 4 degrees of freedom when testing for the normal model at the 5% and 10% significance levels. Note that as one would expect, the power will decreases as the degrees of freedom increases. This is due to the fact that the t distribution will tend to the normal distribution with increase of the degrees of freedom and therefore any test will encounter difficulties to distinguish between the two distributions. It is observed from the table that the Balakrishnan, Ng, and Kannan (Citation2004) statistic, TB works better for smaller sample size, however for larger sample sizes () starting from scheme 10, the proposed tests outperform the TB statistic, except for the schemes corresponding to the conventional Type-II censoring. Moreover, the test statistic G2 shows better power than G1 for most cases.
Table 3. Estimated power (%) for the t distribution with 2, 3 and 4 degrees of freedom when testing for normal model with and
(in parenthesis).
In summary, our proposed test statistics G1 and G2 perform well in compare to the existing test statistics and among them G2 is the one that we recommend.
4. Illustrative data analyses
In this section, we illustrate the proposed goodness-of-fit procedure discussed earlier with a real dataset. The data is concerning times to breakdown of an insulating fluid tested at 34 kilovolts (see Nelson Citation1982, Table 6.1, 228). Wang (Citation2008) randomly generated a progressively Type-II censored sample of size m = 8 from n = 19 observations. The log-data, the progressive censoring scheme employed and the spacings are given in . We are interested to test the suitability of the exponential model to the log-data. Note that and the test statistic G1 and G2 are given, respectively, by
Table 4. Insulating fluid log-data.
and
We used the Monte Carlo simulation to estimate the p-values; and
The values of the test statistics and the corresponding p-values are presented in . The p-values in strongly suggest the exponential model for the log-data by all the test statistics. This result is consistent with the conclusion of Nelson (Citation1982), Viveros and Balakrishnan (Citation1994), Balakrishnan et al. (Citation2002) and Wang (Citation2008).
Table 5. Test statistics and the corresponding p-values for the data in when testing for the exponential distribution.
Acknowledgments
We thank Open Access funding provided by the Qatar National Library.
Correction Statement
This article has been corrected with minor changes. These changes do not impact the academic content of the article.
References
- Balakrishnan, N. 2007. Progressive censoring methodology: An appraisal (with discussions). Test 16 (2):211–96. doi:10.1007/s11749-007-0061-y.
- Balakrishnan, N., and R. Aggrawala. 2000. Progressive censoring: Theory, methods, and applications. Boston, MA: Birkhäuser.
- Balakrishnan, N., and E. Cramer. 2014. The art of progressive censoring-applications on reliability and quality. New York: Birkhäuser.
- Balakrishnan, N., A. Habibi Rad, and N. R. Arghami. 2007. Testing exponentiality based on Kullback–Leibler information with progressively Type-II censored data. IEEE Transactions on Reliability 56 (2):301–7. doi:10.1109/TR.2007.895308.
- Balakrishnan, N., and C. T. Lin. 2003. On the distribution of a test for exponentiality based on progressively Type-II right censored spacings. Journal of Statistical Computation and Simulation 73 (4):277–83. doi:10.1080/0094965021000033530.
- Balakrishnan, N., H. K. T. Ng, and N. Kannan. 2002. A test of exponentiality based on spacings for progressively Type-II censored data. In Goodness-of-fit tests and model validity, eds. C. Huber-Carol, N. Balakrishnan, M.S. Nikulin and M. Mesbah, 89–111. Boston, MA: Birkhäuser.
- Balakrishnan, N., H. K. T. Ng, and N. Kannan. 2004. Goodness-of-fit tests based on spacings for progressively Type-II censored data from a general location-scale distribution. IEEE Transactions on Reliability 53 (3):349–56. doi:10.1109/TR.2004.833317.
- Baratpour, S., and A. Habibi Rad. 2016. Exponentiality test based on progressive Type II censoring via cumulative entropy. Communications in Statistics – Simulation and Computation 45 (7):2625–37. doi:10.1080/03610918.2014.917673.
- Cohen, A. C. 1963. Progressively censored samples in life testing. Technometrics 5 (3):327–9. doi:10.1080/00401706.1963.10490102.
- D’Agostino, R. B., and Stephens, M. A. (Eds.) 1986. Goodness-of-fit techniques. New York: Marcel Dekker.
- Doring, M., and E. Cramer. 2019. On the power of goodness-of-fit tests for the exponential distribution under progressive Type-II censoring. Journal of Statistical Computation and Simulation 89 (16):2997–3034. doi:10.1080/00949655.2019.1648468.
- Greenwood, M. 1946. The statistical study of infectious diseases. Journal of the Royal Statistical Society 109 (2):85–110. doi:10.2307/2981176.
- Hartley, H. O., and R. C. Pfaffenberger. 1972. Quadratic forms in order statistics used as goodness-of-fit criteria. Biometrika 59 (3):605–11. doi:10.1093/biomet/59.3.605.
- Herd, R. G. 1956. Estimation of parameters of a population from a multi-censored sample [PhD thesis]. Ames, IA: Iowa State College.
- Huber-Carol, C., Balakrishnan, N., Nikulin, M.S. and Mesbah, M. (Eds.). 2002. Goodness-of-fit Tests and Model Validity. Boston, MA: Birkhäuser.
- Jammalamadaka, S. R., and M. N. Goria. 2004. A test of goodness-of-fit based on Gini’s index of spacings. Statistics & Probability Letters 68 (2):177–87. doi:10.1016/j.spl.2004.02.009.
- Johnson, N. L., S. Kotz, and N. Balakrishnan. 1994. Continuous univariate distributions. Vol. 1, 2nd ed. New York: John Wiley & Sons.
- Johnson, N. L., S. Kotz, and N. Balakrishnan. 1995. Continuous Univariate Distributions. Vol. 2, 2nd ed. New York: John Wiley & Sons.
- Kale, B. K. 1969. Unified derivation of tests of goodness of fit based on spacings. Sankhya, Series A 31 (1):43–8.
- Kohansal, A., and S. Rezakhah. 2013. Testing exponentiality based on Reny entropy with progressively Type-II censored data. ArXiv: 1303.5536v1.
- Nelson, W. 1982. Applied life data analysis. New York: John Wiley & Sons.
- Nikulin, M. S., and E. V. Chimitova. 2017. Chi-squared goodness-of-fit tests for censored data. Hoboken, NJ: John Wiley & Sons.
- Noughabi, H. A. 2017a. Gini index based goodness-of-fit test for the logistic distribution. Communications in Statistics-Theory and Methods 46 (14):7114–24.
- Noughabi, H. A. 2017b. Testing exponentiality based on Kullback–Leibler information for progressively Type II censored data. Communications in Statistics - Simulation and Computation 46 (10):7624–38. doi:10.1080/03610918.2016.1248569.
- Noughabi, H. A., N. R. Arghami, and G. R. Mohtashami Borzadaran. 2014. A test of goodness of fit based on Gini index. Istatistik 7 (1):23–32.
- Pakyari, R., and N. Balakrishnan. 2012. A general purpose approximate goodness-of-fit test for progressively Type-II censored data. IEEE Transactions on Reliability 61 (1):238–42. doi:10.1109/TR.2012.2182811.
- Pakyari, R., and N. Balakrishnan. 2013. Goodness-of-fit tests for progressively Type-II censored data from location-scale distributions. Journal of Statistical Computation and Simulation 83 (1):167–78. doi:10.1080/00949655.2011.625424.
- Park, S., and R. Pakyari. 2015. Cumulative residual Kullbak–Leibler information with the progressively Type-II censored data. Statistics & Probability Letters 106:287–94. doi:10.1016/j.spl.2015.07.029.
- Pearson, K. 1900. On the criterion that a given system of deviations from the probable in the case of a correlated system of variables is such that it can be reasonably supposed to have arisen from random sampling. Philosophical Magazine 50 (302):157–75. doi:10.1080/14786440009463897.
- Pyke, R. 1965. Spacings (with discussions). Journal of the Royal Statistical Society: Series B (Methodological) 27 (3):395–449. doi:10.1111/j.2517-6161.1965.tb00602.x.
- Rad, A. H., F. Yousefzadeh, and N. Balakrishnan. 2011. Goodness-of-fit test based on Kullback-Leibler infromation for progressively Type-II censored data. IEEE Transactions on Reliability 60 (3):570–9. doi:10.1109/TR.2011.2162470.
- Royston, J. P. 1982. Expected normal order statistics (exact and approximate). Journal of the Royal Statistical Society, Series C 31:161–5.
- Viveros, R., and N. Balakrishnan. 1994. Interval estimation of parameters of life from progressively censored data. Technometrics 36 (1):84–91. doi:10.1080/00401706.1994.10485403.
- Wang, B. 2008. Goodness-of-fit test for the exponential distribution based on progressively Type-II censored sample. Journal of Statistical Computation and Simulation 78 (2):125–32. doi:10.1080/10629360600944266.