?Mathematical formulae have been encoded as MathML and are displayed in this HTML version using MathJax in order to improve their display. Uncheck the box to turn MathJax off. This feature requires Javascript. Click on a formula to zoom.
Abstract
Test-item bias has become an increasingly challenging issue in statistics and education. A popular method, the Mantel-Haenszel test, is used for detecting non-uniform differential item functioning (DIF) but requires constructing several performance tiers to maintain robustness. The alternative Mantel-Haenszel (AMH) test was developed within the last three decades as a proxy procedure requiring only two scoring tiers. However, there needs to be more information on how essential factors like comparison group sizes and question discrimination affect its ability to detect bias. This study investigates how item difficulty and discrimination and the examined ratio between the focal and reference groups impact the likelihood of the AMH test detecting DIF. A comprehensive simulation study was conducted where the test scores were generated under three conditions. There are three commonly used difficulty levels (easy, medium, and hard), two discrimination levels (referred to as 'low’ and 'high’), and three group comparison ratios (1:1, 2:1, and 5:1). The simulation study showed the AMH test’s detection rates comparable to those of other standardized procedures like the Breslow-Day (BD) and even better. The current study aims to investigate and determine the factors that affect AMH test detection behavior. The study concludes with an application involving collegiate-level test data comparing students across genders and majors.
Introduction
Differential item functioning (DIF) is a widely employed assessment tool in fields such as quantitative psychology, educational measurement, business management, insurance, and healthcare (Holland and Wainer Citation1993). In large-scale assessments, the accurate detection of DIF is paramount to ensure that tests are fair and unbiased. Items that produce biased results can negatively impact examinees’ opportunities in education, employment, and other areas of life, particularly for minority or marginalized groups (Jensen Citation1980; Scheuneman and Bleistein Citation1989).
However, challenges arise when tests manifest undetected DIF are misdiagnosed due to detection procedure limitations. Such oversights can lead to biased assessments of individuals, resulting in incorrect conclusions about their abilities. The Mantel-Haenszel (MH) method, a popular tool for this purpose, has its own set of challenges. Given its widespread use in large-scale testing, it’s imperative to be aware of its limitations. For instance, the MH method may not be as adept at identifying non-uniform DIF compared to other techniques. This can lead to method discrepancies, especially when non-uniform DIF is present but goes undetected by the MH method (Hambleton and Rogers Citation1989). Furthermore, the efficacy of the MH test can be influenced by various factors, including purification procedures, data fit to the Rasch model, test contamination, and sample sizes (Guilera et al. Citation2013).
The implications of a Type I error, or a false positive, in DIF detection using the MH method, can be profound. It could result in incorrect conclusions about student ability differences in educational contexts, influencing curriculum modifications, resource allocation, or pedagogical strategies. Notably, when the number of score groups in the Mantel-Haenszel procedure is reduced, it can significantly elevate the Type I error rate, especially if the ability distributions of the reference and focal groups are disparate (Clauser, Mazor, and Hambleton Citation1994). In professional environments, such errors might lead to unwarranted changes in certification exams or introduce biases in recruitment decisions.
Understanding the distinction between non-uniform and uniform DIF necessitates clearly explaining the concepts. Non-uniform DIF occurs when the relationship between item performance and group membership varies across ability levels, meaning that the probability of a correct response between the reference and focal groups changes along the ability continuum. This Type of DIF is represented by non-parallel item characteristic curves (ICCs) (Walker Citation2011). On the other hand, uniform DIF occurs when the relationship between item performance and group membership remains constant across ability levels, indicating that the difference in the probability of a correct response between the reference and focal groups stays the same along the ability continuum. Uniform DIF is represented by parallel ICCs (Amaechi and Onah Citation2020; Walker Citation2011; Ayilara et al. Citation2022).
Several studies have shown that various conditions, such as significant differences in sample sizes, item performance, and ability distributions between groups of examinees, can tremendously affect how often the Mantel-Haenszel (MH) procedure detects non-uniform DIF correctly (Rustam, Naga, and Supriyati Citation2019; Herrera and Gómez Citation2008; Marañón, Garcia, and Costas Citation1997; Mazor, Clauser, and Hambleton Citation1992, Citation1994; Narayanan and Swaminathan Citation1994; Narayanon and Swaminathan Citation1996; Swaminathan and Rogers Citation1990).
Mazor, Clauser, and Hambleton (Citation1994) attempted to determine whether a simple adjustment of the MH procedure could improve detection rates for items showing non-uniform DIF. The researchers developed an ingenious alternative Mantel-Haenszel (AMH) procedure. They suggested that by partitioning examinees based on the average test score, particularly separating the examinees into either a 'high’ or a 'low’ scoring group, the MH procedure could be repeated three times for each item, once for the total group, once for the high-scoring group, and again for the low-scoring group. Thus, it should detect both uniform and non-uniform DIF. The study results concluded that the procedure helps to increase detection rates without increasing the Type I error rate.
MH and BD procedures
The MH technique is a Chi-squared contingency table-based method that detects the differences between reference and focal groups on all test items one by one. The total test scores define the ability continuum, divided into k intervals that serve as a basis for matching the two groups’ members. A comparison of both groups at each interval of k is made through a 2 × 2 contingency table. The table’s rows represent the group membership (reference or focal), whereas the columns represent the correct or incorrect responses to the studied item, as shown in . The reference group refers to the group that an item is suspected of favoring. In contrast, the focal group refers to the group where the item is suspected to function differently (Holland and Thayer Citation1986; Rustam, Naga, and Supriyati Citation2019; Khoeruroh and Retnawati Citation2020; Tang, He, and Tu Citation2023).
Table 1. Summary of data from the jth 2 × 2 contingency Table.
In ,
and
are the number of examinees in each cell in the jth stratum,
represents the total number of examinees in the jth stratum.
and
represents the numbers of examines in the reference and focal groups in the jth stratum, respectively.
and
represents the number of examinees who answer the studied item correctly and incorrectly, respectively. According to Mantel and Haenszel (Citation1959), the MH Chi-square test statistic is defined as:
(1)
(1)
where
and
The Mantel-Haenszel (MH) and Breslow-Day (BD) procedures are standard methods for detecting differential item functioning (DIF). Both methods have their respective strengths and weaknesses, which must be carefully considered when detecting non-uniform DIF. The MH procedure is widely utilized for its simplicity, practicality, and effectiveness in detecting uniform DIF. However, it may yield misleading results when applied to non-uniform DIF, particularly under conditions with unequal sample sizes, non-normal ability distributions, or complex models (Holland and Thayer Citation1986). Despite these limitations, the MH method remains popular because it is easy to implement, does not require iterative calculations, and often provides satisfactory results for uniform DIF detection. Researchers should be aware of these limitations when using the MH procedure and consider its appropriateness based on the characteristics of the data at hand (Li Citation2015).
The BD procedure is specifically designed for analyzing non-uniform DIF, as it assesses odds ratio heterogeneity trends. While the method has significantly contributed to detecting DIF, it has some weaknesses, such as reduced accuracy compared to alternative methods like logistic regression (Aguerri et al. Citation2009). Additionally, the BD procedure can be sensitive to test assumptions, such as the assumption of equal variance between groups, which may only sometimes hold in practice (Penfield Citation2003). However, it is often combined with other methods, like the MH procedure, to improve overall performance and accuracy in detecting DIF.
The BD Chi-square statistic has an approximate Chi-square distribution with k-1 degrees of freedom under the null hypothesis. For a 2 × 2 × k contingency table, the BD Chi-square statistic is as follows:
(2)
(2)
where
is the MH estimator of common odds ratio.
and
are the mean and variance of
under the null hypothesis, respectively. For more details, please see Breslow and Day (Citation1980).
Aguerri et al. (Citation2009) used the BD procedure to detect non-uniform DIF when one group’s average ability was considerably larger than another group. They used the BD procedure to effectively determine factors that affect the non-uniform DIF detection rate. The BD procedure results were compared with logistic regression analysis (LR) and the standard MH procedure. The researchers found that the BD was better than the LR and the MH procedure. The method was also used to test several other parameters, including the sample size and item, to effectively determine factors that affect the BD procedure’s use to detect non-uniform DIF. According to Aguerri et al. (Citation2009), when the item with the greater discrimination and difficulty parameters for equally sized groups was omitted from the goodness-of-fit to the binomial distribution, the test returned a Type I error similar to the nominal one.
Penfield (Citation2003) performed a DIF to compare a single reference group and multiple focal groups in another study. According to Penfield, conducting a separate DIF test had several undesirable qualities, which included an increase in Type I error rate and the need for substantial time and computing resources. He suggested using a procedure with the ability to assess DIF across multiple groups to address these drawbacks. In this regard, the researcher conducted a study to compare three MH procedures: the MH Chi-square statistic with no adjustment to the alpha level, the MH Chi-square statistic with a Bonferroni adjusted alpha level and the generalized Mantel-Haenszel (GMH) statistic. From the study’s findings, GMH was the most appropriate method for assessing DIF among multiple groups.
Building on his earlier exploration of DIF methodologies, Penfield (Citation2003) conducted a simulation study to evaluate the statistical power and the rate of Type I error of BD and combined decision rule (CDR). The CDR method combines BD with the MH Chi-square test. The results showed that the CDR performance was better under various conditions regarding the Type I error rate and the statistical power compared to other methods. The results also indicate that CDR might be more accurate regarding DIF detection compared to other DIF detection methods that are commonly used.
AMH procedure
Since the development of the AMH procedure, studies investigating it have been rare; Mellenbergh and Fidalgo Aliste (Citation1997) compared the AMH procedure’s performance to that of the standard MH and iterative logit procedures. They found that the AMH procedure had a higher power rate than the other two procedures but later cautioned that the AMH procedure needed to be more robust. Their study showed significant relationships between sample size and DIF's effect on the performance of the AMH procedure. Several limitations surrounding the study nevertheless warrant further investigation. For instance, while the study considered two sample sizes (200 and 1,000), it conditioned the compared groups to have equal sizes. Additionally, the study investigated non-uniform DIF as a composite measure of both difficulty and discrimination. Finally, the researchers investigated symmetric non-uniform DIF, thus leaving gaps concerning how these factors affect asymmetric non-uniform DIF.
Building on these foundational studies, the present research is an extension of the study done by Mazor, Clauser, and Hambleton (Citation1994). It uses a predictive model to explain the rate at which a non-uniform DIF item is detected when partitioning subjects by high and low ability levels based on the average test score. In this respect, the study aims to achieve several objectives to understand DIF and approaches used to detect DIF. There are three research questions in this study. They are:
How sample size ratio, item difficulty, and item discrimination affect non-uniform DIF detection using the AMH procedure?
What factors affect the rate of detection of non-uniform DIF using the AMH procedure?
What are the conditions under which the AMH procedure works best in detecting non-uniform DIF compared to the BD procedure?
There were several predictors used in these models. They include item difficulty, item discrimination, and sample size ratios. As an extension to Mazor, Clauser, and Hambleton (Citation1994), the results also considered the case where the ability level distributions for the reference and focal groups were equal and unequal. Thus, this is also research to compare to the BD procedure described in Penfield (Citation2003). Ultimately, this study identified the significant factors contributing to the detection rates and the conditions in which the highest non-uniform detection rates occurred. This study concludes by applying the AMH and BD procedures on test data collected at a university-level introductory statistics course.
Method
The study combines methods described by Mazor, Clauser, and Hambleton (Citation1994) and Penfield (Citation2003), which used AMH and BD procedures. Those procedures are contingency table and non-model-based procedures, suitable for detecting non-uniform DIF discussed in the current study. There are three processes: simulating the data, assessing the non-uniform DIF items, and creating the regression models, which were conducted in SAS software version 9.4, using several procedures such as PROC IRT and PROC LOGISTIC. Each step was explained in the following subsections.
Simulating the data
Each simulation contains the item scores for a 75-item examination, in which the last three items are created to contain non-uniform DIF representing the studied items. The number of items is considered since it reflects similar large-scale assessments. For non-studied items (72 items), difficulty levels were generated from a normal distribution with a mean of zero and a standard deviation of one. The discrimination levels were generated from a lognormal distribution with a mean of 0 and a standard deviation of .35. These considerations are based on a similar study by Penfield (Citation2003). The guessing parameter for the non-studied items is .2. This set was also used for performance comparisons.
Parameters for the studied items are manipulated using the item response theory (IRT) procedure in SAS software to create non-uniform DIF based on six combinations between item discrimination and difficulty. It is worth mentioning that the three-parameter IRT model equation includes a scaling constant (D), which is usually set to D = 1.7 or D = 1 based on if the normal ogive or logistic metric is desired. In this study, the scaling constant (D) equals one. For more details regarding the scaling constant, interested readers are referred to Lord (Citation2012).
Two levels for item discrimination were tested, including low ( and
) and high (
and
). Three levels for item difficulty were considered; easy (
), medium (
), and difficult (
). These parameters are taken from Mazor, Clauser, and Hambleton (Citation1994). The guessing parameter, like the non-studied items, is set at .2. Three sample size ratios are considered in this study, namely 1:1 (
), 2:1 (
), and 5:1 (
). These ratios are similar to those from Penfield (Citation2003).
A total of 10,000 simulations were performed for each of the eighteen combinations of item discrimination, item difficulty, and reference-to-focal group ratio. These simulations are then stratified across two ability-level distribution conditions. The first case includes reference and focal groups from normal distributions with a mean of zero and a standard deviation of one. In the second case, the reference group’s ability levels remain unchanged, with the focus group having a mean of one standard deviation lower than the reference group. Based on the observed mean score, the simulation samples were partitioned into low and high-ability groups. The methods used in the studies by Penfield (Citation2003) and Mazor, Clauser, and Hambleton (Citation1994) are similar to the present method.
Assessing the non-uniform DIF
After creating the simulated item scores, the AMH and BD procedures were performed to determine whether non-uniform DIF is presented in the studied items. A significant level of 5% was considered in the current study for the following reasons: most quantitative research studies use a 5% level of significance. Secondly, it was proven that the Type I error rates were consistent at or below the nominal level of 5%, whether the group ability distributions were equal or unequal (Penfield Citation2003).
Type I error rates
In DIF studies, the Type I error (false positive) rate is defined as the percentage of simulations in which a null item is detected as having DIF while the item is free of DIF. Similar to detection (power) rates, Type I error rates for non-studied items were evaluated as a function of sample size ratios, item discrimination levels, item difficulty levels, and the reference and focal group ability distribution equality.
Creating the regression Models
Four logistic regression models were created to assess the likelihood of detecting non-uniform DIF from one of the studied items. Each of the two models will assess the DIF using the AMH and BD procedures, where each distinguishes between equal and unequal ability distributions. Each logistic regression model uses item discrimination, item difficulty, and group ratio as explanatory variables to predict the likelihood of detecting non-uniform DIF. The logit form of the logistic regression model is in the following form:
(3)
(3)
represents the log of the odds of detecting non-uniform DIF. Model regression estimates are produced from the logistic model. Akaike information criterion (AIC), Bayesian information criterion (BIC), C-statistic, and correct classification rate (CCR) were reported to provide the model’s diagnostic statistic.
In the current study, both information criteria, AIC and BIC, are used for model selection. These statistics give two different methods of adjusting the −2 log-likelihood statistic for the number of model parameters and the sample size used. According to Portet (Citation2020), the AIC is defined as:
(4)
(4)
where
is the maximized value of the likelihood function of the model, and
is the number of the model’s parameters. Likewise, the BIC can be defined as:
(5)
(5)
where is the number of observations in the model (Wit, Heuvel, and Romeijn Citation2012). For further information regarding other measures of the model fit, such as C-statistic and CCR, refer to Caetano, Sonpavde, and Pond (Citation2018) and Press and Wilson (Citation1978), respectively.
Participants and application study
This study used data obtained from the Department of Student Experience and the Department of Mathematics, Statistics, and Physics at a national university in Qatar. The sample consisted of 1040 undergraduate students enrolled in Introduction to Statistics course. Students took an exam containing 35 multiple-choice questions, of which five questions were selected for DIF analysis for illustration purposes.
Demographic information, such as test scores, gender, and major, was collected to classify the students into different membership groups. According to , based on gender, 49.42% of the students with a test score average of 71.16 (SD = 12.52) were males, while 50.58% with a test score average of 72.65 (SD = 12.59) were females. In terms of their majors, students were classified into two main categories: STEM and non-STEM majors. STEM major students represented 33.46% of the sample, while non-STEM students represented 66.54%. The average test score of STEM and non-STEM major students was 73.75 (SD = 14.63) and 70.98 (SD = 11.47), respectively.
Table 2. Demographics of application data.
Analysis and results
Simulation study
The Type I errors of the AMH and the BD procedures, which refers to the percentage of simulations in which the AMH and the BD procedures successfully detected the no DIF (null) items, are shown in and . Both tables reflect percentages as a function of RF, AL, and BL, but the two tables contrast by considering equal and unequal ability distributions.
Table 3. Detection rates from equal ability distributions for no DIF items (type I error rates).
Table 4. Detection rates from unequal ability distributions for no DIF items (type I error rates).
Upon a closer examination of the Type I errors for no DIF items under equal ability distributions, several nuanced observations emerge. For items with low discrimination and easy difficulty, the AMH procedure’s Type I error rates spanned from 4.45% to 6.01% across different R:F ratios, while the BD procedure’s rates ranged from 4.01% to 5.79%. Notably, in the 5:1 R:F ratio condition, the AMH procedure exhibited a slightly wider range. When considering items with low discrimination and medium difficulty, the AMH procedure’s rates varied between 4.55% and 6.04%, whereas the BD procedure’s rates were more constrained, lying between 4.08% and 5.36%. Both procedures showed comparable variability in this scenario. For items with low discrimination and hard difficulty, the AMH procedure’s rates were between 4.20% and 6.10%, while the BD procedure’s rates hovered between 4.10% and 5.74%. Here, the AMH procedure demonstrated a marginally wider range, especially evident in the 5:1 R:F ratio condition. When the discrimination was high, the AMH procedure’s Type I error rates generally spanned from 4.15% to 6.06% across all difficulty levels. In contrast, the BD procedure’s rates were slightly narrower, ranging from 4.00% to 5.94%. The AMH procedure showed a broader range, particularly in the "Easy" difficulty level with a 1:1 R:F ratio.
Several patterns emerge when examining the Type I errors for no DIF items under unequal ability distributions. For items with low discrimination and easy difficulty, the AMH procedure’s Type I error rates spanned from 4.08% to 6.04% across different R:F ratios, while the BD procedure’s rates ranged from 4.18% to 5.96%. Notably, in the 1:1 R:F ratio condition, the AMH procedure exhibited a slightly wider range. When considering items with low discrimination and medium difficulty, the AMH procedure’s rates varied between 4.19% and 5.56%, whereas the BD procedure’s rates were more constrained, lying between 4.32% and 5.92%. Both procedures showed comparable variability in this scenario. For items with low discrimination and hard difficulty, the AMH procedure’s rates were between 4.29% and 5.54%, while the BD procedure’s rates hovered between 4.29% and 5.88%. Here, the BD procedure demonstrated a marginally wider range, especially evident in the 1:1 R:F ratio condition. When the discrimination was high, the AMH procedure’s Type I error rates generally spanned from 4.16% to 6.06% across all difficulty levels. In contrast, the BD procedure’s rates were slightly narrower, ranging from 4.46% to 6.14%. The BD procedure showed a broader range, particularly in the "Easy" difficulty level with a 1:1 R:F ratio.
In summary, the Type I error rates for equal and unequal ability distributions indicate that both procedures, AMH and BD, maintained Type I error rates that were consistently at the nominal level of 0.05.
The detection rate of non-uniform DIF items, or the statistical power, refers to the percentage of simulations in which the AMH and the BD procedures successfully detected non-uniform DIF in the studied items (DIF items), which are shown in and . Both reflect percentages as a function of sample size ratios (RF), item discrimination levels (AL), and item difficulty levels (BL), but the two tables contrast by the consideration of equal and unequal ability distributions.
Table 5. Non-uniform DIF detection rates from equal ability distributions.
Table 6. Non-uniform DIF detection rates from unequal ability distributions.
For reference and focal groups with equal ability distributions, detection rates for studied items ranged from 25.86% to 100.00% for the AMH procedure and 9.74% to 99.98% for the BD procedure. The variability of detection rates was higher for the BD procedure than for the AMH procedure. The three highest detection rates for the AMH procedure occurred with items containing high ALs and easy BLs, while the three lowest detection rates occurred with items containing low ALs and medium BLs. A smaller number of combinations with high detection rates were observed for the BD procedure. The three highest detection rates were observed for the BD procedure when items contained high ALs and easy or medium BLs. The three lowest detection rates were for low ALs, 2:1 or 5:1 RFs, and medium or hard BLs. Regardless of the RFs, the AMH procedure had a lower potential of detecting non-uniform DIF when the AL was low and the BL was medium. Similarly, the BD procedure had a lower potential of detecting non-uniform DIF when the AL was low, and the BL was hard.
Similar behavior was observed with the two procedures when the ability distributions were unequal. Detection rates ranged between 22.85% to 100.00% for the AMH procedure and 7.41% to 99.98% for the BD procedure, with more variability in the BD procedure’s detection rates. The three highest detection rates for the AMH procedure were found in items containing high ALs and easy BLs, even though some high detection rates were observed even when the BL increased. The lowest detection rates for the AMH procedure were found when the AL was low and the BL was medium, regardless of the RF ratio. For the BD procedure, the highest detection rates were observed for items containing high ALs and easy or medium BLs. The lowest detection rates occurred with hard BLs and large RFs (7.41% and 7.51%). The results from both tables suggest that considering equal or unequal ability distributions does not significantly affect non-uniform DIF detection rates. Instead, the key factors include the size of the RF and item characteristics.
To further understand the behavior and dependence that the AL, BL, and RF have on non-uniform DIF detection rates, four full-effect logistic regression models were created to predict the likelihood of detecting item non-uniform DIF. They are detecting non-uniform DIF for the AMH procedure with equal ability distributions (Model 4a), detecting non-uniform DIF for the BD procedure with equal ability distributions (Model 4b), detecting non-uniform DIF for the AMH procedure with unequal ability distributions (Model 4c), and detecting non-uniform DIF for the BD procedure with unequal ability distributions (Model 4d). shows the estimates and standard errors from the four models and the AIC, BIC, c-statistic, and CCR to represent the model diagnostics.
Table 7. AMH & BD Full-Effects logistic Models.
It is important to note that the current study focused on Models 4a and 4c. Models 4b and 4d were created to compare the significance found in these models to those of Models 4a and 4c, thus identifying concordant and discordant predictor behavior when detecting non-uniform DIF using the AMH versus the BD procedures.
through of the Appendix shows model-building, main-effect models to demonstrate each predictor’s inclusion in the model and to determine whether a predictor’s inclusion affects the significance or change in its effect.
The AIC and BIC for Model 4a were 69,363.72 and 69,537.09, respectively, which are substantially lower than the AIC and BIC values from the main-effects models in . The c-statistic and CCR of 0.935 and 85.88%, respectively, suggest that this model possesses solid predictive power. The RF was found to have a powerfully negative effect on the detection of non-uniform DIF. Non-uniform DIF items from RFs of 2:1 and 5:1 had lower likelihoods of being detected than non-uniform DIF items from an RF of 1:1, which decreased the log of detection odds by 1.26 and 2.62 logits, respectively. The RF predictor behavior was found to be concordant with that of the RF predictor from Model 4b. The AL was found to be a poor predictor when estimating non-uniform DIF items and strongly discordant to the AL predictor’s behavior in Model 4b. Significant negative effects were present with the BL predictor. These effects suggest that non-uniform DIF items with hard BLs have lower detection rates than items with easy BLs when using the AMH procedure (). However, items with medium BLs have even lower detection rates (
). Two-way and three-way interactions of these predictors were found to be insignificant. Significant positive effects were present only for the interaction between the RF and BL, particularly for medium BLs items involving 2:1 RF (
) or 5:1 RFs (
). These significant interactions were discordant to the behaviors and significant interactions found in Model 4b with the RF and AL predictors (negative effects with the 2:1 and 5:1 RF levels with the high AL), RF and BL predictors (positive effect with the 5:1 RF with the hard BL level), the AL and BL predictors (negative effect with the high AL and hard BL), and all three predictors (positive effect with the 5:1 RF, high AL, and hard BL).
Model 4c had an AIC of 86,121.56 and a BIC of 86,299.44, which are lower than the AIC and BIC values of the main-effects models of . The c-statistic and CCR for Model 4c were 0.938 and 86.61%, respectively, which was just slightly higher than those calculated in Model 4d. The RF predictor was found to have a strong negative effect on non-uniform DIF detection. Items created from 2:1 or 5:1 RFs decreased DIF detection rates by −0.58 and −1.77 logits. It is interesting to recognize that the behaviors and significances observed with the RF predictor were similar in Models 4c and 4d, while the standard errors differed. One plausible reason could be the differences in the ability distributions. These results were similar to those in Models 4c and 4d, where the effects were negative, and the standard errors were equivalent. Discrimination was not statistically significant in Model 4c, which was the opposite of the effects observed in Model 4d. Strong significant effects were present with the BL on detection rates in Models 4c and 4d. Items with medium BLs decreased detection rates by 3.40 logits, but hard items tended to increase detection rates by 1.08 logits. These results were discordant with what was observed in Model 4d, in which medium and hard items exhibited a significant negative effect on the likelihood of detecting non-uniform DIF.
The similarities found in Models 4a and 4c suggest that some factors contribute to non-uniform DIF detection rates regardless of differences in ability level distributions. As the ratio of the reference and focal groups’ sizes increase, the likelihood of detecting non-uniform DIF with the AMH test may decrease. Results showed that groups with a 2:1 ratio item significantly decreased DIF detection between 0.58 logits and 1.26 logits. In comparison, groups with a 5:1 ratio item significantly decreased DIF detection between 1.77 to 2.62 logits. Medium items also significantly decreased DIF detection with the AMH procedure between 3.40 and 5.86 logits. However, the interaction of the RF and BL factors had a significant positive effect on non-uniform DIF detection as they increased the likelihood between 1.14 and 2.60 logits.
Real application
In the context of this study, "ability" denotes the students’ proficiency or competence in the subject matter, as gauged by their test scores from the "Introduction to Statistics" course. This construct of ability is central to the AMH procedure, emphasizing its importance in categorizing students into distinct ability levels to facilitate a DIF analysis. For the DIF analysis, students with test scores less than 70% (equivalent to a grade below C) were classified as having "Low Ability," while those who achieved scores of 70% or more (equivalent to a grade of C and above) were designated as having "High Ability."
cross-classified students according to their gender, major, and ability level. Around 41.44% of male students’ ability level was low, while 58.56% was high. For female students, the low and high ability percentage was 32.51% and 67.49%, respectively. Finally, 31.90% of STEM students had a low ability level, and 68.10% had a high ability level. For non-STEM students, 39.45% had low ability levels, and 60.55% had high ability levels.
Table 8. Ability level by gender and major.
shows the percentages of correct answers rate of study items, according to gender (study items are identified in , Appendix B). Around 64.4% of male and 59.51% of female students answered Item 1 correctly. For Item 2, 50% of male and 50.38% of female students answered it correctly. The correct answer rate for Item 3 was 83.85% for males and 73.95% for females. Around 86.19% of male and 79.85% of female students answered Item 4 correctly. Finally, the percentage of correct answers rate for item 5 was 63.42% for males and 76.81% for females.
Figure 1. Percentages of correct answers rate of study items by gender.
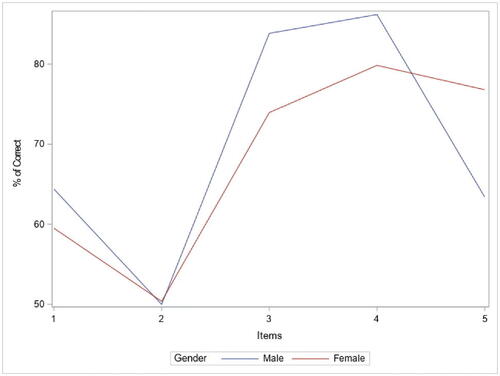
Figure 2. Percentages of correct answers rate of study items by major.
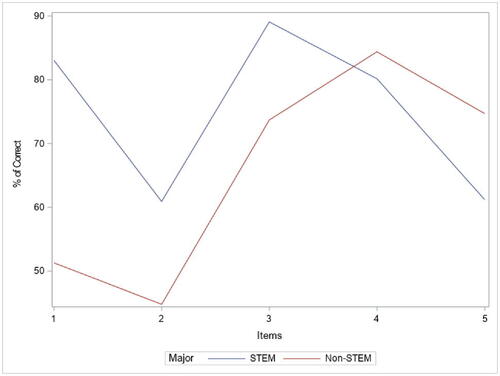
shows the percentage of correct answers rate of study items according to students’ major. Around 83.05% of STEM students and 51.3% of non-STEM students answered Item 1 correctly. For Item 2, 60.92% of STEM students and 44.8% of non-STEM students answered it correctly. The correct answer rate for Item 3 was 89.08% for STEM and 73.7% for non-STEM students. Regarding Item 4, 80.17% of STEM and 84.39% of non-STEM students answered Item 4 correctly. Finally, 61.21% of STEM and 74.71% of non-STEM students answered Item 5 correctly.
shows parameter estimation values for item guessing, difficulty, and discrimination parameters. The parameter estimates are obtained by maximizing the marginal likelihood using the quasi-Newton algorithm in the IRT procedure in SAS. The guessing parameters ranged between 0.129 and 0.171, suggesting that respondents with low ability may answer the questions correctly. Moreover, in terms of difficulty level, it ranged between −1.293 and 0.497. This indicates that Item 4 is the easiest and Item 2 is the hardest. The discrimination parameters ranged between 0.773 and 1.667. In general, if an item has the highest discrimination value, it may discriminate against examinees more accurately and clearly. Based on , Item 2 has the lowest discrimination value, whereas Item 1 has the highest value.
Table 9. Items parameter estimates.
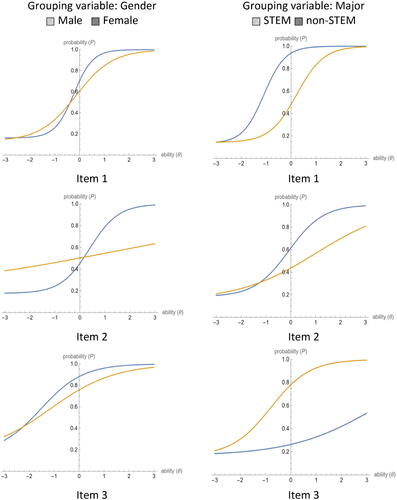
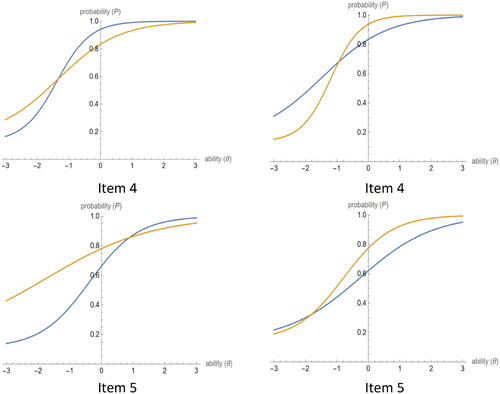
AMH and BD procedures are used to test the null hypothesis of no DIF detection (An Item is not biased). shows whether DIF is detected in different scenarios or not. The Type of DIF is decided based on the graphical illustration suggested by Amaechi and Onah (Citation2020) and Walker (Citation2011), where non-parallel ICCs refer to non-uniform DIF, as given in in Appendix C.
Table 10. DIF detection for different scenarios.
Item 1 was found to be a gender-bias item when using the BD procedure (Chi-square = 7.322, p-value = 0.007) and a major-bias item when using the AMH procedure (Chi-square = 98.823, p-value < 0.001) and the BD procedure (Chi-square = 5.408, p-value = 0.020). Concerning Item 2, it was found to be a gender-bias item when using the BD procedure (Chi-square = 16.692, p-value < 0.001) and a major-bias item when using both the AMH procedure (Chi-square = 22.260, p-value < 0.001) and the BD procedures (Chi-square = 7.119, p-value = 0.008). Item 3 was a gender-bias item when using both the AMH procedure (Chi-square = 15.812, p-value < 0.001) and the BD procedures (Chi-square = 17.275, p-value < 0.001), and a major-bias when using the AMH procedure (Chi-square = 32.516, p-value < 0.001). Item 4 was found to be gender-biased (Chi-square = 8.137, p-value = 0.004) when the AMH procedure was applied. Finally, Item 5 was found to be a gender bias (Chi-square = 20.305, p-value < 0.001), and a major-bias item (Chi-square = 22.253, p-value < 0.001), when the AMH procedure was applied.
Discussion
This study aimed to determine whether changes in sample size ratios of the reference and focal groups, item discrimination, and item difficulty affected how often the AMH and BD procedures detected non-uniform DIF. It also examined the factors that significantly affected the AMH procedure’s detection rate and whether particular combinations of these factors yielded higher detection rates with the AMH procedure compared to the BD procedure.
With equal ability distributions, the results suggest that the detection rate of non-uniform DIF using the AMH procedure is most affected by items with high discrimination, followed by items with easy item difficulty, and items answered by reference to a focal group of equal sizes. This was based on comparing the six most considerable detection rates in . Using the AMH procedure, items with high discrimination tend to have an 84% chance of being detected, 70% or more for items with easy difficulty, and 50% or more for items with equal reference and focal group ratios. Items associated with all three characteristics have the highest chance of being detected by this procedure. The order of these factors may be trivial since item characteristics have been shown to play an essential part in detecting non-uniform DIF using several other DIF procedures.
Differences in reference and focal group ratios have a significant negative effect when modeling non-uniform DIF detection rates. The significance becomes greater as the magnitude of the difference increases. Item difficulty also has a significantly negative effect on non-uniform DIF detection rates with the AMH procedure. Items with medium or hard difficulty exhibit lower chances of being detected, with medium-level items possessing the lowest detection chance. The negative effect for medium items slightly offsets higher group ratios.
For the unequal ability distribution case, the results are slightly similar. Items with high discrimination, followed by items with easy item difficulty, and then items answered by reference and a focal group of equal sizes offer the highest detection rates for non-uniform DIF with the AMH procedure. Items with high discrimination tend to have about 75% chance or more of being detected, 68% or more for items with easy difficulty, and about a 49% chance or more for items with equal reference and focal group ratios. These percentages are similar to those of the equivalent case. So, non-uniform DIF detection is believed to be insensitive to unequal ability levels between the reference and focal groups.
Group ratio and item difficulty still have significant effects on non-uniform DIF detection rates. Group ratio has a dominant-negative effect, and items involving higher ratios have a more substantial negative effect. Regarding item difficulty, medium items harm the detection rates of uniform DIF compared to easy items, but hard items have a positive impact. This behavior is in contrast to what was observed with the equivalent ability distribution case. It is also discordant with the behavior found that would be observed using the BD procedure, in which item difficulty has an entirely negative effect. provides a summary of the comparison between the AMH and BD methods for non-uniform DIF detection across various item discrimination, item difficulty, and group ratio combinations.
Table 11. AMH vs. BD performance in non-uniform DIF detection across item characteristics.
The results suggest that the effects of item difficulty and group ratios are similar to those observed using the BD procedure. However, the effects observed for item discrimination would differ. One possible reason could be that the test statistic formulas involved with the two methods are sample-size dependent. The AMH procedure is a particular situation of the MH procedure, and like other IRT-based methods, it is affected by item difficulty. Regarding sample size, it expresses how decreases in group sizes significantly affect the MH's ability to detect DIF-affected items.
The simulation study indicates that the AMH procedure detects non-uniform DIF, which is the best for items with easy difficulty levels or high discrimination. Test analysts should expect at least a 2.36:1 chance of successfully detecting non-uniform DIF when either property is present in an item.
Compared to the BD procedure, the AMH procedure has a higher chance of detecting non-uniform DIF items except when items contain high discrimination and medium difficulty. The AMH procedure yields the most substantial potential to detect non-uniform DIF items for easy difficulty or high discrimination and the weakest detection rates for low-discriminating, medium-difficulty items.
Results from the application study showed that out of ten scenarios, the AMH procedure detected DIF in seven scenarios. On the other hand, the BD procedure could detect DIF in only five scenarios. In agreement with the simulation study, results from the application study showed that the AMH procedure was more effective in DIF detection for both uniform and non-uniform cases compared to the BD procedure.
In response to the research questions, the findings reveal that when there is a significant difference in sample sizes between the groups studied, the performance of the AMH procedure in detecting non-uniform DIF is affected. The simulation study observed that the detection rate of non-uniform DIF was negatively impacted as the magnitude of the difference in sample sizes between the reference and focal groups increased. The application study also supported this finding, where the AMH procedure was more effective in DIF detection for both uniform and non-uniform cases when the groups had relatively similar sizes.
Moreover, the effectiveness of the AMH procedure was evaluated in different scenarios based on the sample size ratios between the reference and focal groups. The simulation study indicated that the AMH procedure was particularly effective in detecting non-uniform DIF for items with easy difficulty levels or high discrimination. The application study further supported these findings, as the AMH procedure successfully detected DIF in seven out of ten scenarios, while the BD procedure detected DIF in only five scenarios. These results suggest that the AMH procedure is generally more effective in detecting non-uniform DIF items, mainly when there are no significant differences in the sample sizes between the groups studied.
Based on the simulation and application studies, the AMH procedure generally had a higher chance of detecting non-uniform DIF items than the BD procedure, except for items with high discrimination and medium difficulty. The most favorable conditions for the AMH procedure were when items had easy difficulty or high discrimination. In contrast, the weakest detection rates occurred for low-discriminating, medium-difficulty items. These findings provide valuable insights for test analysts and researchers when choosing the appropriate method for detecting non-uniform DIF. The AMH procedure demonstrates better performance under specific conditions than the BD procedure.
There are exciting limitations worth noting regarding this research. First, in each simulation, the detection (power) rates were carried out with three study items. This can be extended using more study items containing non-uniform using AMH and BD procedures. Moreover, recall that the application study investigated 1,040 collegiate students from a national university, slightly smaller than the 1,200 to 2,000 observations used in the simulation study. Researchers may extend this research by increasing the ratio between the reference and focal groups, then examining how detectability will be affected by such changes.
Furthermore, this research used students’ test scores to categorize them into low and high ability levels, which is another limitation. Several other factors can signify or measure students’ ability, such as language and motivation to learn. A final limitation involved the types of DIF procedures performed. While the current study tested the effects of several factors on non-uniform DIF detection rate using AMH and BD procedures, additional procedures can be considered. Comparing AMH and BD procedures to other approaches such as IRT, logistic regression, and simultaneous item bias test (SIBTEST) procedures may interest some education analysts.
Conclusion
This study underscores the conditions under which the AMH procedure excels in detecting non-uniform DIF items. Specifically, the AMH procedure outperforms the BD procedure when items possess high discrimination or are of easy difficulty and when the ratios between reference and focal groups are either equal or not markedly different. However, a critical observation is that the AMH and BD procedures falter when confronted with low discrimination and medium difficulty.
Test analysts and researchers need to be cognizant of these conditions when opting for a DIF detection method. The efficacy of each method is contingent upon these factors; in situations where the AMH and BD methods show suboptimal performance, exploring alternative techniques or a fusion of methods might be a strategic move to enhance DIF detection precision.
While the study sheds light on the comparative performance of the AMH and BD procedures in varied scenarios, it is not without limitations, notably the number of items studied and the criteria adopted to gauge students’ abilities. Nevertheless, the findings serve as a beacon for test analysts and researchers in their quest for the most fitting method for non-uniform DIF detection. A deeper dive into diverse DIF procedures, exploration of varied conditions, and addressing the present study’s limitations can pave the way for more robust DIF detection methodologies in educational testing.
Disclosure statement
No potential conflict of interest was reported by the author(s).
References
- Aguerri, M. E., M. S. Galibert, H. F. Attorresi, and P. P. Marañón. 2009. Erroneous detection of non-uniform DIF using the Breslow-Day test in a short test. Quality & Quantity 43 (1):35–44. doi:10.1007/s11135-007-9130-2.
- Amaechi, C. E., and F. E. Onah. 2020. Detection of uniform and non-uniform gender differential item functioning in economics multiple choice standardized test in Nigeria. Journal of the Nigerian Academy of Education, 15 (2).
- Ayilara, O. F., T. T. Sajobi, R. Barclay, E. Bohm, M. Jafari Jozani, and L. M. Lix. 2022. A comparison of methods to address item non-response when testing for differential item functioning in multidimensional patient-reported outcome measures. Quality of Life Research 31 (9):2837–48. doi:10.1007/s11136-022-03129-8.
- Breslow, N. E., and N. E. Day. 1980. Statistical methods in cancer research. International Agency for Research on Cancer32:5–338.
- Caetano, S., G. Sonpavde, and G. Pond. 2018. C-statistic: A brief explanation of its construction, interpretation and limitations. European Journal of Cancer 90:130–2. doi:10.1016/j.ejca.2017.10.027.
- Clauser, B., K. M. Mazor, and R. K. Hambleton. 1994. The effects of score group width on the Mantel‐Haenszel procedure. Journal of Educational Measurement 31 (1):67–78. doi:10.1111/j.1745-3984.1994.tb00435.x.
- Guilera, G., J. Gómez-Benito, M. D. Hidalgo, and J. Sánchez-Meca. 2013. Type I error and statistical power of the Mantel-Haenszel procedure for detecting DIF: A meta-analysis. Psychological Methods 18 (4):553–71. doi:10.1037/a0034306.
- Hambleton, R. K., and H. J. Rogers. 1989. Detecting potentially biased test items: Comparison of IRT area and Mantel-Haenszel methods. Applied Measurement in Education 2 (4):313–34. doi:10.1207/s15324818ame0204_4.
- Herrera, A.-N, and J. Gómez. 2008. Influence of equal or unequal comparison group sample sizes on the detection of differential item functioning using the Mantel–Haenszel and logistic regression techniques. Quality & Quantity 42 (6):739–55. doi:10.1007/s11135-006-9065-z.
- Holland, P. W., and D. T. Thayer. 1986. Differential item functioning and the Mantel‐Haenszel procedure. ETS Research Report Series 1986 (2):i–24. doi:10.1002/j.2330-8516.1986.tb00186.x.
- Holland, P. W., and H. Wainer. 1993. Differential item functioning. New York, NY: Psychology Press.
- Jensen, A. R. 1980. Bias in mental testing. New York: Free Press.
- Khoeruroh, U., and H. Retnawati. 2020. Comparison sensitivity of the differential item function (DIF) detection method. Journal of Physics 1511 (1):012042. doi:10.1088/1742-6596/1511/1/012042.
- Li, Z. 2015. A Power Formula for the Mantel-Haenszel Test for Differential Item Functioning. Applied Psychological Measurement 39 (5):373–88. doi:10.1177/0146621614568805.
- Lord, F. M. 2012. Applications of item response theory to practical testing problems. New York, NY: Routledge.
- Mantel, N., and W. Haenszel. 1959. Statistical aspects of the analysis of data from retrospective studies of disease. Journal of the National Cancer Institute 22 (4):719–48.
- Marañón, P. P., M. I. B. Garcia, and C. S. L. Costas. 1997. Identification of non-uniform differential item functioning: A comparison of Mantel-Haenszel and item response theory analysis procedures. Educational and Psychological Measurement 57 (4):559–68. doi:10.1177/0013164497057004002.
- Mazor, K. M., B. E. Clauser, and R. K. Hambleton. 1992. The effect of sample size on the functioning of the Mantel-Haenszel statistic. Educational and Psychological Measurement52 (2):443–51. doi:10.1177/0013164492052002020.
- Mazor, K. M., B. E. Clauser, and R. K. Hambleton. 1994. Identification of non-uniform differential item functioning using a variation of the Mantel-Haenszel procedure. Educational and Psychological Measurement54 (2):284–91. doi:10.1177/0013164494054002003.
- Mellenbergh, G. J., and A. M. Fidalgo Aliste. 1997. IV Simposio de Metodología de las Ciencias del Comportamiento. Murcia: Universidad de Murcia, Servicio de Publicaciones.
- Narayanan, P., and H. Swaminathan. 1994. Performance of the Mantel-Haenszel and simultaneous item bias procedures for detecting differential item functioning. Applied Psychological Measurement 18 (4):315–28. doi:10.1177/014662169401800403.
- Narayanon, P., and H. Swaminathan. 1996. Identification of items that show non-uniform DIF. Applied Psychological Measurement 20 (3):257–74. doi:10.1177/014662169602000306.
- Penfield, R. D. 2003. Applying the Breslow-Day test of trend in odds ratio heterogeneity to the analysis of non-uniform DIF. Alberta Journal of Educational Research 49 (3):231–43.
- Portet, S. 2020. A primer on model selection using the Akaike Information Criterion. Infectious Disease Modelling 5:111–28. doi:10.1016/j.idm.2019.12.010.
- Press, S. J., and S. Wilson. 1978. Choosing between logistic regression and discriminant analysis. Journal of the American Statistical Association 73 (364):699–705. doi:10.1080/01621459.1978.10480080.
- Rustam, A., D. S. Naga, and Y. Supriyati. 2019. A comparison of Mantel-Haenszel and standardization methods: Detecting differential item functioning. Jurnal Matematika dan Pembelajaran 7 (1):16–31. doi:10.24252/mapan.2019v7n1a2.
- Scheuneman, J. D., and C. A. Bleistein. 1989. A consumer’s guide to statistics for identifying differential item functioning. Applied Measurement in Education 2 (3):255–75. doi:10.1207/s15324818ame0203_6.
- Swaminathan, H., and H. J. Rogers. 1990. Detecting differential item functioning using logistic regression procedures. Journal of Educational Measurement 27 (4):361–70. doi:10.1111/j.1745-3984.1990.tb00754.x.
- Tang, W., H. He, and X. M. Tu. 2023. Applied categorical and count data analysis. New York, NY: CRC Press.
- Walker, C. M. 2011. What’s the DIF? Why differential item functioning analyses are an important part of instrument development and validation. Journal of Psychoeducational Assessment 29 (4):364–76. doi:10.1177/0734282911406666.
- Wit, E., E. v Heuvel, and J.-W. Romeijn. 2012. All models are wrong…: An introduction to model uncertainty. Statistica Neerlandica 66 (3):217–36. doi:10.1111/j.1467-9574.2012.00530.x.
Appendix A.
Main effects logistic models
Table A1. AMH main effects logistic Models: Equal ability distributions.
Table A2. BD main effects logistic Models: Equal ability distributions.
Table A3. AMH main effects logistic Models: Unequal ability distributions.
Table A4. BD main effects logistic Models: Unequal ability distributions.
Appendix B.
Study items
Table B1. Study items included in real application.
Appendix C.
Item characteristic curves (ICCs) for study items
Figure C1. Item characteristic curves (ICCs) for study item.