Abstract
In this era of tightening budgets, librarians are increasingly turning to usage data from licensed resource providers to support difficult collection development decisions. The most recent release of the Counting Online Usage of NeTworked Electronic Resources (COUNTER) code of practice for usage data reporting and the Standardized Usage Statistics Harvesting Initiative (SUSHI) Extensible Markup Language (XML) protocol further support this decision-making process. COUNTER reports are designed to primarily measure usage of textual resources. However, for multimedia resources, the usage patterns and terminology are different than textual materials and the COUNTER reports do not yet adequately address these differences. This article explores the unique challenges of reporting and effectively evaluating the usage of multimedia resources and identifies gaps in the existing COUNTER code of practice.
The Counting Online Usage of NeTworked Electronic Resources (COUNTER) code of practice for usage reporting is becoming the industry standard in the library and higher education community. With the advent of the Standardized Usage Statistics Harvesting Initiative (SUSHI) protocol and software tools to help process COUNTER reports, librarians are increasingly able to use COUNTER usage statistics to guide their collection development decisions.Footnote 1 In the current economic climate, librarians need data to support their decision making, and they are demanding COUNTER-compliant reporting from all of their licensed resources.
The existing COUNTER reports are designed to measure usage of textual resources such as journals, e-books, and database indexes. However, for multimedia resources with content that is exclusively images, time-based media, or audio content, the usage patterns and terminology are different than for textual materials. For these non-textual resources, trying to produce usage statistics that conform to existing COUNTER standards is like trying to fit the proverbial square peg into the round hole.
In this article, we present some of the critical gaps in the existing COUNTER code of practice that must be addressed in order for multimedia resources to adopt these reporting standards. In addition, we will touch on some of the unique complexities reaching beyond the scope of COUNTER. While these complexities apply directly to multimedia resource use, they are potentially relevant for textual resources as well. These issues will be placed within the context of the shifting role of the library and the requests currently being made of library staff as they continue to manage and fund multimedia resources. Finally, we will share some thoughts on steps—either currently underway or possible for the future—that will address these issues.
BACKGROUND
Over the past decade, libraries have collected various types of data in order to try to assess the use of their collections. These have included looking at due dates stamped in the back of books, hash marks for re-shelved print journals, and circulation data obtained from the integrated library system. As increasing amounts of materials budgets were spent on electronic journals and databases, librarians requested and (usually) received usage statistics from individual vendors either by e-mail or direct download. The most recent release of the COUNTER code of practice for usage data reporting and the SUSHI Extensible Markup Language (XML) protocol are now addressing the need for reliable, consistent usage data for the resources libraries license for their users.
However, it is apparent that the development of COUNTER statistics was rooted in the specific needs of e-journals, indices, and books rather than non-text resources. The reason for this may be twofold. Over time, as libraries spent a larger portion of their materials budget on electronic resources, the data to justify the usage of these expensive journals and databases were crucial. Traditionally, non-textual resources, primarily in the humanities, have not cost as much as e-journals in other disciplines. In addition, until recently, multimedia assets such as images, audio, or video were primarily housed within the respective academic departments (for example, art history for the slide library or music for the music library). However, the digital era has led the library to become much more involved with multimedia resources. Denise Hattwig from the University of Washington recently observed:
Libraries have become increasingly interested in digital images, subscription image databases, and visual literacy. Visual resources collections are building digital image databases, and are often looking for the technological infrastructure and metadata expertise typically available in academic libraries. Additionally, many institutions are emphasizing university-wide, rather than departmental resources, particularly as digital resources make this a possibility, and budget realities require it. In this climate, many visual resources collections have moved out of departments and into their college and university libraries. Others have developed partnerships with libraries to further common goals.Footnote 2
According to the results of the Visual Resources Association (VRA) Professional Status survey, 18.6 percent of the digital image collections at academic institutions now reside within the university library, while an additional 49 percent reside in a cross-institutional setting (for example, a school within the university or at the college/university level), leaving 40 percent at the academic department level.Footnote 3 The trend of this change is also dramatic: according to the VRA survey, more than 37 percent of respondents started developing a digital image collection between 2004 and 2006. Thus, digital multimedia has only truly begun to take hold at institutions in the past five years, and the library's role with this media is likewise new and still very much evolving.
GEORGIA STATE UNIVERSITY LIBRARY PERSPECTIVE
Similar to other public research universities, over the past few years Georgia State University has experienced flat library materials budgets. The library, as part of the university and higher education in general, is operating in a climate of accountability and data-driven decision making. The library is compelled to prove that the funds it is spending on its collections are returning a high rate on the investment. In addition, the library looks at usage statistics as one measure of the success of user education in a particular subject area; low usage may indicate a need for better promotion of the resource to the intended user population. Usage statistics are one of the major tools available to make an informed, evidence-based decision in order to use limited funds in the most judicious way.
COUNTER-compliant statistics are easy to collect and compare across vendors. The library has been examining COUNTER statistics for journals, calculating cost-per-use, and using the data as one factor to determine serials cancellations. Georgia State's University Senate Library Committee asks to see periodic reports on usage of resources, and it is easy to produce a report that compares usage of databases from different vendors.
The issues with COUNTER reports for non-textual resources that are detailed above affect the library's ability to assess the value of these resources in a consistent way. The problem of obtaining comparable statistics for database usage becomes more acute when trying to compare non-textual resources that provide the same media type of content but come from different vendors, for example, two databases that provide images (ARTstor and CAMIO) or streaming music (Naxos and Classical Music Library). Because COUNTER Journal Report 3 (JR3) is optional, the library cannot depend on vendors that provide non-textual resources to produce that report. As one vendor states, “Some of our products (i.e., streaming video) do not neatly fall into COUNTER compliance categories, however, we provide statistics elements that mirror those as closely as feasible. At this time our reporting function merges three different COUNTER-based reports into a single output function, however this will be made more COUNTER compliant in the future.”Footnote 4 Therefore, the library relies on the statistics obtained from the vendors' sites, and however they choose to define and gather the types of statistics they provide. shows the statistics elements from two databases that provide streaming media.
TABLE 1 Examples of Statistics Elements from Two Streaming Media Databases
While some elements appear to be similar, without a standard to define these elements, the library cannot be sure the two databases are providing comparable data. A COUNTER report for non-textual resources would make it easy to collect and provide a comparison of, for example, image downloads for each of the image databases or music clips streamed for each of the music databases. Having a standardized definition for each of these metrics would allow a comparison to be made.
LIBRARIAN INFORMAL SURVEY: METHOD AND RESULTS
In order to gauge awareness in the library community of the unique complexities in collecting usage statistics for multimedia resources, a seven-question survey was distributed to the following electronic discussion lists in May 2010: Electronic Resources in Libraries (ERIL), Art Libraries Society (ARLIS), VRA, and Lib-License. Seventy-seven surveys were completed. The survey did not require participants to identify themselves, although they could select to provide their names, titles, institutional affiliations, and other contact information.
The majority of respondents to the survey worked at doctoral/research institutions, as seen in . When asked to indicate the primary area of work responsibility, the largest number were electronic resource librarians (see ). Most of the respondents to the survey work with usage statistics provided by the vendor, as well as COUNTER reports (). illustrates how respondents utilize usage statistics. It was surprising to the authors that so few respondents utilize usage statistics to evaluate the efficacy of instructional efforts.
FIGURE 1 Institutional affiliation.
FIGURE 2 Primary area of work responsibility.
FIGURE 3 Types of usage statistics used.
FIGURE 4 How usage statistics are used.
Most respondents felt current usage statistics provided by vendors meet their needs (), but open-ended survey questions revealed more confusion about this topic than revealed in this closed-response survey question. Comments indicated that the collection of these statistics was not, in fact, adequate for measuring use beyond the resource itself. Many respondents indicated that they were not currently measuring this usage either because they had not been asked to do so, or were not able to figure out a good way to do so. Respondents indicated they would be interested in exploring how they might measure use beyond the resource itself. As one respondent put it, “I'd like to if I knew how to do it—simply!” Another respondent commented, “we are expecting that usage info[rmation] for electronic resources outside the resource itself will become more important in the future but at the moment are not sure how to go about doing this.”
FIGURE 5 Do usage statistics currently meet your needs?
LIMITATIONS OF EXISTING COUNTER REPORTS FOR MULTIMEDIA RESOURCES
There are two key problems with use of the existing COUNTER code of practice to track multimedia resource usage. The first issue is the lack of appropriate metrics and reports, while the second involves the differences in terminology between textual and non-textual resources. In order to understand these issues, it may be helpful to start with a refresher on the COUNTER codes. There are two COUNTER codes of practice: the first for books and reference works (the first version of which was published in March 2006), and the second for journals and databases (the third release was published in August 2009). Of these, the Journals and Databases Code (hereafter referred to as Release 3) is more widely adopted and more relevant for our purposes. In Release 3 there are a total of twelve possible reports, with the main required reports falling into the following categories: journal reports versus database reports, and usage metric reports versus turnaway reports (see ).
TABLE 2 Required Reports in Release 3 of the COUNTER Code of Practice by Report Type
Based on this list, it is clear that all of the journal reports are inappropriate for non-text resources that are neither articles nor journals. Furthermore, turnaway reports are only relevant for resources that offer simultaneous user licensing, as opposed to unlimited simultaneous user licensing. So, for a non-textual, site-wide licensed resource such as the ARTstor Digital Library, the only existing COUNTER reports that could be provided would be Database Report 1 (DR1) or 3 (DR3), which are identical except that DR3 is for databases that are grouped together in a single licensed collection. An example of DR1 is shown in .
TABLE 3 Example of Database Report 1
The two usage metrics in these reports are sessions and searches. Herein lies the problem of the missing metric. While searches are an important type of use in non-textual resources, they are hardly the only one. And in the case of a resource such as ARTstor, they do not even make up the majority of use. As illustrates, searches make up only 23 percent of ARTstor's usage activity, while image requests (viewing, downloading, and printing) make up 41 percent. A discussion of the other 36 percent of usage activity, which falls under the category of nontraditional uses, is found below.
FIGURE 6 ARTstor usage by usage type (total events, January 2004 through September 2009).
While ARTstor and other non-textual resources might appear to resemble databases rather than electronic serials at first glance, in practice, their usage patterns are more closely aligned with e-journals, where the use of the content is equally as important as the searching of the content. What is currently missing in the COUNTER reports is a metric that would be equivalent to the full-text article request measure found in the Journal Report 1 (JR1) and Journal Report 5 (JR5). What is needed is something along the lines of multimedia full content unit request (albeit hopefully with a better name).
The question of naming leads to the second challenge of the existing COUNTER reports. The terminology used to describe e-journal usage simply does not apply when one is trying to analyze non-textual resources. An excellent illustration of this point is the optional JR3 from Release 3 (see ). While this report does support the reporting of non-textual content (as can be seen from the shaded rows in ), the terminology of this report clearly belies its text-based focus and origins. Concepts such as “Journal,” “Publisher,” and “Page Type” do not make sense in the context of an aggregated collection of images from multiple sources. Furthermore, non-textual resources do not have unique identifiers such as International Standard Serial Numbers (ISSNs). Text-based resources are now facing similar challenges in trying to develop unique identifiers for articles as they try to leverage and standardize item-level usage statistics.Footnote 5
FIGURE 7 Journal Report 3 from COUNTER Release 3.
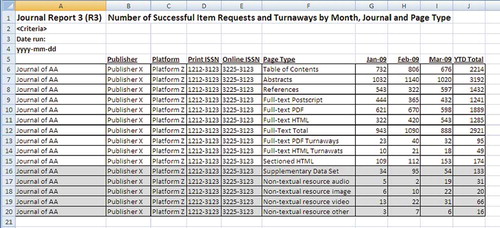
Referencing the glossary of Release 3 further confirms the problem with the existing COUNTER definitions of multimedia content. Non-textual resources, such as images, audio, and video, are defined as follows: “Non-textual material that is published in an online journal, book, or other publication that is associated with a full text article, encyclopedia entry or other textual material.”Footnote 6 This definition shows that the existing COUNTER reports have been expanded to handle multimedia content that resides within a textual resource, rather than multimedia content that exists as an independent entity. What is needed is a new version of the COUNTER reports and code for this type of solely multimedia resource. In the “Next Steps” section, we will discuss what steps are being taken to address this need.
OTHER CHALLENGES IN TRACKING USAGE OF NON-TEXTUAL RESOURCES
Beyond the text-centric focus of existing COUNTER reports, reliance on COUNTER usage statistics—or usage statistics of any sort—as the primary source for evaluating non-textual resources poses further challenges. These challenges fall into two categories: first, the problem of measuring non-traditional types of use that are becoming increasingly prevalent with the advent of more robust online environments, and second, the challenge of measuring use that occurs outside of the measurable environment.
Before discussing the measurement of nontraditional uses we must first define traditional uses. The COUNTER reports themselves essentially document this traditional use through the metrics they have selected to include in their reports. As discussed earlier, the COUNTER reports track two types of use: searches and item requests (in the case of journals, full-text article requests). An item request includes “viewing, downloading, emailing and printing of items.”Footnote 7 In other words, the COUNTER reports track what most users do with an electronic serials resource: searching for articles of interest, viewing those articles, and then printing, downloading, or e-mailing the articles for later reference.
In contrast, resources composed of primary source, multimedia content have had to support a more diverse range of uses based on the nature of the material provided. Simply printing an image is not useful for most purposes; users must be able to manipulate multiple images, including organizing, annotating, and analyzing them in order to support arguments.Footnote 8 To this end, ARTstor has developed a variety of tools to support this type of active use. This includes the ability to load external images into the ARTstor environment, to save groups of images for later use, to create course folders where students can study images, to zoom in on details of an image, to annotate images, and to create in-class presentations. These uses go well beyond simply viewing, printing, or downloading an item, yet they are all value-added uses that are tracked in ARTstor's custom usage statistics, comprising the remaining 36 percent of ARTstor's total usage (see ).
The measurement of nontraditional uses could be relevant for text-based resources as well, which are increasingly offering a suite of services for their users such as exporting citations and annotations.Footnote 9 It could be possible that in the future COUNTER will be able to develop standard metrics for some of these new uses. However, given the diversity of the features and the variation in the way these features are (or are not) tracked, it may be quite some time before the community develops and agrees on a standardized way to report these other types of nontraditional usage. For now, the only solution for librarians wanting to fully understand this type of usage is to take the time to look at the custom reports offered by individual resource providers in addition to COUNTER reports.
This brings us to perhaps the most perplexing challenge of multimedia usage statistics: how to account for use that occurs outside the measurable environment. The patterns of use for non-textual resources are different than textual resources. In the case of images, two of the most common forms of use are to gather a set of images together for in-class presentation and to post images to a course website for student use. While ARTstor offers a variety of tools to support these uses, it also recognizes that users can and will choose tools outside of the ARTstor environment, including Microsoft PowerPoint for in-class presentations and Blackboard for posting images for student study. Based on the results of a 2008 survey conducted by ARTstor, 82 percent of faculty at participating institutions use ARTstor content for in-class presentations.Footnote 10 At the same time, 72 percent of those faculty members report that they use PowerPoint to present that content. Sixty-one percent of undergraduates surveyed said they use ARTstor to prepare for tests or exams. In these instances, the only uses that are tracked in the ARTstor environment occur during the initial process of finding and exporting the images. All of the subsequent activity—from organizing the presentation, to giving the lecture, to making the presentation available on Blackboard, to having many undergraduates access the content for study—goes untracked (see ).
FIGURE 8 A typical ARTstor use case and activity tracked in ARTstor usage statistics.
It is important to note that student use of images (for example, the 61 percent that reported using images in Blackboard) can account for a significant portion of the total usage in this use case scenario. Many of ARTstor's highest use institutions are those who use ARTstor's software for posting images for student study. On a related note, use of ARTstor's course folders (within the ARTstor interface) for one art history survey course with over one hundred students can easily boost ARTstor use tenfold, as each of these students goes to ARTstor multiple times during the semester to study potentially hundreds of different images. Furthermore, when faculty choose to reuse image groups and lectures from semester to semester, this generates further use that is currently not credited back to the original resource.
NEXT STEPS
Fortunately, there are several ways to address the identified challenges. First, work needs to be done to define what a multimedia COUNTER code of practice would look like. Positive steps have been taken in this direction, as ARTstor and the Online Computer Library Center (OCLC) are serving on the COUNTER Technical Advisory Group to address this challenge. While this work is still in the earliest stages, COUNTER has acknowledged that there is a gap in the existing reports. It will be important to develop a multimedia COUNTER code that can work across media types (audio, video, and still images). There is a significant amount of work ahead as we determine how to develop a standard with application across such a diverse set of assets.
Beyond this effort, discussion among the broader COUNTER community must begin, with consideration given to the measurement of nontraditional uses. Given COUNTER's commitment to continually enhancing their codes, this seems to be another area that is ready for further exploration.
Finally, it is critical to raise awareness in the library community of the complexity of these issues. As discussed above, even when a multimedia COUNTER standard is developed, it is unlikely to address all of the challenges inherent in accurately assessing the value of multimedia resources. Therefore, it is important to help librarians understand how the patterns of use for these resources are unique. It is equally essential for librarians to work together with the traditional stewards of these resources (for example, visual resource professionals and audiovisual professionals) to determine how to bridge the gap between the traditional methods for assessing the value of departmental collections and the new requirements and expectations for standardizing usage statistics.
DISCUSSION
Following the authors' presentation, discussion revolved around specific concerns attendees had about the levels of granularity of future usage statistics reports and the question of whether or not it is the role of libraries to gather information about usage beyond the measurable environment.
Regarding granularity of future reports, attendees generally felt simpler reports would be easier to manage and to present to decision makers than highly granular reports. There was discussion about Digital Object Identifiers (DOIs), the difficulties in measuring use of streaming music resources, and the challenges faced by astronomy librarians. A governmental representative noted ISSN multimedia standards are under development. Attendees did comment that, overall, these multimedia usage issues are not yet being addressed sufficiently on their campuses.
Regarding use outside the measurable environment, it appears everyone is struggling with this issue. Several attendees noted such usage might be something the library should not measure and that other campus administrative bodies or institutional research boards might be better-equipped to analyze such usage patterns.
Notes
1. Innovative Interfaces, Inc., “ARL Libraries Get eResource Usage Stats Faster and Easier with Innovative ERM: Integration of SUSHI Standard Improves Access and Analysis,” news release, December 11, 2007, http://www.iii.com/news/pr_display.php?id=360 (accessed November 2, 2010). For more background on the development of the SUSHI protocol also see: Arthur Hendricks, “SUSHI, Not Just a Tasty Lunch Anymore: The Development of the NISO Committee SU's SUSHI Standard,” Library Hi Tech 25, no. 3 (2007): 422–429.
2. Denise Hattwig, “Common Threads: Libraries and Visual Resources Collections Merging, Partnering, and Finding New Ways to Work Together” (abstract for paper presented at the Visual Resources Association Annual Conference, San Diego, CA, March 14, 2008), http://vraweb.org/conferences/sandiego2008/sessions/session5/index.htm (accessed October 25, 2009).
3. Christine Hilker and Margaret Webster, “Results from the VRA Professional Status Survey” (paper presented at the Visual Resources Association Annual Conference, San Diego, CA, March 14, 2008), http://vraweb.org/conferences/sandiego2008/sessions/session5/HilkerWebster.pdf (accessed October 26, 2009).
4. Alexander Street Press, “Customer Usage Statistics, COUNTER Report,” http://stats.alexanderstreet.com/ASPWebStats/ (accessed October 26, 2009).
5. Christine Merk, Frank Scholze, and Nils Windisch, “Item-Level Usage Statistics: A Review of Current Practices and Recommendations for Normalization and Exchange,” Library Hi Tech 27, no. 1 (2009): 151–162. COUNTER is addressing this issue through the PIRUS project, see: PIRUS2 Project, “PIRUS 2—Publisher and Institutional Repository Usage Statistics,” news release, October 2009, http://www.cranfieldlibrary.cranfield.ac.uk/pirus2/tiki-index.php?page=News+release+-+October+2009 (accessed October 23, 2009).
6. “Appendix A: Glossary of Terms,” in COUNTER Code of Practice, Release 3 (n.p.: COUNTER, 2008), 11, http://www.projectcounter.org/r3/r3_A.doc (accessed August 5, 2010).
7. Ibid., 9.
8. Diane Harley and others, Use and Users of Digital Resources: A Focus on Undergraduate Education in the Humanities and Social Sciences (n.p.: Center for the Study of Higher Education, UC Berkeley, 2006), http://www.escholarship.org/uc/item/8c43w24h#page-1 (accessed August 5, 2010).
9. Deborah D. Blecic, Joan B. Fiscella, and Stephen E. Wiberly, Jr., “Measurement of Use of Electronic Resources: Advances in Use Statistics and Innovations in Resource Functionality,” College and Research Libraries 68, no. 1 (January 2007): 26–44.
10. Louise Kelly, “Fall 2008 ARTstor Registered User Survey” (working paper, ARTstor, 2008).