
 ?Mathematical formulae have been encoded as MathML and are displayed in this HTML version using MathJax in order to improve their display. Uncheck the box to turn MathJax off. This feature requires Javascript. Click on a formula to zoom.
Abstract
Objective: Design of Experiment (DoE), that is a tool of Quality by Design (QbD) paradigm, with which experiments can be planned more effectively and provide more information, while after Design Space (DS) can be set up, which assure the quality of the desired product. The aim of this study was to find the optimal drug-excipient ratio and the optimal process parameters (milling time, milling speed) of our previously used dry co-milling method and validate the DS.
Materials and methods: Lamotrigine (LAM), an antiepileptic drug was used as a model API. Poly-vinyl alcohol (PVA) was chosen according to our previous study as a hydrophylic matrix polymer. Milling time, speed, and the API:additive ratio was varied to find out their effect on the product. The optimization was performed on particle size of LAM, its standard deviation and the in vitro dissolution of the samples. Response surface modeling completed the statistical analysis that assessed the effects of independent variables on the responses.
Results: Due to the DS estimation, a more economical sample preparation method was set up. Finally, the sample that was prepared according to the optimized parameters (1.5 h, 400 rpm, 0.8 PVA:LAM ratio) showed around 100 nm drug particles and 97% drug release in five minutes.
Conclusion: From the DS generated by the software, an optimal formulation was obtained and the results validated the experimental design. The QbD approach was a useful and effective tool of understanding the parameters that affect the quality of the desired product.
Introduction
In the last few decades, dry milling – a top-down method to prepare particles with decreased size – has become a popular technology in pharmaceutical industry. Due to the rising number of poorly water-soluble drug candidates, it is necessary to use methods, which improve the water solubility and dissolution rate of these drugs, that can lead to increased bioavailability [Citation1,Citation2]. There are some other options to improve these attributions such as liposomes, co-solvents, amorphous solid dispersions, pro-drugs, complexation, cyclodextrin inclusion, self-emulsification, etc. [Citation3,Citation4]. Milling is an optimal method for particle size reduction, because of its simplicity, cheapness, and well plannability [Citation5]. It is also an environmentally and economically desirable method, as during the process no organic solvent is needed, that has potential toxicity issues and there is no significant loss of materials [Citation6]. The industrial application of co-milling is also common – not just in pharmaceutical industry, but also in e.g. food industry – as it can be starting, intermediate or finishing process. The approach is also a more gentle method compared to temperature dependent or solvent evaporation technologies, because during the process the heat does not damage the materials, so in most cases decomposition does not occur [Citation7].
Dry powder formulations are becoming widespread nowadays (oral powders, dry powder inhalations, nasal powders). The reason of the increasing number of formulations is that they offer better physicochemical and microbiological stability than liquid formulations. As a result, preservatives are not needed and also the unexpected incompatibilities are not common. Their shelf life is longer and the transport is much easier, but packaging must ensure protection against humidity and light [Citation8–12].
By using nasal powders local, systemic and CNS (central nervous system) effect can be achieved as the API can get in direct contact with the olfactory and respiratory epithelium. The nasal cavity can be divided into two main regions: the olfactory – and the respiratory region. The mucosa of the respiratory region is responsible for respiration, the regulation of humidity and temperature of inhaled air as well. The olfactory region, which is responsible for olfaction, is located high in nasal cavity. It overlies the cribiform plate, that has bony structure with many pores. These pores allow the neuronal bandles from the olfactory region to pass into the CNS. However, it is important to note that beside olfactory nerve, CNS effect can be achieved via trigeminal nerve. It is possible, because the neurons from the branches of trigeminal nerve pass directly through the mucosa. Via the respiratory region, the API can absorb through the GI tract, the lungs or directly to the systemic circulation from which it is delivered to the CNS [Citation13–15]. Intranasal powders can ensure higher administered dose compared to liquid forms, extended residence time in the nasal cavity due to their better adhesion, and better absorption ability through the nasal mucosa. However, the efficiency of a nasal powder is up to its dissolution rate in the nasal mucosa [Citation16–18]. The dissolution properties can be improved via numerous ways such as complexation with cyclodextrines or nanonization [Citation19,Citation20]. By using nanoparticles, the enhanced surface of the particles leads to rapid dissolution, fact that our research group has proved previously with powders that contained nanosized meloxicam [Citation22]. As lamotrigine (LAM) is only available in tablet form on market, it is desirable to develop nasal dosage forms of LAM as alternative drug administration to treat those situations when oral administration is not possible (e.g. absorption disorder, unconsciousness or in crisis therapy for rapid onset). Nasal powders are suitable – beside their advantages mentioned above –, to target directly the brain, therefore LAM can result in faster effect as its administration. The dissolution extent of LAM can also be improved by using poly-vinyl alcohol (PVA) and due to the decrease of crystallinity of LAM [Citation21]. The improved properties contribute to the fast dissolution and therefore to a rapid onset of action that are important properties of nasal products, especially powders [Citation22]. In order to get these features, it is important to know all the main influencing process and formulation parameters and their effect on the desired product.
To find the right parameters, Quality by Design (QbD) can be an option. This is a holistic approach within the development design based on knowledge and risk. With QbD, the experimental runs can be planned more economically and efficiently [Citation23–28]. Design of Experiment (DoE), a tool of QbD paradigm is a systematic approach. It allows to find optimal product and/or process parameters usually providing larger amount of information from less number of experimental runs. It is available by varying the factors and simultaneously evaluating the effect of multiple variables. DoE is also useful to identify the individual and interacting factors. Using response surface, methodology may lead to the development of Design Space (DS), which assure the quality of the desired product and can be defined for both the formulation and process parameters [Citation29–31].
In our previous study, where the aim was to produce nanonized LAM containing nasal powder, an initial Risk Assessment (RA) was applied [Citation32]. It was found out that among the Critical Quality Attributes (CQAs), the particle size, its distribution and the dissolution rate of LAM, while among the Critical Process Parameters (CPPs), the milling time, the speed and a critical formulation parameter, the LAM:additive ratio influence mostly the quality of the desired product. Though there are some publications that investigated nanosystems by using QbD [Citation24,Citation33–35], but to the best of our knowledge there is no study on powders that are containing nanoparticles. The combination of the advantages of nanoparticles and nasal powders can be a promising opportunity for the treatment of different CNS diseases and that is why optimal production parameters are required.
The aim of this study was to identify the DS by optimizing the parameters of a previously used dry milling method. The parameters were chosen according to preliminary tests and literature data. DS also allows to secure the quality of our samples and helps to find the optimal formulation for producing nasal powder formulation containing nanonized LAM particles. PVA was chosen according to our previous study, as a hydrophylic matrix polymer to prevent the nanoparticles from aggregation [Citation32]. As the fast dissolution is a critical parameter for nasal administration, the main aim was to reach nearly 100% drug release by production of nanoparticles of LAM.
Materials and methods
Materials
Lamotrigine, poorly water soluble (0.17 mg/ml at 25 °C) second-generation antiepileptic drug of the phenyltriazine class, was purchased from Teva Ltd. (Budapest, Hungary). Poly-vinyl alcohol (Mw = 27,000), water-soluble synthetic polymer – that was applied to stabilize the unique drug particles thus improving their absorption – was supplied by ISP Customer Service GmBH (Cologne, Germany).
Experimental methods
Experimental design
In our previous study, the QTPP (Quality Target Product Profile) had been defined. The most desired product characteristics were the nanoparticle size (50–200 nm) with narrow size distribution and rapid dissolution of LAM. In fact, this means that the drug nanoparticles are in direct contact with the mucosa using PVA resulted in fast dissolving depot with increased saturation solubility. To map the most critical factors on these characteristic properties, an Ishikawa diagram and initial RA was set up to identify the CQAs as well as the CPPs. As a result of RA results, it was found that among the CQAs, the particle size and dissolution rate of LAM, while among the CPPs the milling time, the milling speed and the API/additive ratio have the greatest influence on the quality of our desired product [Citation32].
To determine the optimal process parameters, a full factorial design was set up with three factors on three levels, using MODDE 11.1 software (Umetrics, Malmö, Sweden). The software generated 27 experimental runs as well as three center points used to calculate the degrees of freedom, the reproducibility. The milling time (X1), milling speed (X2), and the PVA:LAM (m/m%) ratio (X3) were selected as input variables indicated by RA. To characterize the powders, the following responses were chosen according to RA: average particle size of LAM (Y1) and its standard deviation (Y2), the percentage of dissolved LAM from the samples after 5 (Y3) and 10 min (Y4). The factor variation levels and the acceptable ranges of CQAs were chosen based on our previous study, prior knowledge and relevant literature () [Citation32]. The data fitting and the statistical parameters determination were done using the same DoE software. The effects of the independent variables were modeled using the Partial Least Squares method. ANOVA test was applied to evaluate the significance of models (p < .05).
Table 1. The parameters of milling, the chosen responses and their values.
For regression analysis, the goodness of fit, capacity of prediction, model validity, and reproducibility were considered. The goodness of fit of a model is given by the value of R2 and represents the variation of the response explained by the model. Q2 represents the goodness of prediction and reveals how well the model can predict new experiments [Citation30].
Model validity provides insights regarding the model error, while reproducibility (pure error) evaluates the variation of response under identical conditions compared to its total variation. Model validity parameter relies on lack of fit test carried out in ANOVA, and for its calculation, the p values are used. When there is no lack of fit (p > .05), the validity parameter will be above 0.25. Reproducibility is computed according to EquationEquation (1)(1)
(1) .
(1)
(1)
where MS is the variance.
Response contour plots were generated to allow illustrate the relationship between the different experimental variables and the responses. The establishment of a DS is based on the regression model and an estimation of the probability for failure. Monte Carlo simulations are used to compile the necessary probability statistics and risk analysis. The probability of getting predictions outside the response specifications were expressed as DPMO (defects per million opportunities). The result variation is a function of the number of simulations used; the more simulations, the better reproducibility. In this study, the settings were 20,000 simulations for the factor range estimation and 50,000 simulations for the final prediction. In order to evaluate the validity of the experimental design, optimum formulation was selected from the DS and the measured experimental values were compared to the predicted ones. When searching for a solution limited by many criteria, the result will be a compromise between those criteria. Finally, based on experimental results, the DS was determined.
Preparation of lamotrigine containing nasal powders and proven acceptable range (PAR) determination
PVA was used as an additive during the sample preparation process to maintain the stability and individuality of LAM particles. The given amount of PVA and LAM was mixed in a Turbula mixer (Turbula System Schatz; Willy A. Bachofen AG Maschinenfabrik, Basel, Switzerland) using 60 rpm for 10 min. After mixing, 1 g of sample was placed into a planetary ball mill (Retsch PM 100; Retsch, Neuhausen, Germany) and milled in a 50 ml capacity milling chamber. For milling, 10 steel balls (diameter 10 mm, weight of each ball 4.02 g) were used to get the co-milled samples. shows the factors and their variation levels along with the chosen responses and their values.
The PAR – that was generated by the software – according to the ICH Q8 guideline is ‘a characterized range of a process parameter for which operation within this range, while keeping other parameters constant, will result in producing a material meeting relevant quality criteria.’ The PAR of all responses is also indicated in .
Particle size determination with scanning electron microscopy (SEM)
The morphology of the powder microparticles was investigated by SEM (Hitachi S4700; Hitachi Ltd., Tokyo, Japan) at 10 kV. The samples were gold–palladium coated (90 s) with a sputter coater (Bio-Rad SC502; VG Microtech, Uckfield, UK) using an electric potential of 2.0 kV at 10 mA for 10 min. The air pressure was 1.3–13.0 mPa. Distributions of LAM particle diameter were obtained by analyzing SEM images with the ImageJ software (1.50i; Java 1.6.0_20 [32-bit]; Windows NT) environment using approximately 500 particles.
In vitro dissolution studies
The modified paddle method (USP dissolution apparatus, type II; Pharma Test, Hainburg, Germany) was used to examine the dissolution rate of LAM-containing co-milled nasal powders and determine the drug release profile from the samples. The test was carried out under nasal conditions for temperature and pH. The medium was 100 ml phosphate-buffered saline (PBS of pH 5.60 at 30 °C), in which 108 mg of the samples were tested. The paddle was rotated at 50 rpm, and the sampling points were at 5 min, 10 min, 15 min, 30 min, and 60 min. In the beginning, the sampling point was more frequent, because the beginning of the investigation is more important as the mucociliary clearance renews the mucus every 15 min [Citation16]. The following sampling points offered extra information about the dissolution behavior of LAM. After filtration, the drug contents of the aliquots were determined using spectrophotometry (Unicam UV/VIS Spectrophotometer) at 296 nm. The tests were carried out in triplicates.
Results and discussion
DoE analysis, summary of fit
The results of the experiments and the measured responses can be seen in Supplementary Table 1. It can be observed that the high milling time, speed and LAM:PVA ratio do not always result in small particle size, standard deviation and high dissolved amount of LAM.
To check the validity of the experimental design, the following statistical parameters were determined: R2, Q2, model validity, and reproducibility. The values of these parameters are presented in . All responses were fitted and well predicted by the model as R2 values were at least 0.8 and all the Q2 values were above 0.5. The validity value of the models was above 0.25 in each case, that indicates good model. The reproducibility values also presume that the process is well-reproducible as they were above 0.9. Model significance test using ANOVA generated lower .05 p values for all responses. Also there was no lack of fit detected, as the model error was not significantly different from the replicate error (p > .05) ().
Table 2. Summary of fit for DoE, ANOVA test results for model significance and lack of fit (p values).
Effect of the milling parameters on the responses
After evaluating the coefficient plots (), it can be seen that milling time and speed have effect on Y1. As the milling time and speed increase, the particle size of the API decreases, so it can be concluded that these parameters influence mostly Y1 and Y2. The values of LAM size were between 172 nm and 7015 nm. There were some samples, where the particles aggregated due to the inappropriate parameters, so the detection of unique particles was not possible.
Figure 1. The scaled and centered coefficient plots of the responses, where X1: milling time; X2: milling speed; X3: PVA:LAM (m/m%) ratio (X3).
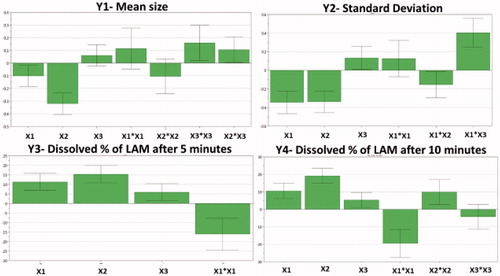
The same phenomenon was observed in the case of Y2. The increasing milling time and speed decreased Y2. This is related to the smaller particle size, because the particles became more unique, no aggregation occurred, so the particle size determination was more simple above certain parameter values. In the coefficient plot of SD, a significant interaction could be observed, but its interpretation is possible after the examination of the surface plots.
The Y3 and Y4 values increased due to the increased values of the milling parameters. The reason of this tendency is that the small particles can leave the matrix easier than bigger ones and also the bigger surface due to reduced particle size also advantageous, if the aim is rapid dissolution. However, in these cases, the PVA:LAM ratio has an effect on the dissolution rate due to the matrix effect of the polymer. A quadratic term between milling time is also observed in the coefficient plots.
Response surface plots
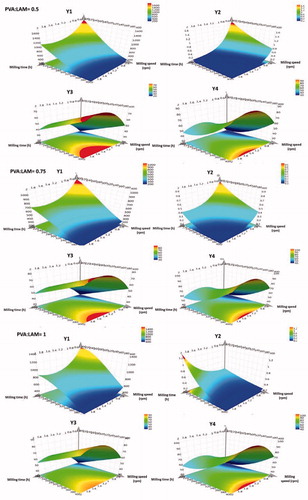
3D surface plots were generated to graphically illustrate the relationship between the input variables and responses. It allows to understand the impact of interactions via estimating the expected responses depending to the change in variables. The quality of the surface is related to the value of Q2. The higher the value, the better the quality it has.
In the case Y1, the response surface plots show, that the milling parameters have a nearly linear effect on the particle size. It presents that longer milling time and higher milling speed cause smaller particle size. The ranges of parameters to reach the desired response are quite wide, when the PVA:LAM ratios are 0.5 and 0.75. However, if the excipient:API ratio is 1 the desired particle size cannot be achieved. As Y2 related to the size of LAM, the same can be drawn for SD. High PVA:LAM ratio resulted in narrow optimal range and the desired target was possible to achieve in that case, when X3 was 0.75. A possible explanation of this phenomenon is that the PVA in higher concentration protects the LAM from the milling effect, therefore, the balls cannot decrease its particle size so easily.
The reverse phenomenon can be seen on the contour plots of Y3 and Y4. High PVA:LAM ratio causes wider optimal range due to the effect of PVA. PVA forms a matrix to the LAM particles from which they can release easier, if surface of the matrix is larger. The desired values of dissolution rate cannot be achieved, when the ratio of applied materials are 0.5 and 0.75 – to reach the minimum requirement is possible –, but achievable when it is 1. The variation range in the milling parameters is quite narrow as the target responses are difficult to reach.
According to the response surface plots, it can be concluded, that with high milling parameters the desired particle size (LAM particles below 250 nm) and SD can be reached, while the PVA:LAM ratio plays more important role in the dissolution of LAM. The surface plots underline the experiences gained during the study of scaled and centered coefficient plots ().
Figure 2. The surface plots show the effect of the milling time (X1), the milling speed (X2), and PVA:LAM ratio (X3) on the responses, which are average particle size of LAM (Y1) and its standard deviation (Y2), the percentage of dissolved LAM from the samples after 5 (Y3) and 10 min (Y4).
Design Space
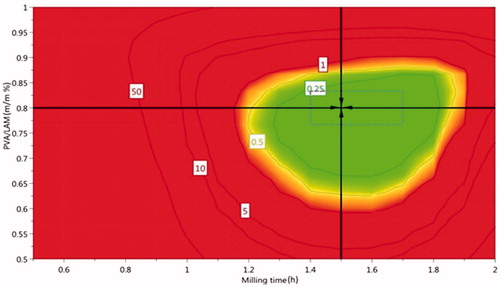
Major objectives of QbD are risk minimization and DS development for the product. Design Space plots are generated by superimposing several contour plots and combining it with probability analysis [Citation28–30]. Considering the models developed for the CQAs, Monte Carlo simulations were used to estimate the probability to meet the product specifications in the design region. The plot is a color coded region and contour lines that have the role to separate the design region according to the probability of failure expressed in percentage (%) of failure. The green region, with low probability of failure is named the DS.
The edges of the hypercube illustrate the generated PAR. The milling time was between 1.4 h and 1.7 h, while the PVA:LAM ratio was between 0.77 and 0.83 in the case of PVA/LAM ratio. The milling speed was kept constantly high, on 400 rpm as it had the narrowest variation range among the input variables and it had the highest influence on the responses according to the coefficient plots. The target values can be achieved using parameters between these ranges, that are nearby to 0 level in . MODDE can calculate a set point after running the optimizer that can estimate the tolerance available for the factors. During the setpoint analysis, a robustness estimate is calculated by adding disturbancers on the factors around the setpoint. In our study, it was also our aim to find the robust set point. It is a solution with maximum factor ranges that will predict results inside the specifications. Robust set point is actually the center of the green region that is in our case 1.5 h milling time with 0.8 PVA:LAM ratio on 400 rpm speed ().
Figure 3. The Design Space of the dry milling method. The edges of the hypercube are between 1.4 h and 1.7 h in the case of milling time, 0.77 and 0.83 in the case of PVA/LAM ratio, respectively. Milling speed is kept constantly 400 rpm. The parameters of robust set point are 1.5 h, 400 rpm, and 0.8 PVA/LAM ratio.
Validation of Design Space
As there are infinite good formulations, it seemed to be the most rational to keep the PVA/LAM ratio at the robust set point. In the case of milling speed, the interval was so narrow and lower speeds did not seem right previously, so it was kept on 400 rpm. Longer milling times than 1.5 h were not used, because in our previous study it was 2 h and it was an aim to make the process time effective. After the evaluation of the results of P7 – that was prepared according to the robust set point and the results proved to be good – it would have been irrational to use higher milling times. The regions of DS were expressed in % of failure, the validation of it was designed based on these regions. The first sample was prepared outside the 50% probability of failure (P1), the second was in the region of 50% probability of failure (P2), the third was in the near edge of 10% probability of failure (P3), the fourth was in the region of 5% probability of failure (P4), the fifth was in the near edge of 1% probability of failure (P5), the sixth was inside the region of 0.5% probability of failure (P6), and the last one was prepared according to the robust set point (P7). Validation samples were prepared with PVA/LAM ratio 0.8 on 400 rpm and by using different milling times, that was varied according to .
Table 3. The experimental plan of Design Space validation.
Particle size and morphology
After the particle size determination (), the following comments can be made: long milling time causes smaller mean size and standard deviation. This can be explained by the improving uniqueness of the LAM particles due to the milling. P7 sample showed the best values in this case too with very small average particle size of LAM (97.46 nm). This small particle size, the homogenous distribution and the uniqueness of the LAM particles () cause the API to leave the surface of the polymer easier. This property resulted in the best dissolution rate among the tested samples. The only sample that did not correspond to the criteria (the target particle size of LAM was 250 nm) was P1, that can be explained by the short milling time. In the SEM picture of the sample (), heterogeneous distribution, big sized particles and adhesion can be seen, that may lead to good dissolution, but due to these properties and high standard deviation, the reproducibility of the sample and these results are quite uncertain.
Figure 4. The SEM picture of sample P1 (A) and P7 (B).
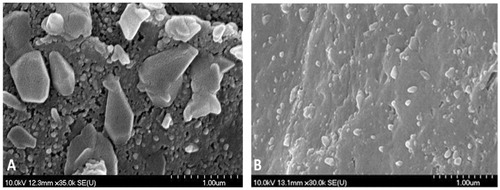
Table 4. The results of particle size analysis.
In vitro dissolution test
The results of in vitro dissolution test can be seen in . They show that the highest amount of LAM was dissolved from the sample that was prepared according to the robust set point. 80.48% of the API dissolved from the sample after 5 min and 97.32% after 10 min, respectively. It means that only this formulation fulfilled the predefined target response values (<85% dissolved LAM after 5 min, 100% dissolved LAM after 10 min). The rest of the formulations performed also well during the test, but not counting P7, just two formulations (P1, P4) responded to the predetermined criteria of this test. An explanation of the unexpected good dissolution results in the case of P1 can be, that there are small particles that can leave the polymer matrix easy as well as the aggregated particles can disaggregate easy. However, these mechanisms cannot be controlled that leads to uncertain reproducibility as it was mentioned above. The dissolution profiles of the samples can be seen in .
Figure 5. The in vitro dissolution profile of the powder formulations shows the dissolved amount of LAM during the investigation.
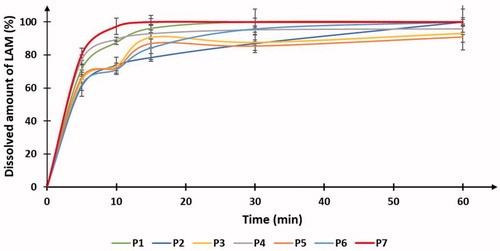
Table 5. The result of the in vitro dissolution rate study.
Conclusions
The aim of this study was to determine and validate the DS of a previously used dry milling method for producing nasal powders that containing nanonized LAM. The project was based on DoE, a tool of QbD with which the experiments can be planned more effectively, economically to provide more information from less number of experimental runs.
It can be concluded that the predictions of optimal parameters were correct, because all of the samples reached the minimal predetermined response values. If not, it was expected as the sample P1 that had the highest % of failure and the results of its tests were outside the minimal criteria in the case of particle size determination. Thanks to the DS estimation a more economical – time and material effective – sample preparation method was set up. Sample 7 that was prepared according to the robust set point (milling time: 1.5 h, milling speed: 400 rpm, PVA:LAM ratio: 0.8) showed the best responses that yielded close to the target values of the CQAs. It had the smallest particle size as well as the smallest SD. The results of in vitro dissolution test showed that the highest amount of LAM dissolved from this sample that can be promising starting point for achieving rapid onset of action. The validation was successful, so powder 7 can be a strong base of the nasal powder development that will be further tested using in vitro (dissolution and permeability) – and in vivo investigations.
Supplementary Table 1
Download PDF (129.7 KB)Disclosure statement
No potential conflict of interest was reported by the authors.
Related Research Data
References
- Garg A, Singh S, Rao VU, et al. Solid state interaction of raloxifene HCl with different hydrophilic carriers during co-grinding and its effect on dissolution rate. Drug Dev Ind Pharm. 2009;35:455–470.
- Isaac J, Ganguly S, Ghosh A. Co-milling of telmisartan with poly(vinyl alcohol) – an alkalinizer free green approach to ensure its bioavailability. Eur J Pharm Biopharm. 2016;101:43–52.
- Loh ZH, Samanta AK, Sia Heng PW. Overview of milling techniques for improving the solubility of poorly water-soluble drugs. Asian J Pharm Sci. 2015;10:255–274.
- Niwa T, Yoshida M, Hayashi N, et al. One step preparation of spherical drug particles by contamination-free dry milling technique with corn starch beads. Int J Pharm. 2017;528:624–636.
- Lim RTY, Ng WK, Tan RBH. Dissolution enhancement of indomethacin via amorphization using co-milling and supercritical co-precipitation processing. Powder Technol. 2013;240:79–87.
- Kürti L, Kukovecz Á, Kozma G, et al. Study of the parameters influencing the co-grinding process for the production of meloxicam nanoparticles. Powder Technol. 2011;212:210–217.
- Li J, Yang Y, Zhao M, et al. Improved oral bioavailability of probucol by dry media-milling. Mater Sci Eng C. 2017;78:780–786.
- Karashima M, Sano N, Yamamoto S, et al. Enhanced pulmonary absorption of poorly soluble itraconazole by micronized cocrystal dry powder formulations. Eur J Pharm Biopharm. 2017;115:65–72.
- Colombo G, Bortolotti F, Chiapponi V, et al. Nasal powders of thalidomide for local treatment of nose bleeding in persons affected by hereditary hemorrhagic telangiectasia. Int J Pharm. 2016;514:229–237.
- Scherliesz R, Mönckedieck M, Young K, et al. First in vivo evaluation of particulate nasal dry powder vaccine formulations containing ovalbumin in mice. Int J Pharm. 2015;479:408–415.
- Trows S, Scherliesz R. Carrier-based dry powder formulation for nasal delivery of vaccines utilizing BSA as model drug. Powder Technol. 2016;292:223–231.
- Parumasivam T, Chang RYK, Abdelghany S, et al. Dry powder inhalable formulations for anti-tubercular therapy. Adv Drug Deliv Rev. 2016;102:83–101.
- Mistry A, Stolnik S, Illum L. Nanoparticles for direct nose-to-brain delivery of drugs. Int J Pharm. 2009;379:146–157.
- Warnken ZN, Smyth HDC, Watts AB, et al. Formulation and device design to increase nose to brain drug delivery. J Drug Deliv Sci Technol. 2016;35:213–222.
- Horvát S, Fehér A, Wolburg H, et al. Sodium hyaluronate as a mucoadhesive component in nasal formulation enhances delivery of molecules to brain tissue. Eur J Pharm Biopharm. 2009;72:252–259.
- Tanaka A, Furubayashi T, Tomisaki M, et al. Nasal drug absorption from powder formulations: the effect of three types of hydroxypropyl cellulose (HPC). Eur J Pharm Sci. 2017;96:284–289.
- Gavini E, Hegge AB, Rassu G, et al. Nasal administration of Carbamazepine using chitosan microspheres: in vitro/in vivo studies. Int J Pharm. 2006;307:9–15.
- Callens C, Ceulemans J, Ludwig A, et al. Rheological study on mucoadhesivity of some nasal powder formulations. Eur J Pharm Biopharm. 2003;55:323–328.
- Kublik H, Vidgren M. Nasal delivery systems and their effect on deposition and absorption. Adv Drug Deliv Rev. 1998;29:157–177.
- Bartos C, Ambrus R, Sipos P, et al. Study of sodium hyaluronate-based intranasal formulations containing micro- or nanosized meloxicam particles. Int J Pharm. 2015;491:198–207.
- Brough C, Miller DA, Keen J, et al. Use of polyvinyl alcohol as a solubility-enhancing polymer for poorly water soluble drug delivery. Part 1. AAPS PharmSciTech. 2016;17:167–179.
- Kürti L, Gáspár R, Márki Á, et al. In vitro and in vivo characterization of meloxicam nanoparticles designed for nasal administration. Eur J Pharm Sci. 2013;50:86–92.
- Hales D, Vlase L, Porav SA, et al. A quality by design (QbD) study on enoxaparin sodium loaded polymeric microspheres for colon-specific delivery. Eur J Pharm Sci. 2017;100:249–261.
- Karimi K, Pallagi E, Szabo-Revesz P, et al. Development of a microparticle-based dry powder inhalation formulation of ciprofloxacin hydrochloride applying the quality by design approach. DDDT. 2016;10:3331–3343.
- Pallagi E, Ambrus R, Szabó-Révész P, et al. Adaptation of the quality by design concept in early pharmaceutical development of an intranasal nanosized formulation. Int J Pharm. 2015;491:384–392.
- Riley BS, Li X. Quality by design and process analytical technology for sterile products—where are we now? AAPS PharmSciTech. 2011;12:114–118.
- Gavan A, Porfire A, Marina C, et al. Formulation and pharmaceutical development of quetiapine fumarate sustained release matrix tablets using a QbD approach. Acta Pharm. 2017;67:53–70.
- Porfire A, Muntean DM, Rus L, et al. A quality by design approach for the development of lyophilized liposomes with simvastatin. Saudi Pharm J. 2017;25(7):981–992.
- Iurian S, Turdean L, Tomuta I. Risk assessment and experimental design in the development of a prolonged release drug delivery system with paliperidone. DDDT. 2017;11:733–746.
- Iurian S, Tomuta I, Bogdan C, et al. Defining the design space for freeze-dried orodispersible tablets with meloxicam. Drug Dev Ind Pharm. 2016;42:1977–1989.
- Casian T, Iurian S, Bogdan C, et al. QbD for pediatric oral lyophilisates development: risk assessment followed by screening and optimization. Drug Dev Ind Pharm. 2017;43(12):1932–1944.
- Gieszinger P, Csóka I, Pallagi E, et al. Preliminary study of nanonized lamotrigine containing products for nasal powder formulation. DDDT. 2017;11:2453–2466.
- Garg N, Sharma G, Singh B, et al. Quality by Design (QbD)-enabled development of aceclofenac loaded-nano structured lipid carriers (NLCs): an improved dermatokinetic profile for inflammatory disorder(s). Int J Pharm. 2017;517:413–431.
- Pallagi E, Paál T, Csóka I. Presentation of the Quality by Design concept and its application possibilities in the pharmaceutical technological development of nano-systems. Gyógyszerészet. 2015;59:387–395.
- Bastogne T. Quality-by-design of nanopharmaceuticals – a state of the art. Nanomed Nanotechnol. 2017;13:2151–2157.