
ABSTRACT
Cactus pear (Opuntia ficus-indica (L.) Mill.) can survive extreme environmental condition and is known for its fodder potential in many parts of the world. The morphological diversity of 15 introduced accessions was evaluated at Jhansi, Uttar Pradesh, India. The plants were established in 2013. Survival and nutrient status were evaluated after two years. Above-ground plant height, biomass, primary and secondary cladode numbers, primary and secondary cladode lengths and below-ground root length, weight, and surface area measurements were done six years after cladode planting. Yellow San Cono, White Roccapalumba, and Seedless Roccapalumba survived 100%. The discriminant traits according to principal component analysis were: primary cladodes plant−1 (component loading, 0.87), primary cladodes biomass (0.95), secondary cladodes plant−1 (0.83), canopy width (0.84), and plant biomass (0.92). Hierarchical cluster analysis grouped 15 accessions into two main clusters based on 17 morphological traits. Cluster I showed favorable values for many above- and below-ground morphological traits while Cluster II showed higher performance for root system width, height, and biomass, and primary and secondary cladode numbers. The results indicate that cactus pear accessions have considerable morphological variability and genetic diversity suitable for promotion as alternative fodder resources in semi-arid regions of India.
Introduction
Cactus pear (Opuntia ficus-indica) is a drought-tolerant cactus and exhibits crassulacean acid metabolism (CAM). Cactus pear is mainly grown in arid and semi-arid regions of the world with less than 250 and 250–450 mm annual precipitation (Stintzing and Carle Citation2005; Prasad et al. Citation2021). With considerable genetic variability, cactus pear grows in Italy, Spain, Mexico, Brazil, Chile, Argentina, and California (Inglese et al. Citation2002; Louhaichi et al. Citation2018). The genus Opuntia consists of two subgenera: Platyopuntia (cactus pear) characterized by flattened pads (cladodes) and used for animal and human consumption. Cylindropuntia (cholla cactus) has cylindrical pads and is generally used for ornamental purposes. Most cactus pear plant biomass is pad material rather than fruits. Therefore, cactus pear is widely used as animal feed in arid and semi-arid tropical regions, especially during droughts. Consumption of the water-rich cactus pads reduces animal drinking water requirements (Tegegne et al. Citation2007).
The genus Opuntia has special morphological, physiological, and biochemical attributes that enable these plants to grow under adverse climate conditions. The taxonomic classification of Opuntia has been reported as complex, mainly due to limited information about its morphological descriptors (Samah et al. Citation2016). However, Opuntia shows high morphological variation within species, which is influenced by many factors such as geographical distribution, population size, and pollen and seed dispersal (Rayamajhi and Sharma Citation2018). This provides scope for morphological descriptors as an effective tool for identification and classification of genotypes in Opuntia.
The CAM photosystem helps cactus pear survive in hot (arid) and semi-hot (semi-arid) areas of the world. Han and Felker (Citation1997) reported that cactus pear has a greater water-to-biomass conversion ratio than C3 and C4 plants, which helps produce more biomass in hot regions (Felker et al. Citation2005; Inglese et al. Citation2017). High atmospheric temperature is not a limiting factor for cactus pear growth (Nobel et al. Citation1986) but temperatures below −5°C can impair growth or kill plants (Inglese et al. Citation1995). Cactus pear can thrive in areas with average annual rainfall of 400–600 mm and in regions with 200 mm (Acevedo et al. Citation1983). However, supplemental irrigation during summer and unfavorable climatic conditions (e.g. dry spells during monsoon periods) is highly advantageous for better biomass yield (Bakali Citation2013).
Cactus pear can produce 1 kg of dry matter (DM) per 162 kg of water. This is a physiological advantage allowing it to thrive in hot areas (Han and Felker Citation1997). Guevara et al. (Citation2011) found that the conversion efficiency of water to biomass was five times that of C3 and three times that of C4 plants. The water content varies with the age of the cladodes. Generally, younger cladodes have more water than mature and older cladodes (90.8%, 89.1%, and 83.4% respectively; Flores et al. Citation1995). Similarly, nutrient content (nitrogen, phosphorus, potassium, manganese, zinc, and sodium) also decreases with age, except for magnesium (Lopez et al. Citation1988). Cactus pear can survive with rainfall that is too low to benefit other fodder crops (Snyman Citation2013). In semi-arid regions, the mean biomass yield of cactus pear ranged from 10–20 t ha–1 (Santos et al. Citation2000; Dubeux et al. Citation2006; Gebretsadik et al. Citation2013). Dev et al. (Citation2018) reported that the greatest green plant biomass was 1,007 g plant–1 (25% shade) and 1,086 g plant–1 (50% shade) two years after establishment. Similarly, Pareek et al. (Citation2003) reported green biomass of 268 to 1,300 g plant–1 in 51 cactus pear accessions in hot arid regions of India.
There are few studies on the performance of cactus pear accessions in semi-arid regions of India. Therefore, to make more efficient use of the cactus germplasm available in the country, it would be beneficial to study the genetic diversity, the above- and below-ground morphological variability in germplasm accessions and determine the relationships among the traits that contribute to this variability. There is also a need to understand the genetic relationships among cactus pear accessions and the contribution of different above- and below-ground traits to multivariate polymorphism. We therefore conducted a study to assess the performance of different accessions to i) identify the morphological attributes of cactus pear grown in a semi-arid environment in India and ii), to use above- and below-ground morphological variability and their relationships among different accessions to investigate the genetic diversity and performance of cactus pear.
Materials and methods
Experimental site description
The cactus pear accessions we examined were established at the Central Research Farm of ICAR Indian Grassland and Fodder Research Institute, Jhansi, India. A total of 15 accessions were received from the University of Palermo, Italy in April 2013 (Algerian, Blue Motto, Morado, Red Roccapalumba, Red San Cono, Roly Poly, Seedless Roccapalumba, Trunzara Red Bronte, White Roccapalumba, White San Cono, White Santa Margherita, Yellow Roccapalumba, Yellow San Cono, Yellow Santa Margherita Belice, and Zastron).
Five cladodes of each accession were obtained through the ICARDA India office, New Delhi and subjected to quarantine at the national facility at ICAR National Bureau of Plant Genetic Resources, New Delhi. The introduced cladodes from ICARDA were multiplied in a nursery. Cladodes collected from the nursery were planted for this experiment in April 2013. The plot size of individual accessions was 13 m × 6 m and with an interplant spacing of 1 m and 2 m between rows (5,000 plants ha−1). Three rows of cladodes were planted with 39 plants in each block. Cactus pear cladodes were planted after antifungal treatment with Bavistin 50% WP (2 g L–1). At the time of planting, 3–5 kg plant–1 of well-composted farmyard manure was applied (4.0 g N, 1.16 g P and 3.1 g K kg–1). Newly planted cladodes were irrigated twice during the summer of the first year and survived without further irrigation. Weeds were managed using both mechanical and chemical methods. A targeted spray of glyphosate (0.8 kg a.i. ha–1) was done before the rainy season of each year to control early-season weeds. The matured cladodes (2-years old) were harvested to remove crowded and dense stands. Approximately 60% of the cladodes per plant were removed in a single harvest.
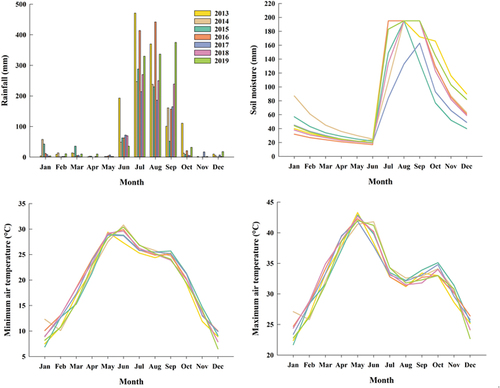
The site soil type was clay loam soil, containing 47.86% sand, 20% silt, and 32.14% clay at 0 to 15cm soil depth. The pH and organic carbon content of the soil were 7.26 and 0.69%, respectively. The long-term (1969–2018) yearly average rainfall in the study location was 950 mm. The maximum yearly average rainfall was recorded in 2013 (1,286 mm) and the minimum in 2017 (690 mm, ). The yearly average maximum and minimum temperatures were 32.95°C and 19.08°C. At this location, the soil moisture was generally high (107–168 mm) from July to November due to the annual monsoon rains ().
Figure 1. Weather parameters during 2013–2019 at Jhansi (UP), India.
Survival rate of cactus pear accessions
The survival percentage of accessions was recorded two years after planting. The survival rate was measured by dividing the number of live plants by the total number of plants and expressed as a percentage.
Nutrient status
The proximate nutrient values were estimated by collecting cladodes from 2-year-old accessions. From each accession, mature cladodes (three plants and three cladodes plant–1) were chopped into small pieces and oven-dried at 63°C for 72 hours or until the weight was constant. Oven-dried cladodes were ground using a plant sample grinder. One sample per accession (1 g) was used to estimate crude protein (CP; AOAC Citation2007) and cell wall constituents NDF (neutral detergent fiber), ADF (acid detergent fiber), and lignin contents (Van Soest et al. Citation1991). In vitro dry matter digestibility (IVDMD) was determined using the standard method of Tilley and Terry (Citation1963). In this case, 0.5 g of dry sample was incubated in 50 mL of digestion solution containing 40 mL of CO2 saturated phosphate carbonate buffer and 10 mL of strained sheep-rumen liquor.
Above- and below-ground growth analysis
Observations on above- and below-ground growth parameters were recorded in 2019 after six years of growth. Above-ground parameters were recorded from three randomly selected plants per plot (plant height and width, number of primary and secondary cladodes per plant, primary and secondary cladode length and width, and biomass of primary and secondary cladodes, Kumar et al. Citation2021). Plant height was measured from the bottom of the plant to the uppermost cladode. Width was measured by selecting the maximum swath width (middle of the plant). Primary and secondary cladode length and width were measured vertically and horizontally in three randomly selected cladodes per plant. The average fresh weight of three random cactus pear plants was considered as a biomass yield plant−1. Root system depth, width, and weight were manually recorded using three randomly selected plants plot–1. For extracting the whole root system of a cactus pear plant, a circular pit was made around the plant and the pit was filled with water for 24 hours (1.5–2.0 m diameter). The saturated soil was removed carefully from around the plant and the roots removed. The thoroughly washed root system was used for further analysis. The entire root system length and width were measured using a ruler, and then the secondary and finer roots were separated from the primary root system for analysis of root length, surface area, and volume using a Biovis PSM root scanner (Expert Vision Lab Pvt. Ltd., Dadar West, Mumbai, India). Observations on primary and secondary roots were recorded using a digital Vernier caliper. The root surface area and volume measured using the Biovis PSM root system and the Vernier caliper were added together to represent the total root surface area and volume.
Data handling and statistical analysis
Analysis of variance (ANOVA) was performed for above- and below-ground morphological traits using the PROC GLIMMIX procedure in SAS (v9.3, SAS Institute Citation2011). A randomized complete block design was used in this experiment. All the experimental units were replicated three times. Normality within the residuals was performed by PROC UNIVARIATE and residual plots in SAS using the Shapiro-Wilk test and visually confirmed with a normal probability plot. Data on above- and below-ground parameters were normally distributed, thus, data transformation was not required. However, data after two years of establishment were not normally distributed (survival, cladode length, cladode width, moisture content, yield, dry matter, NDF, ADF, cellulose, lignin, ash, CP, and IVDMD), therefore a square root transformation (√X + 0.5) was done to fulfill the assumptions of ANOVA. In all ANOVAs, accession was a fixed effect and replication and year were random effects. The post-hoc test was performed using the least significant difference test described by Fisher (α = 0.05). Pearson’s correlation was performed using PROC CORR to determine the relationship between biomass and morphological traits. Combined principal component analysis (PCA) was applied to 17 above-ground and below-ground morphological traits using the factoextra package (Kassambara and Mundt Citation2017) in R (v3.6.1, R Core Team Citation2019). For grouping based on the 17 morphological traits, a hierarchical cluster analysis (HCA) was performed using the Ward.D2 package in R. We used the k-1 cut off to keep the clusters at a constant height. Figures in the manuscript were made using Sigmaplot (v14, Sigmaplot Citation1996).
Results and discussion
Survival and growth performance of cactus pear accessions
The survival and growth performance are shown in . The survival rates of all accessions ranged from 30 to 100%. The Yellow San Cono, White Roccapalumba, and Seedless Roccapalumba had a 100% survival rate. The range in mean yield was 15.3 to 48 kg plant–1 year–1. The highest was for Yellow San Cono (48 kg plant–1 year–1) and the lowest for Roly Poly (15.3 kg plant–1 year–1; ). This indicates a relationship between accession survival rate and biomass yield. Cladode lengths and widths also varied among accessions. The greatest length (34.5 cm) and width (15.5 cm) were for Roly Poly and Yellow Santa Margherita Belice, respectively. Overall, Yellow San Cono can survive better in a semi-arid region compared to the other accessions.
Table 1. Survival and growth performance of cactus pear novel accessions following two years of growth.
Nutritional profile of cactus pear accessions
Plant sample analysis data at two years after establishment are presented in . Nutritional profile data confirmed that the major constituent of cactus pear plants was water (93.1–97.1%, ). The DM range was 2.9 to 6.9%. Misra et al. (Citation2018) reported an average DM of 7.56% in feeding trials in India. The low percentage of DM indicates that cactus pear alone cannot meet the DM requirement for animals (eg. 4% of animal body weight). Therefore, mixing it with other fodder would be an effective option to support livestock nutrition needs. However, the low fiber fractions (NDF, ADF, cellulose, and lignin) of the plants (31.3 to 40.9%, 17.2 to 23.1%, 10.6 to 18.5%, and 3.7 to 5.5%, respectively) indicated that cactus pear is nutritive and digestible (Misra et al. Citation2018) and is also the reason for its higher crude protein level (CP, 9.0–13.8%). Our results are consistent with those of Gregory and Felker (Citation1992), who reported 4–12% CP content in eight contrasting cactus pear accessions. Similarly, Sirohi et al. (Citation1997) reported 9.2% mean CP content in cactus pear. Therefore, cactus pear would seem to be a suitable alternative fodder where soil moisture and rainfall are major constraints to the cultivation of other fodder crops.
Table 2. Nutritional profile of cactus pear novel accessions following two years of growth.
Above-ground morphological traits
The plant height, biomass, primary and secondary cladode numbers, and primary and secondary cladode lengths at six years after establishment are presented in and . Accessions differed in terms of above-ground morphological traits (p < 0.05). The range in plant height was 98 to 266 cm (). Accessions Red San Cono (266 cm) and Algerian (265 cm) had the greatest height (p < 0.0001), followed by White Roccapalumba (254.33 cm) and Morado (233 cm), with the lowest for Red Roccapalumba (98 cm) and White Santa Margherita (115.33 cm). The greater-height accessions can be useful as both fodder and a wind barrier. In contrast, Oelofse et al. (Citation2006) reported that Zastron was the highest (223 cm) and Algerian the lowest (173 cm) among 10 studied accessions in a study conducted in a sub-tropical region in South Africa. This may be due to the differences in climate and soil type of the two study regions. However, the reported plant height range in this study is within the range found by Oelofse et al. (Citation2006). Nieto-Garibay et al. (Citation2011) also noted that Opuntia tapona was taller when grown in the California Gulf region of Mexico than in the Pacific Ocean region because of less wind. Taller cactus pear accessions can be useful as fodder shrubs (higher yield), wind barriers, and live fences in semi-arid regions.
Table 3. Plant height, plant biomass, primary cladodes per plant, secondary cladodes per plant of cactus pear accessions.
Figure 2. Length of primary cladodes in accessions of cactus pear after six years.
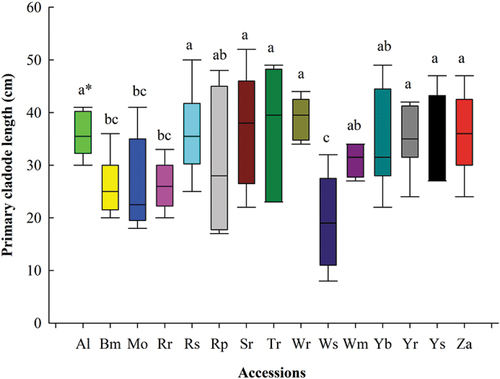
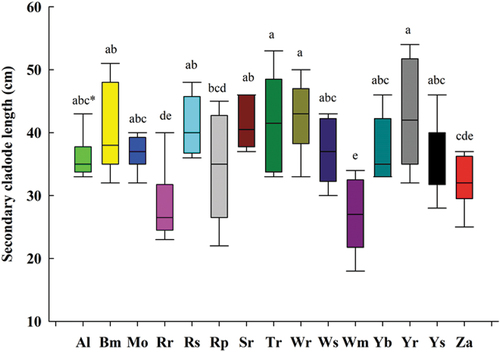
Figure 3. Length of secondary cladodes in accessions of cactus pear after six years.
The primary cladode numbers were greater (p < 0.05) for Yellow San Cono (18 plant–1), Red San Cono (15 plant–1), White Roccapalumba (15 plant–1), Seedless Roccapalumba (14 plant–1), Trunzara Red Bronte (14 plant–1), Morado (13 plant–1), and Yellow Rocca Palumba (13 plant–1) (). However, the trend was different for the secondary cladode number. The highest were Red San Cono (86 plant–1), Yellow San Cono (66 plant–1), Yellow Santa Margherita Belice (61 plant–1), and White Roccapalumba (52 plant–1). The trend change could be due to the individual difference in genetic potential rather than location and management. This agrees with the results of Lima et al. (Citation2016), who documented the average numbers of primary cladodes in the range of 8 to 20 plant–1 in a semi-arid region of Brazil. The number of primary cladodes was affected by year (i.e. weather variables) and cutting interval (Lima et al. Citation2016). Similarly, Kumar et al. (Citation2017) and Hassan et al. (Citation2020) reported that the average number of cactus pear primary cladodes was 3 to 16 (Italian origin) at 24 months after planting in Italy and 0.6 to 5.0 (Mexico origin), 1.0 to 6.2 (Chile origin), 2.2 (Brazil origin), 2.0 to 6.0 (Argentina origin), and 5.6 (Algeria origin), at 16 months after planting in India. Greater numbers of cladodes per plant increase photosynthetic activity (carbon dioxide capture) and productivity (Nobel Citation2001). Therefore, accessions with more cladodes and plant height can yield higher biomass than those with fewer cladodes ().
In this study, primary and secondary cladode lengths were in the range of 19.33 to 39.00 and 10.66–19.17 cm respectively (). The maximum lengths (p = 0.0015) of primary cladodes were for White Roccapalumba (39.00 cm), Trunzara Red Bronte (37.00 cm), Seedless Roccapalumba (37.00 cm), Yellow San Cono (36.33 cm), Red San Cono (36.16 cm), Zastron (36.00 cm), and Algerian (35.83 cm). Similarly, accessions Yellow Roccapalumba (42.83 cm), White Roccapalumba (42.50 cm), and Trunzara Red Bronte (41.67 cm) had the maximum lengths of secondary cladodes (p < 0.0001).
Cladode length is also an indicator of high water-use efficiency, photosynthetic activity, and biomass production. Accessions with higher cladode length and width produced higher biomass yield per unit area. Therefore, cladode length could be a potential morphological indicator for selection of accessions in semi-arid regions. The data on primary (p = 0.02) and secondary (p = 0.001) cladode width were significant. The range of primary and secondary cladode widths were 10.00 to 23.33 cm and 10.00 to 18.66 cm respectively. The highest primary and secondary cladode width were recorded for Yellow San Cono (23.33 cm) and Yellow Roccapalumba (18.66 cm; ).
Plant biomass ranged from 3.83 to 118.66 kg plant–1 (), with the highest (p = 0.02) for Red San Cono (118.66 kg plant–1), followed by Yellow Santa Margherita Belice (91.33 kg plant–1), Seedless Roccapalumba (88 kg plant–1), White Roccapalumba (65.33 kg plant–1), Trunzara Red Bronte (62 kg plant–1), and Yellow San Cono (56.33 kg plant–1). The biomass yield per plant was significantly correlated with primary cladode number (p < 0.0001; r = 0.853), primary cladode length (r = 0.619), primary cladode width (r = 0.650), primary cladode biomass (r = 0.971), secondary cladode number (r = 0.923), secondary cladode length (r = 0.470), secondary cladode width (r = 0.830), secondary cladode biomass (r = 0.992), plant height (r = 0.815), and canopy width (r = 0.810; ). Selecting a cultivar with superior above-ground morphological traits would appear to be an appropriate way to increase biomass yield in this semi-arid region.
Table 4. Root characteristics of cactus pear accessions.
Table 5. Pearson correlation coefficients among 17 above-ground and below-ground traits of cactus pear accessions.
Below-ground morphological traits
Below-ground morphological traits are presented in . Root system length, weight, and surface area did not differ significantly among accessions and were in the range of 22.22–63.66 cm, 0.46–2.61 kg, and 226–1,047 cm2 respectively. Soil moisture, air, temperature, and texture, the interaction of microorganisms, and plant nutrients influence the root length, weight, and surface area of a plant (Koç and Acar Citation2015). In this study, all these factors were constant for all the genotypes which may help explain the lack of differences among genotypes.
However, root system width (p = 0.03) and volume (p < 0.005) significantly differed among accessions. The maximum root system width was for Seedless Roccapalumba (152.33 cm) followed by Red San Cono (121.66 cm), White Santa Margherita (118.33 cm), and Zastron (105.50 cm). Root system volume was higher for Yellow Santa Margherita Belice (10,337 cm3) and Red San Cono (7,874 cm3) than for other accessions. The width and depth of cactus pear root systems will expand with time after establishment. Snyman (Citation2006) reported that the roots of the cactus pear can grow to depths of 5–10 cm and 20 cm laterally from the stem two years after establishment. Snyman (Citation2005) reported that cactus pear can grow only 0–5 cm deep within one year of establishment. In this study, a maximum root system depth of 63 cm and width of 152 cm were observed six years after establishment. However, earlier studies reported that cactus pear plants are generally shallow rooted (15 cm deep; Snyman Citation2005). Possible reasons for the greater root system depth, width, and volume in this study could be due to soil type, rainfall, and nutrient availability. Growers can select accessions with maximum root system length, width, and volume for better water and nutrient uptake, water-use efficiency, and yield in semi-arid regions (Felker et al. Citation1997).
Relationships among above-ground and below-ground traits
In this study, the relationships among above- and below-ground traits were compared for all combinations of traits. The highest correlation coefficients were for plant biomass with above-ground traits such as the number of primary cladodes per plant (r = 0.853), primary cladode biomass (r = 0.971), secondary cladodes per plant (r = 0.923), secondary cladode width (r = 0.830), secondary cladode biomass (r = 0.992), plant height (r = 0.815), and canopy width (r = 0.810; ). These results indicate positive relationships between plant biomass and its contributing above-ground biomass traits.
In a similar study, Neder et al. (Citation2013) and Alves et al. (Citation2016) also reported significant positive associations of cladode number and width with green matter yield. However, above-ground traits such as primary cladode width and canopy width were negatively correlated with both below-ground traits (i.e. root system biomass and root width) but positively correlated with root system diameter and root surface area. Additionally, a positive correlation was observed between above-ground traits and plant biomass. The combination of traits with r > 0.70 indicates a beneficial association (Skinner et al. Citation1999). In the present study, there were 31 trait combinations with r > 0.70 (). These traits can be considered for development of an ideal plant accession targeting biomass yield.
Regarding below-ground traits, positive associations among all trait combinations were observed, whereas root traits had the weakest relationships with plant biomass. The below-ground traits of root system volume and length had significant positive correlations with root system biomass. The other root traits (e.g. root system surface area r = 0.95 and volume r = 0.74) had positive correlations with root system length (P < 0.05). Therefore, these traits can be considered for the selection of genotypes that are adaptable to dry conditions (Snyman Citation2007). These associations between above- and below-ground traits suggest that traits such as the number of primary cladodes per plant, primary cladode biomass, number of secondary cladodes per plant, secondary cladode biomass, plant height, and plant biomass may be considered for developing accessions with high biomass.
Morphological variability for above- and below-ground traits in cactus pear accessions
Hierarchical cluster analysis (HCA)
The HCA based on 17 morphological traits resulted in two main clusters for the 15 cactus pear accessions. Cluster II was the largest and with 12 accessions, while Cluster I had three accessions (). Cluster I consisted of accessions Red San Cono, Yellow Roccapalumba, and Yellow Santa Margherita Belice. Cluster II consisted of accessions Algerian, Blue Motto, Morado, Red Roccapalumba, Roly Poly, Seedless Roccapalumba, Trunzara Red Bronte, White Roccapalumba, White San Cono, Yellow San Cono, and Zastron. The HCA grouped the 15 accessions independently of their geographical origin. Bendhifi et al. (Citation2013) reported similar results in their study on genetic diversity of 28 cactus pear ecotypes using morphological traits. The accessions under Cluster I represented greater CP content (>10%), lower fiber content (i.e. NDF, ADF, lignin and cellulose), high plant height, biomass and root volume. All the traits in Cluster I could be useful for higher fodder production.
Figure 4. Ward’s clustering dendrogram of 15 cactus pear accessions based on 17 above-ground and below-ground traits.
Principal component analysis
A principal component analysis (PCA) was performed to check the relationship between above- and below-ground traits and the results are presented in . The biplot indicates that dimension 1 (PC1), PC2, PC3 and PC4 accounted for 49.70%, 16.00%, 9.60% and 6.40% of the total variance. PC3 and PC4 accounted for negligible variation. In the biplot (), the strength of the different variables is indicated with arrows and illustrate distance from the origin. Above-ground traits such as primary cladode per plant (no.) (MCPP), primary cladode length (MCL), primary cladode width (MCW), primary cladode biomass (MCB), secondary cladode per plant (no.) (SCPP), secondary cladode length (SCL), secondary cladode width (SCW), secondary cladode biomass (SCB), plant height (PH), canopy width (CW), and plant biomass (PB) were highly related to the accessions Yellow Santa Margherita Belice, Algerian, Red San Cono and White Roccapalumba. All these traits are closely associated.
Figure 5. PCA plots of 15 cactus pear accessions (MCPP, primary cladode per plant (no.); MCL, primary cladode length; MCW, primary cladode width; MCB, primary cladode biomass; SCPP, secondary cladode per plant (no.); SCL, secondary cladode length; SCW, secondary cladode width; SCB, secondary cladode biomass; PH, plant height; CW, canopy width; PB, plant biomass; RB, root biomass; RD, root diameter; RW, root width; RV, root volume; RSA, root surface area; RL, root length).
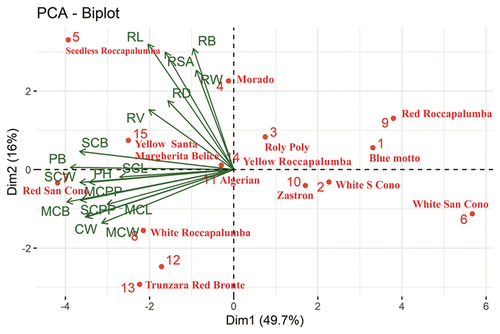
Below-ground traits like root biomass (RB), root diameter (RD), root width (RW), root volume (RV), root surface area (RSA), and root length (RL) were closely associated with Seedless Roccpalumba, Morado and Yellow Santa Margherita Belice. The PC1 loadings showed that above-ground traits were important for explaining morphological variability in the accessions (number of primary cladodes per plant: 0.90, primary cladode biomass: 0.90, secondary cladodes per plant: 0.82, secondary cladode width: 0.93, secondary cladode biomass: 0.92, plant height: 0.81, canopy width: 0.80, and plant biomass: 0.90; ). Gallegos-Vázquez et al. (Citation2012), reported that cladode length had a potential role in distinguishing 21 accessions from Mexico. Alves et al. (Citation2016) also noted cladode fresh weight as a useful trait in explaining multivariate polymorphism in Opuntia and Nopalea species. It is of interest to observe the separation of accessions based on primary cladode length, primary cladode width, number of secondary cladodes per plant, and canopy width (). Loadings for primary cladode biomass and the number of secondary cladodes per plant were positive for the first four PCs, indicating they play a role in variation in the accessions. The below-ground trait root width (0.70) contributed to the highest variation for PC4, which accounted for 6.43% of the total variation (). PC2 and PC3 showed that the traits root system surface area, length, and biomass made no contribution to variation in cactus accessions. The information on genetic variability will help to identify genetically diverse accessions within species for a range of useful traits (root depth, root volume, plant height, cladode number, biomass, and nutrient composition).
Table 6. Eigenvalues, component loading, and percent variation explained by the first four PC components (PC1-PC4) in cactus accessions.
Conclusion
This study identified the most promising cactus pear accessions for fodder production in water-scarce and dry weather conditions of India. The results showed that the new cactus pear accessions introduced had potential morphological variability and genetic diversity, indicating their adaptation ability to the extreme weather conditions of India, based on principal component analysis and hierarchical cluster analysis of morphological traits. The observed above-ground morphological traits, except secondary cladode length, showed medium to very high (0.619–0.992) positive, statistically significant (P < 0.05) correlations with plant biomass yield, but weaker (0.129–0.507) statistically insignificant correlations were found between below- ground traits and plant biomass. Hierarchical cluster analysis showed that Cluster I represented greater CP content (>10%), lower fiber content (i.e. NDF, ADF, lignin and cellulose), high plant height, biomass and root volume, thus all the traits in Cluster I could be useful for higher fodder production. The principal component analysis results further showed that the observed separation of accessions based on primary cladode length, primary cladode width, number of secondary cladodes per plant, and canopy width could be of interest for selecting suitable accessions for cultivation. According to the coefficient of variation, traits such as cladode length, cladode width, moisture content, dry matter, neutral detergent fibre, acid detergent fibre, cellulose, lignin, ash, and crude protein classified as traits with the least variation (CV <10%), survival (%), yield and in vitro dry matter digestibility as traits with medium variation (CV 10–20%), primary cladode width and secondary cladode width as traits with high variation (CV 20–30%) and plant height, plant biomass, primary cladode numbers, secondary cladode numbers, root weight, root volume, root surface, root length and root width as traits with very high variation (CV >30%).
Disclosure statement
The authors do not have any conflicts of interest regarding this manuscript
Additional information
Funding
References
- Acevedo E, Badilla I, Nobel PS. 1983. Water relations, diurnal acidity changes, and productivity of a cultivated cactus, Opuntia ficus-indica. Plant Physiol. 72(3):775–780. doi:10.1104/pp.72.3.775.
- Alves FAL, de Andrade AP, Bruno RDLA, Dos Santos DC, Pereira VLA. 2016. Study of the genetic variability, correlation and importance of phenotypic characteristics in cactus pear (Opuntia and Nopalea). Afr J Agric Res. 11:2849–2859. doi:10.5897/AJAR2016.11011.
- AOAC. 2007. Association of Official Analytical Chemists. Official methods of analysis of AOAC international. 18th ed. Washington DC (USA).
- Bakali A. 2013. Impact of irrigation frequencies on the installation and the production of two forms of Opuntia ficus-indica. Acta Horti. 995(995):145–156. doi:10.17660/ActaHortic.2013.995.18.
- Bendhifi M, Baraket G, Zourgui L, Souid S, Salhi-Hannachi A. 2013. Assessment of genetic diversity of tunisian barbary fig (Opuntia ficus indica) cultivars by RAPD markers and morphological traits. Sci Horti. (158):1–7.
- Dev R, Singh JP, Singh T, Dayal D. 2018. Effect of shade levels on growth, and biomass production of cactus (Opuntia ficus-indica (L.) Mill.). Int J Curr Microbiol Appl Sci. 7:3145–3153.
- Dubeux JCB Jr, Dos Santos Jcb F, Andrade Lirab MV, Dos Santos Mde C, Lima DLE, Ferreira RLC, Ferreira RLC. 2006. Productivity of Opuntia ficus-indica (L.) Miller under different N and P fertilization and plant population in north-east Brazil. J Arid Environ. 67(3):357–372. doi:10.1016/j.jaridenv.2006.02.015.
- Felker P, de C RS, Casoliba R, Filippini P, Medina D, Zapata R. 2005. Comparison of Opuntia ficus-indica varieties of Mexican and Argentine origin for fruit yield and quality in Argentina. J Arid Environ. 60(3):405–422. doi:10.1016/j.jaridenv.2004.06.003.
- Felker P, Singh GB, Parcek OP. 1997. Opportunities for development of cactus (Opuntia spp.) in arid- and semi-arid regions. Ann Arid Zone. 36:267–278.
- Flores HA, Murillo SM, Borrego EF, and Rodríguez OJL. 1995. Variación de la composición química en estratos de la planta de 20 variedades de nopal. In: Pimienta-Barrios E, Neri-Luna C, Muñoz-Urías A, and Huerta FM, editors. Memorias del 6o Congreso Nacional y 4o Internacional sobre et Conocimiento y Aprovechamiento del Nopal. Jalisco: México 110–115. https://www.redalyc.org/pdf/4555/455545052014.pdf
- Gallegos-Vázquez C, Scheinvar L, Núñez-Colín CA, Mondragón-Jacobo C. 2012. Morphological diversity of xoconostles (Opuntia spp.) or acidic cactus pears: a Mexican contribution to functional foods. Fruits. 67(2):109–120. doi:10.1051/fruits/2012001.
- Gebretsadik G, Animut G, Tegegne F. 2013. Assessment of the potential of cactus pear (Opuntia ficus indica) as livestock feed in Northern Ethiopia. Livest Res Rural Dev. 25:1–10.
- Gregory RA, Felker P. 1992. Crude protein and phosphorus contents of eight contrasting Opuntia forage clones. J Arid Environ. 22(4):323–331. doi:10.1016/S0140-1963(18)30574-3.
- Guevara JC, Felker P, Balzarini MG, Páez SA, Estevez OR, Paez MN, Antúnez JC. 2011. Productivity, cold hardiness and forage quality of spineless progeny of the Opuntia ficus-indica 1281 x O. Lindhei merii 1250 cross in Mendoza plain, Argentina. J Prof Ass Cactus Dev. 13:48–62.
- Han H, Felker P. 1997. Field validation of water-use efficiency of the CAM plantOpuntia ellisianain south Texas. J Arid Environ. 36(1):133–148. doi:10.1006/jare.1996.0202.
- Hassan S, Liguori G, Inglese P, Louhaichi M, Sortino G. 2020. The effect of soil volume availability on Opuntia ficus-indica canopy and root growth. Agron. 10(5):635. doi:10.3390/agronomy10050635.
- Inglese P, Barbera G, La Mantia T. 1995. Research strategies for the improvement of cactuspear (Opuntia ficus-indica) fruit quality and production. J Arid Environ. 29(4):455–468. doi:10.1016/S0140-1963(95)80018-2.
- Inglese P, Basile F, Schirra M. 2002. Cactus pear fruit production. In: Nobel PS, editor. Cacti Biology and Uses. Berkeley (USA): University of California Press; p. 163–183.
- Inglese P, Mondragon C, Nefzaoui A, and Saenz C. 2017. Crop ecology, cultivation and uses of cactus pear, food and agriculture organization of the United Nations (FAO). Rome (Italy). https://www.fao.org/3/I7012EN/i7012en.pdf
- Kassambara A, Mundt F 2017. Factoextra: extract and visualize the results of multivariate data analyses. R package version 1.0.5. https://CRAN.R-project.org/package=factoextra.
- Koç N, Acar R 2015. The soil factors which effect on root growth in forage plants. In 2nd ICSAE 2015, International Conference on Sustainable Agriculture and Environment, September 302015 Oct 03, Konya, Turkey. Proceedings book, volume I & II (pp. 636–642). Selcuk University.
- Kumar S, Dayal D, Shamsudheen M, Machiwal D, Yadav OP. 2017. Cactus pear (Opuntia ficus-indica) in India. Jodhpur: ICAR-Central Arid Zone Research Institute.
- Kumar S, Louhaichi M, Dana Ram P, Tirumala KK, Ahmad S, Rai AK, Sarker A, Hassan S, Liguori G, Probir Kumar G, et al. 2021. Cactus pear (Opuntia ficus-indica) productivity, proximal composition and soil parameters as affected by planting time and agronomic management in a semi-arid region of India. Agron. 11(8):1647. doi:10.3390/agronomy11081647.
- Lima GFDC, Rego M, Teles M, Dantas FDG, Lobo RNB, Silva JGMD, Aguiar EMD. 2016. Morphological characteristics and forage productivity of irrigated cactus pear under different cutting intensities. Revista Caatinga. 29(2):481–488. doi:10.1590/1983-21252016v29n226rc.
- Lopez MJL, Cruz HP, López AJ. 1988. Contenidos nutrimentales de tallos y raíces de nopal tunero Opuntia amyclaea Tenore. Revista Chapingo. 62–63:143–148.
- Louhaichi M, Kumar S, Tiwari S, Islam M, Hassan S, Yadav OP, Dayal D, Moyo HP, Dev R, Sarker A. 2018. Adoption and utilization of cactus pear in South Asia—Smallholder farmers’ perceptions. Sustainability. 10(10):3625. doi:10.3390/su10103625.
- Misra AK, Kumar S, Kumar TK, Ahmed S, Palsaniya DR, Ghosh PK, Louhaichi M, Sarker A, Hassan S, Ates S. 2018. Nutrient intake and utilization in sheep fed opuntia [Opuntia ficus-indica (L.) Mill.] combined with conventional green and dry fodders. Range Manag Agrofor. 39:97–102.
- Neder DG, Costa FRD, Edvan RL, Souto Filho LT. 2013. Correlations and path analysis of morphological and yield traits of cactus pear accessions. Crop Breed Appl Biotechnol. 13(3):203–207. doi:10.1590/S1984-70332013000300009.
- Nieto-Garibay A, Troyo-Diéguez E, Valdez-Cepeda RD, Rueda-Puente E, García-Hernández JL, Flores-Hernández A, Zamora-Salgado S, Orona-Castillo I, Murillo-Amador B. 2011. Plant height and mineral content of Opuntia tapona growing along the coasts of Baja California Sur, México. J Prof Ass Cactus Dev. 13:77–87.
- Nobel PS. 2001. Biologia Ambiental. In Agroecologia, Cultivo e Usos da Palma forrageira (Eds. Barbera G, Inglesa P, Pimienta-Barrios E). Roma: FAO/Sebrae-PB; p. 36–48.
- Nobel PS, Geller GN, Kee SC, Zimmerman AD. 1986. Temperatures and thermal tolerance for cacti exposed to high temperatures near the soil surface. Plant Cell Environ. 9:279–287.
- Oelofse RM, Labuschagne MT, Potgieter JP. 2006. Plant and fruit characteristics of cactus pear (Opuntia spp.) cultivars in South Africa. J Sci Food Agric. 86(12):1921–1925. doi:10.1002/jsfa.2564.
- Pareek OP, Singh RS, Vashishtha BB. 2003. Performance of cactus pear (Opuntia ficus-indica (L.) Mill.) clones in hot arid region of India. J Prof Ass Cactus Dev. 5:121–130.
- Prasad M, Chaudhary M, Ramakrishnan S, Singh HV, Kumar S, Ghosh PK. 2021. Impact of long term land use changes on carbon dynamics and soil quality in the semi arid bundelkhand region of India. Fresenius Environ Bull. 30:2536–2544.
- R Core Team. 2019. R: a language and environment for statistical computing. R foundation for statistical computing. Vienna: R Foundation for Statistical Computing. https://www.R-project.org.
- Rayamajhi N, Sharma J. 2018. Genetic diversity and structure of a rare endemic cactus and an assessment of its genetic relationship with a more common congener. Genetica. 146(3):329–340. doi:10.1007/s10709-018-0024-0.
- Samah S, Cvdt P, Cruz MAS, Valadez-Moctezuma E. 2016. Genetic diversity, genotype discrimination, and population structure of Mexican Opuntia sp., determined by SSR markers. Plant Mo Biol Rep. 34(1):146–159. doi:10.1007/s11105-015-0908-4.
- Santos DC, Lira Md A, Dias FM, Farias I, Santos MVF, Santos VF 2000. Produtividade de cultivares de palma forrageira (Opuntia e Nopalea). In: Proceedings of the 7th North eastern Ruminant Feeding Symposium. SNPA: Teresina, PI, Brazil,121–123.
- SAS Institute. 2011. SAS/STAT. version 8.02 for windows. Cary (NC, USA):SAS Institute, Inc.
- Sigmaplot. 1996. Sigma graphs, version 10. San Jose (California, USA):Systat Software, Inc.
- Sirohi SK, Karim SA, Misra AK. 1997. Nutrient intake and utilization in sheep fed with prickly pear cactus. J Arid Environ. 36(1):161–166. doi:10.1006/jare.1996.0184.
- Skinner DZ, Bauchan GR, Auricht G, Hughes S. 1999. A method for the efficient management and utilization of large germplasm collections. Crop Sci. 39(4):1237–1242. doi:10.2135/cropsci1999.0011183X003900040046x.
- Snyman HA. 2005. A case study on in situ rooting profiles and water-use efficiency of Opuntia ficus-indica and O. robusta. J Prof Ass Cactus Dev. 7:1–21.
- Snyman HA. 2006. Root distribution with changes in distance and depth of two-year-old cactus pears Opuntia ficus-indica and O. robusta plants. South Afr J Bot. 72(3):434–441. doi:10.1016/j.sajb.2005.12.008.
- Snyman HA. 2007. Root studies on cactus pears Opuntia ficus-indica and O. robusta along a soil–water gradient. Haseltonia. 13:64–75. doi:10.2985/1070-0048(2007)13[64:RSOCPO]2.0.CO;2.
- Snyman HA. 2013. Growth rate and water-use efficiency of cactus pears Opuntia ficus-indica and O. robusta. Arid Land Res Manag. 27(4):337–348. doi:10.1080/15324982.2013.771232.
- Stintzing FC, Carle R. 2005. Cactus stems (Opuntia spp.): a review on their chemistry, technology, and uses. Mol Nutr Food Res. 49(2):175–194. doi:10.1002/mnfr.200400071.
- Tegegne F, Kijora C, Peters KJ. 2007. Study on the optimal level of cactus pear (Opuntia ficus‐indica) supplementation to sheep and its contribution as source of water. Small Ruminant Res. 72(2–3):157–164. doi:10.1016/j.smallrumres.2006.10.004.
- Tilley JMA, Terry RA. 1963. A two‐stage technique for the in vitro digestion of forage crops. Grass Forage Sci. 18(2):104–111. doi:10.1111/j.1365-2494.1963.tb00335.x.
- Van Soest PV, Robertson JB, Lewis BA. 1991. Methods for dietary fiber, neutral detergent fiber, and nonstarch polysaccharides in relation to animal nutrition. J Dairy Sci. 74(10):3583–3597. doi:10.3168/jds.S0022-0302(91)78551-2.