
ABSTRACT
This study was conducted to evaluate seasonal patterns of household food insecurity, dietary diversity, and household characteristics on wasting and stunting among children in households followed for 1 year in the drought-prone areas of Sidama, Ethiopia. A cohort study design was employed. Data were collected on the pre-harvest season (March and June) and post-harvest season (September and December) of 2017. We studied 935 children aged 6 to 47 months. At four seasons over a year, we had 3,449 observations from 897 households and 82% (2,816) (95% CI: 80.3–82.9) were food in-secured households. Severe food insecurity was higher in the pre-harvest (March; food scarcity season) which was 69% as compared to 50% of September (P < .001). From 3,312 observations, 43% (1,408) (95% CI: 40.8-44.2) of children were stunted. Stunting showed seasonal variations with 36% (95% CI: 32.5-39.0) in March and 48% (95% CI: 45.0-51.8) in December. Six percent (95% CI: 4.8-6.3) of children were wasted, with higher prevalence in March (8%) as compared to 3% of September (P < .001). Moreover, household characteristics such as poverty level, education, occupation and the household food insecurity and dietary diversity were associated with subsequent wasting or stunting.
Introduction
Globally, about 800 million people are food unsecured and 2 billion people experience micronutrient deficiencies (Pérez-Escamilla Citation2017). Food insecurity is a public health problem, especially in the African Sahel and in the lowlands in Ethiopia which has often been affected by drought and famines (Graves et al. Citation2019; Lindtjørn Citation1990; Regassa and Stoecker Citation2012). Food insecurity emerges as a predictor of child wasting and stunting. Although governments and international organizations developed nutrition policies and use interventional programs to reduce the burden of malnutrition (Tumilowicz et al. Citation2018), one possible reason why they did not achieve the target was that previous interventions did not sufficiently address the local contexts (Tumilowicz et al. Citation2018).
Although Ethiopia remains among the 20 poorest countries in the world (UNDP Citation2019), there has during the last 20 years been a rapid economic growth with increased per capita gross domestic product (GDP) with reductions in rates of poverty and stunting (Golan et al. Citation2019). According to four consecutive demographic and health surveys, the prevalence of stunting was 52% in 2000 (CSA Citation2001), 47% in 2005 (CSA Citation2006), 44% in 2011 (CSA Citation2012), and 38% in 2016 (CSA Citation2016). This shows that stunting has fallen by 2.5% per year. However, stunting still remains high, especially in rural areas and among the poorest (Golan et al. Citation2019). The prevalence of wasting has remained fairly constant and high at about 10% from 2000 to 2016, according to several Ethiopian Demographic Health Surveys (CSA Citation2001, Citation2006, Citation2012, Citation2016)
There are multiple risk factors of stunting according to the WHO conceptual framework (Beal et al. Citation2018). Previously conducted cross-sectional studies in Ethiopia revealed that there are numerous factors responsible for child wasting and stunting. These can broadly be classified into basic factors like child characteristics (Woldeamanuel and Tesfaye Citation2019), parental characteristics (Kahssay et al. Citation2020), and household characteristics (Woldeamanuel and Tesfaye Citation2019). Moreover, underlying factors like food insecurity (Mulu and Mengistie Citation2017) and sanitation (Girma et al. Citation2019; Kahssay et al. Citation2020; Woldeamanuel and Tesfaye Citation2019) and immediate factors such as inadequate dietary intake (Girma et al. Citation2019) and infections (Mulu and Mengistie Citation2017; Woldeamanuel and Tesfaye Citation2019) were associated with child wasting and stunting. However, there is a lack of information about risk factors of child wasting and stunting evaluated through cohort study in drought-prone areas of Sidama.
Ethiopia is committed to reducing child malnutrition by improving food availability, access, and consumption of nutritious food (Governement of the Federal Democratic Republic of Ethiopia Citation2016a), and adopted the “Seqota Declaration of 2015” with its ambitious goal of ending child malnutrition by the year 2030 (Governement of the Federal Democratic Republic of Ethiopia Citation2016b).
Malnutrition rates are highly sensitive to agricultural practice (Ruel and Alderman Citation2013) which is the main economic source of income for rural Ethiopian communities (Dadi Citation2013). Ethiopian farmers practice subsistence farming, which depends on rainfall (Abreha Citation2007), and in such communities, inadequate rain often leads to food shortages. If severe, such shortages lead to famines (Dadi Citation2013).
Boricha in Sidama in southern Ethiopia, where this study was conducted, has repeatedly been affected by famines. It is an area with high population growth (Tesfaye Citation2011), a chronically food-insecure area, and a large part of the population are supported by the Productive Safety Net Program (PSNP) (Tesfaye Citation2011). An earlier study from Boricha has shown that about 80% of households were food in-secured (Regassa and Stoecker Citation2012), and in 2017, about 12,100 households received such support (Boricha Woreda Agricultural Office Report Citation2017). Even in years with good rains, many households do not produce enough food for the whole year (Tesfaye Citation2011)
Most of the earlier studies conducted in Ethiopia were cross-sectional, and thus do not tell about the time relationship between food security, food availability and diversity, and the subsequent development of acute and chronic malnutrition. Some studies show that there are differences in wasting prevalence rates between the dry and wet seasons (Kinyoki et al. Citation2016) and between post-harvest and pre-harvest seasons (Roba et al. Citation2016). Earlier research from Sidama, where the current study was done showed seasonal wasting where nutrient-poor enset (Ensete ventricosum) is the major staple crop (Abebe et al. Citation2006; Bosha et al. Citation2019; Ferro-Luzzi et al. Citation2001). These studies were from the more fertile area of Sidama than the current study which was carried out in a drought-prone population, and also showed that children and adults both suffered from exposure to seasonal energy stress. Changes in weight-for-height Z-score were greater in individuals of low socioeconomic status (Branca et al. Citation1993).
Ethiopia requires effective community-based nutrition interventions with a multi-disciplinary approach to curb childhood malnutrition (Egata, Berhane, and Worku Citation2013). Implementation of community nutrition programs may require improved understanding of the local context and seasonality between the food diversity, rainfall pattern, occurrence of food security, wasting and stunting. Moreover, determining risk factors of child-undernutrition through cohort study would give stronger evidence about childhood wasting and stunting. Such information is not only important for policymakers at the national and regional levels but also for the practitioners of local public health and nutrition in the communities.
To our knowledge, few studies have evaluated the time relationship between exposure variables such as household characteristics, food insecurity, food diversity, on outcomes such as wasting (acute malnutrition) and stunting (chronic malnutrition) in different seasons of the year in Ethiopia. Such an understanding is important for public health and nutrition when implementing community-based nutrition interventions. Hence, the aim of this paper is to evaluate seasonal patterns of household food insecurity, dietary diversity, and household characteristics on wasting and stunting among children in households followed for 1 year in the drought-prone areas of Sidama, Ethiopia.
Methods and materials
Study design, period, and setting
We used a cohort study design to conduct a community-based follow-up study. We visited each selected household repeatedly over the course of 1 year to assess the risks of child wasting and stunting in different seasons.
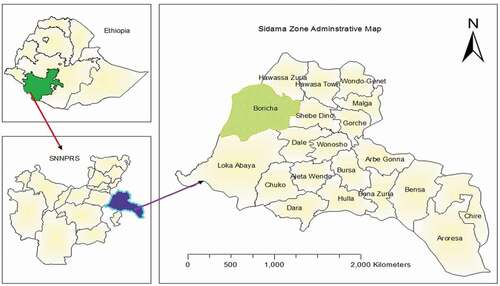
Boricha is located in the Sidama Zone in the Southern Nation Nationalities and the Regional State of Ethiopia. It covers about 588 square km, and it is about 330 km from the capital city of Ethiopia. Located at 6º 46ʹN and 38º 04ʹE to 7º 01ʹN and 38º 24ʹE, its altitude is 1200–1800 mm above sea level. Most of its 315,000 people, 14% of whom are children aged 6–59 months, belong to the Sidama ethnic group and speak Sidamu Afoo. Most (95%) of the population live in rural areas, and most (95%) are subsistence farmers, though a few (4.5%) are merchants. The average family has five members, and the population density is 409 persons per square kilometer (Tesfaye Citation2011).
Boricha’s subsistence agriculture system comprises mostly small, rain-fed farms that produce maize, enset (Enset ventricosum), potatoes, haricot beans, sweet potatoes, and teff. Some farmers grow cash crops like coffee, chat, spices, and eucalyptus. Livestock provide transport, milk, meat, and eggs, which are important income sources, though yield is typically low.
High population growth, absence of adequate surface water for irrigation, inaccessibility of underground water, decreasing soil fertility, low rainfalls, land degradation, and deforestation are important contributors to food insecurity in the area (Tesfaye Citation2011). shows a map of the Boricha district.
Figure 1. Boricha district map, Sidama, Southern Ethiopia, Ethiopia, 2017.
The rainy seasons in Sidama are biannual, and the Belg rains which last from March to Maycontribute to most of the crop production. The Keremt rains usually last from June to September and are smaller (Dadi Citation2013). Thus, following the agricultural cycle, the season of plenty usually occurs after the Belg harvest (mid-June to August) and Keremt harvest (October to November).
Outcome and exposure variables
We used the WHO conceptual framework (Beal et al. Citation2018) and analyzed our cohort study data using possible exposures of child malnutrition such as household characteristics, food access, food utilization, and seasonal variations of food security on our main outcome variables stunting and wasting.
The main outcomes of the study were the prevalence of stunting and wasting among children aged less than 5 years. The main exposure variables were season, wealth, household food insecurity access, household dietary diversity, child morbidity in the past 2 weeks, mother’s marital status, family size, maternal age, maternal education, maternal occupation, child sex, child age in month, paternal education, paternal occupation, child’s place of birth order, and if the child had been exclusively breastfed. Parental occupation was registered as the main economic activity of mothers and fathers, and could be housewife, daily laborer, government worker, farmer or merchant. In rural areas, for example, a father who works as a daily laborer could have farmland. A merchant husband usually has agriculture in addition to his business and his land size could even be large than that of an ordinary farmer. This may indirectly inform about different income-generating activities in addition to agricultural production. Even government workers have agricultural land in the rural part of Ethiopia. Therefore, we believe that occupation is an indicator of main income-generating activities of the household.
Study population and sampling
A two-stage sampling technique was employed. First, nine rural kebeles were randomly selected from the 39 rural kebeles (smallest administrative unit) in Boricha. Secondly, a cluster sampling technique was used to choose households from each sub-kebele’s (“gouts”) of the selected kebeles. Households with mothers who had children aged 6–47 months were included. The final sample included 897 households with 935 children, and all eligible children were included in our study. Respondents at interviews were biological mothers unless they had died or were divorced.
The sample size was calculated using OpenEpi 303 software (Dean, Sullivan, and Soe Citation2013). The sample size was estimated based on the following assumption: 95% level of confidence, 80% power, proportion of wasting in the lowland region of Ethiopia at the post-harvest season 12.6%, proportion of wasting in the lowland region of Ethiopia at the pre-harvest season 6.6% (Roba et al. Citation2016)., and 15% non-response rate yielding a total of 872. However, we collected data from a total of 935 children. provides a detailed description of the study population.
Figure 2. Study profile of children, Boricha district, Sidama, South Ethiopia, March through December 2017.
Data collection procedures
Pretested and structured questionnaires were used to gather information about the household conditions, child health and nutrition characteristics, household dietary diversity, and household food security.
The data collectors had completed grades 10, 11, or 12, and were fluent speakers of the local Sidamu Afoo language and were familiar with the local area. The 18 data collectors and three supervisors were trained outside of the selected kebeles to conduct pretests using a structured questionnaire. Data collectors were assigned in pairs to maintain the quality of data collection. The questionnaire was prepared in English and then translated to Sidamu Afoo by the principal investigator (MB) and scrutinized by an experienced translator.
We used four season categories for data collection, based on the area’s agricultural cycle: Tsedey (September, October, and November), Bega (December, January, and February), Belg (March, April, and May), and Keremt (June, July, and August). Data were collected in 2017 at the end of each seasonal month and beginning of each new season; that is, in December, March, June, and September. The questionnaires were checked for completeness, and households with incomplete questionnaires were re-visited, and all mistakes were corrected.
Child morbidity
Childhood diarrhea was defined as the passage of loose or liquid stools more frequently (three or more times per day) within 2 weeks period preceding to survey (WHO Citation2005). Fever was defined as an abnormally high body temperature assessed by asking mothers “Does the child’s body feel hot” and cough was assessed by asking mothers “Did the child have cough in the 2 weeks„ preceding survey period (WHO Citation2005). The alternative response for the occurrence of diarrhea, fever, and cough was categorized as “Yes” or “No”. Thus, child morbidity was the occurrence of diarrhea or cough or a fever in the 2 weeks preceding the data collection.
Food insecurity
Food security status was assessed using nine occurrence items and nine frequency questions of the Household Food Insecurity Access Scale (HFIAS), validated for Ethiopia, including measurements at different seasons (Coates, Swindale, and Bilinsky Citation2007; Hagos et al. Citation2015; Kabalo et al. Citation2019). The nine occurrence items were as follows: 1. worry about food, 2. unable to eat preferred food, 3. eat just a few kinds of food, 4. eat foods they really did not want to eat, 5. eat a smaller meal, 6. eat fewer meals in a day, 7. no food of any kind in the household, 8. go to sleep hungry, and 9. go a whole day and night without eating. The three major domains included anxiety and uncertainty about household food, insufficient quality, and insufficient food intake (Coates, Swindale, and Bilinsky Citation2007). The nine frequency follow-up questions measured the occurrence of the event in the previous 4 weeks. Food insecurity was classified as secure, mild, moderate, and severe, based on the HFIAS indicator guide version 3 (Coates, Swindale, and Bilinsky Citation2007). A food-secure household did not experience any or only rare food insecurity conditions, whereas severely food-insecure households often experienced insufficient food intake (Coates, Swindale, and Bilinsky Citation2007). Detailed information about the food insecurity classification is available in the HFIAS indicator guide (Coates, Swindale, and Bilinsky Citation2007).
Dietary diversity
Household Dietary Diversity Score of 24 hours recall measurements was utilized to measure household dietary diversity. A household dietary diversity used the past 24 hours recall for 12 food-groups and include cereals, roots or tubers, vegetables, fruits, meat or poultry, eggs, fish and seafood, pulses or legumes or nuts, milk and milk products, oil or fats, sugar or honey, and miscellaneous (Swindale and Bilinsky Citation2006).
Wealth index
Principal component analysis was used to construct the wealth index using household assets (Rutstein and Staveteig Citation2014). From the 28 initial variables, 11 were included in the analysis. Variables with 95% and above similar responses were dropped. Included were variables such as type and number of livestock (cow/oxen, chickens, goat, sheep, and horses); ownership of improved sanitation (latrine) facility; type of cooking fuel; housing condition (main construction of house wall, floor, and roof); number of sleeping rooms; ownership of chair; and ownership of a working mobile telephone. The principal component analysis revealed a Kaiser-Meyer-Olkin sampling adequacy of 0.67 and a significance level below 0.001. Finally, of the 11 components, four exceeded an initial eigenvalue of 1. Household wealth status was ranked based on percentile groups into five groups that had approximately the same number of cases: poorest, poor, medium, rich, and richest (Rutstein and Staveteig Citation2014).
Anthropometric measurements
Measurements were evaluated on children’s weight, height, recorded age, and mid-upper arm circumference, using Emergency Nutrition Assessment for Standardized Monitoring and Assessment of Relief and Transitions software version 2011 (Erhardt, Golden, and Seaman Citation2011). Repeated evaluations were conducted until the coefficient of reliability reached 90% during the pretest. For children less than 24 months of age, height was measured in a recumbent position, using a length board, to the nearest 0.1 cm. Children older than 2 years were measured in the standing position to the nearest 0.1 cm. Weight was measured with light clothes and recorded to the nearest 100 g using a digital SECA scale (SECA GmbH, Germany). Child age was assessed using mothers’ recall and using memorable events to aid in the recall.
Wasting and stunting were calculated based on the 2006 WHO Multi-center Growth Reference study cutoff values. Children whose weight-for-height Z (WHZ) scores were lower than −2 were classified as wasted, and children whose height-for-age Z (HAZ) scores were lower than −2 were categorized as stunted (WHO Citation2006).
Data analysis
Data were double entered using EpiData version 3.1 (Christiansen and Lauritsen Citation2010) and exported for further analysis to STATA version 15 (StataCorp, Texas, USA). The anthropometric data were analyzed using the WHO Anthro version 3.2.2 (World Health Organization, Geneva, Switzerland).
The natural sequence of data presentation was done following the World Health Organization conceptual framework for childhood stunting (Beal et al. Citation2018). Thus, first, we analyzed the correlation between continuous background variables such as wealth, age of mother, education level on intermediary variables such as household food insecurity and household dietary diversity. After that, we analyzed how both the background variables and household food insecurity and household dietary diversity were associated with subsequent measures of wasting and stunting. For this, we both used correlation and multivariate analysis.
To analyze data collected over a period of 1 year on the same households, we used longitudinal, binary outcome, mixed-effect logistic regression statistical analysis to analyze wasting and stunting. Thus, the anthropometric measurement in one season was controlled for in the subsequent season. Household level was included to Kebele level (smallest administrative unit) hierarchy due to the presence of more than one child in one household for wasting and stunting outcome analyses. The model construction used Kebele level and household level for random effect equations and exchangeable variance-covariance structure of specifications for random effects. Time setting of the model used season as time variable and child code as a panel ID variable. Robust standard-error estimator and the main effect of independent variables were used. The model reports P-value, test statistics, fixed effects coefficients as odds ratio, and confidence interval with 95% confidence.
Bivariate analysis for all important independent variables was conducted, and associations with P-value less than 0.20 were considered for multivariate analysis to control for confounding. We have used Pearson’s chi-squared test to compare categorical data. Maternal age, maternal education, and maternal occupation variables were considered for multivariate analysis of wasting and child age was considered for multivariate analysis of stunting even if P-value is greater than 0.20. The final model intra-class correlation coefficient for wasting was 7% at Kebele level and 32% at the household level. The final model intra-class correlation coefficient for stunting was 13% at the kebele level and 89% at the household level. We have utilized Akaike information criterion to compare models and we found the final models of wasting and stunting had smaller Akaike information criterion (AIC) that indicates for a better-fitting model. However, this model does not account for our few time-varying covariates as if this model has no clearly identified way of managing time-varying covariates.
Ethical consideration
The institutional review board at Hawassa University, College of Medicine and Health Sciences (Ref. No: IRB/001/09, Date: 13/09/2016) and the Regional Committee for Medical and Health Research Ethics, Western Norway (ref: 2016/1631/REK Vest) approved this research proposal. Written permission was obtained from the Sidama Zone health department, Woreda administrators and selected health institutions. Informed written consent was obtained from all participating mothers or caregivers before interview. Mothers who were unable to sign used their thumb prints.
Results
Baseline characteristics
The study included 935 children (505 boys and 427 girls) from 897 households. More than 99% (892 of 897) of respondents were the biological mothers of the children. Among the households, 92% (809 of 897) of household heads were men. The family size ranged from 3 to 12 members, with a mean of 5. The age of mothers ranged from 18 to 46, with a mean age of 28 years. About 50% (448 of 897) of mothers were illiterate, and 98% (872of 897) were married. Most (83%; 727 households) were Protestant Christians, and 98% (876 of 897) of mothers belonged to the Sidama ethnic group. Most (87%; 773) mothers were housewives who also worked on their farms. More than half of husbands (561; 63%) were farmers, and 37% (332 of 897) were illiterate. lists detailed background information.
Table 1. Baseline information about socioeconomic characteristics in Boricha district of Southern Ethiopia; March 2017
The following analysis is based on correlation analysis of different variables (correlation matrix).
Households characteristics at baseline and subsequent HFI and FD
indicates that poverty at baseline was associated with household food insecurity at all seasons. Similarly, mothers with low education had increased household food insecurity at all seasons. Richer households also had increased food diversity. Larger family size and also increasing maternal age were associated with higher household food insecurity and lower food diversity.
Table 2. Correlation matrix of continuous variables to assess an association between baseline characteristics, household food insecurity, household dietary diversity, wasting, and stunting in four different seasons
We also found that household characteristics such as wealth status, child age, and maternal age were associated with stunting and wasting: Both lower education of the mother at the baseline and increasing child age were associated with increasing stunting at most of the seasons. Household food insecurity at the baseline was associated with increasing rates of wasting at all seasons. Similarly, food diversity at the baseline was also associated at most of the seasons for increasing stunting measurements. It also demonstrated that household food insecurity was associated with stunting and food diversity and further with wasting.
Thus, as described above, our univariate correlation analyses indicate that household characteristics were associated with household food insecurity and dietary diversity, and household food insecurity and dietary diversity were associated with wasting and stunting of the children.
Household food insecurity
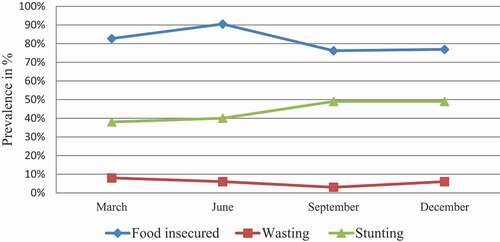
From 3,449 observations, 82% (2,816) reported being food insecure (95% CI: 80.3–82.9). Household food insecurity showed seasonal variations: the number of severely food-insecure households was higher in March (69%, 608 of 881) than in September (50%, 433 of 861) and December (38%, 320 of 835). Similarly, the number of severely food-insecure households was higher in June (76%, 666 of 871) than in September (50%, 433 of 861) and December (38%, 320 of 835). These findings indicate that the post-harvest seasons (September and December) were better than the food-scarce, pre-harvest seasons (March and June). Seasonal variation was observed for food insecurity, acute malnutrition (wasting), and chronic malnutrition (stunting). Acute malnutrition (wasting) decreased as the household food insecurity decreased. The prevalence of stunting increased one season later than the increase in household food insecurity prevalence. See for information.
Figure 3. Seasonal variation trend line of food insecurity, wasting, and stunting among children under age five years, Boricha, South Ethiopia, 2017.
Household dietary diversity
The mean household dietary diversity score was 5 food groups per day. The household’s consumption of food groups showed seasonal variations: the number of households who had lowest food diversity (≤3) was higher in March (32%, 285 of 879) than in September (22%, 185 of 854) and December (6%, 48 of 830). These findings indicate that the pre-harvest season (season of scarcity) of March had the least diet diversity as compared to post-harvest seasons (September and December). See the table for the overall dietary diversity across three seasons ().
Table 3. The overall seasonal pattern of household food consumption, Boricha, Southern Ethiopia, 2017
Regarding responses to household dietary diversity items (), the highest consumed food group was condiments that accounted for 2,493 (97%) followed by food groups such as of cereals which was 2,330 (90%). The least consumed food group was fish and eggs, and they accounted for 3%. In general, animal source foods such as meat, eggs, and fish were less frequently consumed.
Figure 4. Frequency of utilizing twelve food groups in the past 24 hours, Boricha, South Ethiopia, 2017. Bar with 95% confidence level.
Evaluation of seasonal pattern for the food groups shows that, except for roots or tubers and fish, there was a significant variation across the different seasons. The pre-harvest season of March had significantly lower use of foods such as cereals, vegetables, fruits, meat or poultry, eggs, sugar compared to post-harvest season of September. Similarly, the pre-harvest season of March had a significantly lower proportion of consumption to most of the dietary diversity food group as compared to the post-harvest season of December. The consumption of animal source foods (meat, egg, and fish) contributed less than 5% for household dietary diversity across the different seasons. The overall association of each food group across different seasons is listed in .
Table 4. Seasonal patterns in household dietary diversity (HDDS) items, Boricha, Southern Ethiopia, 2017
Wasting
From 3,438 observations in Boricha, about 6% (191 of 3,438 children; 95% CI: 4.8-6.3) of children were wasted. The wasting prevalence was highest among children aged less than 1 year, which was about 12% (17 out of 136 children). Wasting prevalence was 5% (35 out of 713) among children aged between 12 and 23 months, 5% (43 out of 826) children aged between 24 and 35 months, and 5% (89 out of 1,659) children aged greater than 36 months.
The prevalence of wasting increased in the pre-harvest season: As shown in , the prevalence of wasting showed seasonal variations: 8% (70 of 880 persons) in March 2017 (95% CI: 6.2-9.7) and 3% (26) in September 2017 (95% CI: 2.0-4.4).
Figure 5. Seasonal variation of wasting among children under age five in Boricha, South Ethiopia, 2017. Bar with 95% confidence level.
Bivariate risk analysis showed that the risk of child wasting was highest among households with less educated fathers, among food-insecure households, among households with child sickness in the past 2 weeks, and in March.
Multivariate risk assessment showed that the risk of child wasting increased among households with less educated fathers, food-insecure households, and in March. See for more information.
Table 5. Multivariate risk factor of wasting under the age of 5 years in nine Kebele, Boricha, Southern Ethiopia, 2017
Stunting
From 3,312 observations, about 43% (1,408 of 3,312) of children were stunted (95% CI: 40.8–44.2). Stunting prevalence increased with age, with higher prevalence among children older than 36 months of age. Stunting prevalence was 25% (35 out of 139) among children aged less than 12 months, 43% (316 out of 723) children aged between 12 and 23 months, 40% (328 out of 827) children aged between 24 and 35 months, and 45% (729 out of 1,623) children aged 36 months and older.
Stunting occurred some months after the period with the highest prevalence of food insecurity and showed significant seasonal variations: 36% (303 of 848 persons) in March (95% CI: 32.5–39.0) and 48% (396 of 818 persons) in December (95% CI: 45.0–51.8), as shown in .
Figure 6. Seasonal variation in stunting among children under age five, Boricha, South Ethiopia, 2017. Bar with 95% confidence level.
Bivariate analysis showed that the risk of child stunting was highest among poor households and among households with parents who did not have formal education, parents who had other occupations (e.g., daily laborer, maid), household dietary diversity, and non-exclusively breastfed children. The risk peaked in December.
Multivariate analysis showed an increased risk of child stunting in December 2017, as well as among poor households, among households that had less educated mothers, and whose parents had other occupations. See for detailed information.
Table 6. Multivariate risk factor for stunting among children younger than 5 years in nine kebele in Boricha, Southern Ethiopia, 2017
Discussion
Our cohort study demonstrates that some of the possible underlying causes of child wasting and stunting were lack of food access, low food utilization, and marked seasonal variations of food security. Household food insecurity and prevalence of wasting increased in the pre-harvest season, with the highest prevalence of wasting occurring in the same season as the highest prevalence of food insecurity. However, stunting occurred some months after the period with the highest prevalence of food insecurity. This took place in an area of ecological degradation, high population pressure, and repeated droughts. As background information, we demonstrate that basic household factors such as poverty and education were associated with both stunting and wasting.
The prevalence rates of wasting were similar to consecutive Ethiopian Demographic Health Surveys (CSA Citation2016, Citation2012, Citation2001, Citation2006). The highest prevalence of stunting was recorded during the post-harvest period, similar to the 45% to 51% prevalence rates described for a drought-prone area in the Rift Valley in Central Ethiopia (Gari et al. Citation2018) and the 51% rate recorded in the Ethiopian Demographic Health Survey 2005 (CSA Citation2006). Previous studies show that rates of childhood stunting have decreased in Ethiopia, primarily among the more wealthy segments of the population (Golan et al. Citation2019; Wirth et al. Citation2017). The possible reason for the constant trend of wasting and stunting in Ethiopia could be due to persistent low socio-economic status of the country (UNDP Citation2019) and inequalities between rural and urban (Tranvåg, Ali, and Norheim Citation2013)
Regarding household food insecurity, more than two thirds of households had manifested food insecurity in all seasons. Similarly, cross-sectional studies conducted in Boricha in 2012 (Regassa and Stoecker Citation2012) and elsewhere in South Ethiopia (Asesefa Kisi et al. Citation2018; Betebo et al. Citation2017; Hagos et al. Citation2015) had high prevalence rates of food insecurity. Moreover, our finding was higher than the national survey (35% of household food insecurity) (Humphries et al. Citation2015). Thus, our study shows that there was no improvement in the household food security situation in this part of the country.
The intake of animal source food and fruits were low, and this is similar to findings from other developing countries (Bosha et al. Citation2019; Campbell et al. Citation2014; Hirvonen, Taffesse, and Worku Hassen Citation2016). However, we found a high intake of carbohydrate source foods which indicates the monotonous nature of the diet (). This indicates for most of the rural households are unable to afford the high price of animal source food (Hirvonen and Wolle Citation2019), and thus suggests inadequate micronutrient intake (Arimond et al. Citation2010).
Furthermore, our study confirmed the risk factors for stunting and wasting in Ethiopia found in other studies. For example, the risk of child stunting increased with decreasing the wealth status of households (Greffeuille et al. Citation2016). This finding suggests that reducing poverty with a pro-poor economic growth policy could reduce malnutrition. Stunting and wasting also were higher among parents who did not have formal education, and children of uneducated parents were at higher risk for malnutrition (Hasan et al. Citation2016; Makoka and Masibo Citation2015; Victora et al. Citation1986). Thus, education might improve child care and child feeding practices (Kalanda, Verhoeff, and Brabin Citation2006), which in turn improves child nutritional status (Saha et al. Citation2008). Hence, improving child nutritional status will require multi-sector approaches. Programs to improve child malnutrition among rural subsistence farming communities should integrate agricultural, educational, and health information. Practically at the local level, our study suggests that the district (Woreda) health office and health extension workers should identify households in need of food, advise them on ways to improve their food diversity and intake and if possible, and refer them to the Productive safety net program.
Strengths of the study
Our study area is typical in Ethiopia with recurrent droughts and food shortages. The population was representative of the area, as we randomly selected the kebeles and households. Furthermore, to assess the outcome variables, we conducted a cohort study using four repeated assessments of the same households in four different seasons over a year. The sample size was large and adequate, and the loss to follow-up was small. We also used a multilevel, mixed-effect model to account for both hierarchical effect of response correlation at the kebele level and household level, and longitudinal response of repeated measurements at individual level.
Limitations
The effect of seasonal variations on food insecurity, stunting, and wasting were significant when controlling for confounders. However, our study lasted for only 1 year. Thus, it would be advisable to conduct future studies over longer periods (Lindtjorn and Alemu Citation2002). Also, our study included only households from rural populations, and hence future studies could include urban households. Most risk factors were assessed from maternal recall, which may have introduced recall bias, although we used a short recall period to reduce such bias. As the study participants may have expected possible aid, they may incline toward affirmative responses of household food insecurity access scale measurement items. Household dietary diversity was not conducted on specific groups, and the consequences of seasonal variation may be higher in specific groups such as mothers or children.
Conclusions and recommendations
Our study suggests that household food insecurity increased the risk of child wasting during the period of highest food scarcity (pre-harvest season; table 8 and ). Similarly, the risk of low household food consumption increased in the period of the highest food insecurity. Moreover, household characteristics such as poverty level, education, occupation, and the household food insecurity and dietary diversity were associated with subsequent wasting or stunting. Thus, our study links poverty, household food insecurity, and household dietary diversity as indicators of agricultural production, with stunting or wasting in this drought-prone rural farming community. However, our data suggest that household food insecurity was a more pronounced predictor for stunting and wasting than household dietary diversity, as had been suggested by others (Ali et al. Citation2013). Our research findings could have implications for both designing and evaluating interventions to reduce the state of nutrition in the affected communities.
Possible future knowledge gaps and interventions could focus on increasing household wealth and agricultural production. Crop production capacity of the areas and weather variations from year to year could influence malnutrition, indicating a need to integrate studies on rainfall trends, agriculture, and health, as well as climate change in Ethiopia (Simane et al. Citation2016). Our study on seasonal changes on food insecurity and dietary diversity underscores increasing challenges in agricultural production in a drought-affected area in Ethiopia. These challenges will continue to erode nutrition security, as has been the case for decades, and it may undermine sustainable livelihood and development efforts in the area (Niang et al. Citation2014). One potential intervention in food security and diet diversity is to combine the need for improved seasonal forecasting and early warning systems for farmers. Programs working in improving child malnutrition among rural subsistence farming communities could integrate seasonal weather forecasting, health information, and improved education of all, but especially women (Persson, Rasmussen, and Yang Citation2019). Interventions should consider including high-quality diet such as animal source food and fruits (Hawkes et al. Citation2020). Moreover, interventions should promote diversity in food production and consumption among poor households living in drought-prone areas. Such an intervention could support decision-making among farmers to reduce societal vulnerabilities and enhance adaptation and resilience to the impacts of climate change (Vaughan and Dessai Citation2014).
Authorship
M.B., E.L., and B.L. designed the study. All authors participated in the data analysis, drafting of the manuscript, and writing the final article.
Acknowledgments
The authors thank the study subjects for their willingness to participate in our study. We are thankful to data collectors, supervisors, and the Boricha district authorities.
Disclosure statement
The authors declare that they have no competing interests.
References
- Abebe, Y., B. J. Stoecker, M. J. Hinds, and G. E. Gates. 2006. Nutritive value and sensory acceptability of corn- and kocho-based foods supplemented with legumes for infant feeding in Southern Ethiopia. African Journal of Food, Agriculture, Nutrition and Development 6 (1).
- Abreha, N. H. 2007. An economic analysis of farmers’ risk attitudes and farm households’ responses to rainfall risk in tigray Northern Ethiopia.Ph.D. Thesis, Wageningen University.
- Ali, D., K. K. Saha, P. H. Nguyen, M. T. Diressie, M. T. Ruel, P. Menon, and R. Rawat. 2013. Household food insecurity is associated with higher child undernutrition in Bangladesh, Ethiopia, and Vietnam, but the effect is not mediated by child dietary diversity. The Journal of Nutrition 143 (12):2015–21. doi:https://doi.org/10.3945/jn.113.175182.
- Arimond, M., D. Wiesmann, E. Becquey, A. Carriquiry, M. C. Daniels, M. Deitchler, N. Fanou-Fogny, M. L. Joseph, G. Kennedy, Y. Martin-Prevel, et al. 2010. Simple food group diversity indicators predict micronutrient adequacy of women’s diets in 5 diverse, resource-poor settings. The Journal of Nutrition 140 (11):2059S–69S. doi:https://doi.org/10.3945/jn.110.123414.
- Asesefa Kisi, M., D. Tamiru, M. S. Teshome, M. Tamiru, and G. T. Feyissa. 2018. Household food insecurity and coping strategies among pensioners in Jimma Town, South West Ethiopia. BMC Public Health 18 (1):1373. doi:https://doi.org/10.1186/s12889-018-6291-y.
- Beal, T., A. Tumilowicz, A. Sutrisna, D. Izwardy, and L. M. Neufeld. 2018. A review of child stunting determinants in Indonesia. Maternal & Child Nutrition 14 (4):e12617. doi:https://doi.org/10.1111/mcn.12617.
- Betebo, B., T. Ejajo, F. Alemseged, and D. Massa. 2017. Household food insecurity and its association with nutritional status of children 6–59 months of age in East Badawacho District, South Ethiopia. Journal of Environmental and Public Health 2017:6373595. doi:https://doi.org/10.1155/2017/6373595.
- Boricha Woreda Agricultural Office Report. 2017. Boricha, Sidama Zone, Ethiopia.
- Bosha, T., C. Lambert, S. Riedel, A. Melesse, and H. K. Biesalski. 2019. Dietary diversity and anthropometric status of mother-child pairs from enset (False Banana) staple areas: A panel evidence from Southern Ethiopia. International Journal of Environmental Research and Public Health 16:12. doi:https://doi.org/10.3390/ijerph16122170.
- Branca, F., G. Pastore, T. Demissie, and A. Ferro-Luzzi. 1993. The nutritional impact of seasonality in children and adults of rural Ethiopia. European Journal of Clinical Nutrition 47:840–50.
- Campbell, R. K., S. A. Talegawkar, P. Christian, S. C. LeClerq, S. K. Khatry, L. S. Wu, and K. P. West Jr. 2014. Seasonal dietary intakes and socioeconomic status among women in the Terai of Nepal. Journal of Health, Population, and Nutrition 32 (2):198–216.
- Christiansen, T. B., and J. M. Lauritsen (Ed.). 2010. EpiData - Comprehensive Data Management and Basic Statistical Analysis System. Odense Denmark, EpiData Association, 2010. http://www.epidata.dk
- Coates, J., A. Swindale, and P. Bilinsky. 2007. Household Food Insecurity Access Scale (HFIAS) for Measurement of Food Access: Indicator Guide, 20009–5721. Washington, D.C.: Food and Nutrition Technical Assistance Project, Academy for Educational Development.
- CSA. 2001. Ethiopian demographic health survey 2000. Addis Abeba and Calverton: Central Statistical Agency.
- CSA. 2006. Ethiopian demographic health survey 2005. Addis Abeba and Calverton: Central Statistical Agency.
- CSA. 2012. Ethiopia demographic and health survey 2011, 155–56. Ethiopia and Calverton Addis Ababa: Central Statistical Agency and ICF International.
- CSA. 2016. Ethiopia demographic and health survey report 2016. Addis Ababa, Ethiopia: Central Statistical Agency and ICF International.
- Dadi, D. K. 2013. Characterizing the predictability of seasonal climate in Ethiopia. Dissertation for the degree philosophiae doctor (PhD) in Meteorology, University of Bergen, Norway.
- Dean, A. G., K. M. Sullivan, and M. M. Soe. 06 April 2013. OpenEpi: Open source epidemiologic statistics for public health, Version. www.OpenEpi.com
- Derso, T., A. Tariku, G. A. Biks, and M. M. Wassie. 2017. Stunting, wasting and associated factors among children aged 6–24 months in Dabat health and demographic surveillance system site: A community based cross-sectional study in Ethiopia. BMC Pediatrics 17 (1):96. doi:https://doi.org/10.1186/s12887-017-0848-2.
- Egata, G., Y. Berhane, and A. Worku. 2013. Seasonal variation in the prevalence of acute undernutrition among children under five years of age in east rural Ethiopia: A longitudinal study. BMC Public Health 13:864. doi:https://doi.org/10.1186/1471-2458-13-864.
- Erhardt, J., M. Golden, and J. Seaman. 2011. Inventors Emergency nutrition assessment for SMART software 2011. Action Against Hunger. Toronto, Canada.
- Ferro-Luzzi, A., S. S. Morris, S. Taffesse, T. Demissie, and M. D’Amato. 2001. Seasonal undernutrition in Rural Ethiopia: Magnitude,correlates, and functional significance. Addis Ababa: International Food Policy Research Institute Washington, D.C. and Istituto Nazionale della Nutrizione, Rome in collaboration with Ethiopian Health and Nutrition Research Institute.
- Gari, T., E. Loha, W. Deressa, T. Solomon, and B. Lindtjorn. 2018. Malaria increased the risk of stunting and wasting among young children in Ethiopia: Results of a cohort study. PloS One 13 (1):e0190983. doi:https://doi.org/10.1371/journal.pone.0190983.
- Girma, A., H. Woldie, F. A. Mekonnen, K. A. Gonete, and M. Sisay. 2019. Undernutrition and associated factors among urban children aged 24–59 months in Northwest Ethiopia: A community based cross sectional study. BMC Pediatrics 19 (1):214. doi:https://doi.org/10.1186/s12887-019-1595-3.
- Golan, J., D. Heacdey, K. Hirvonen, and Hoddinot. 2019. The Oxford handbook of Ethiopian economy. In Changes in child undernutriton in Ethiopia, 2000–2016, ed. C. Cramer, A. Oqubay, and F. Cheru, 399–411. New York: Oxford University Press.
- Governement of the Federal Democratic Republic of Ethiopia. 2016a. National nutrition programme 2016–2020. Addis Ababa: Governement of the Federal Democratic Republic of Ethiopia (GFDRE).
- Governement of the Federal Democratic Republic of Ethiopia. 2016b. Seqota declaration implementation plan (2016–2030), summary programme approach DOCUMENT. Addis Ababa: Governement of the Federal Democratic Republic of Ethiopia (GFDRE).
- Graves, A., L. Rosa, A. M. Nouhou, F. Maina, and D. Adoum. 2019. Avert catastrophe now in Africa’s Sahel. Nature 575 (7782):282–86. doi:https://doi.org/10.1038/d41586-019-03445-z.
- Greffeuille, V., P. Sophonneary, A. Laillou, L. Gauthier, R. Hong, R. Hong, E. Poirot, M. Dijkhuizen, F. Wieringa, and J. Berger. 2016. Persistent inequalities in child undernutrition in Cambodia from 2000 until Today. Nutrients 8 (5):297. doi:https://doi.org/10.3390/nu8050297.
- Hagos, S. G., T. F. Lunde, M. Damen, T. Woldehanna, and B. Lindtjørn. 2015. Is the adapted Household Food Insecurity Access Scale (HFIAS) developed internationally to measure food insecurity valid in urban and rural households of Ethiopia? BMC Nutrition 1 (1):2. doi:https://doi.org/10.1186/2055-0928-1-2.
- Hasan, M. T., R. J. Soares Magalhaes, G. M. Williams, and A. A. Mamun. 2016. The role of maternal education in the 15-year trajectory of malnutrition in children under 5 years of age in Bangladesh. Maternal & Child Nutrition 12 (4):929–39. doi:https://doi.org/10.1111/mcn.12178.
- Hawkes, C., M. T. Ruel, L. Salm, B. Sinclair, and F. Branca. 2020. Double-duty actions: Seizing programme and policy opportunities to address malnutrition in all its forms. The Lancet 395 (10218):142–55. doi:https://doi.org/10.1016/S0140-6736(19)32506-1.
- Hirvonen, K., and A. Wolle. 2019. Consumption, production, market access and affordability of nutritious foods in the Oromia Region of Ethiopia. Addis Ababa, Ethiopia: Alive & Thrive and International Food Policy Research Institute.
- Hirvonen, K., A. S. Taffesse, and I. Worku Hassen. 2016. Seasonality and household diets in Ethiopia. Public Health Nutrition 19 (10):1723–30. doi:https://doi.org/10.1017/S1368980015003237.
- Humphries, D. L., K. A. Dearden, B. T. Crookston, L. C. Fernald, A. D. Stein, T. Woldehanna, M. E. Penny, and J. R. Behrman, Determinants Young Lives, and Team Consequences of Child Growth Project. 2015. Cross-sectional and longitudinal associations between household Food security and child anthropometry at ages 5 and 8 years in Ethiopia, India, Peru, and Vietnam. The Journal of Nutrition. 145 (8):1924–33. doi:https://doi.org/10.3945/jn.115.210229.
- Kabalo, B. Y., E. H. Gebreyesus, E. Loha, and B. Lindtjørn. 2019. Performance of an adapted household food insecurity access scale in measuring seasonality in household food insecurity in rural Ethiopia: A cohort analysis. BMC Nutrition 5 (54). doi:https://doi.org/10.1186/s40795-019-0323-6.
- Kahssay, M., E. Woldu, A. Gebre, and S. Reddy. 2020. Determinants of stunting among children aged 6 to 59 months in pastoral community, Afar region, North East Ethiopia: Unmatched case control study. BMC Nutrition 6 (1):9. doi:https://doi.org/10.1186/s40795-020-00332-z.
- Kalanda, B. F., F. H. Verhoeff, and B. J. Brabin. 2006. Breast and complementary feeding practices in relation to morbidity and growth in Malawian infants. European Journal of Clinical Nutrition 60 (3):401–07. doi:https://doi.org/10.1038/sj.ejcn.1602330.
- Kinyoki, D. K., J. A. Berkley, G. M. Moloney, E. O. Odundo, N. B. Kandala, and A. M. Noor. 2016. Space-time mapping of wasting among children under the age of five years in Somalia from 2007 to 2010. Spatial and Spatio-temporal Epidemiology 16:77–87. doi:https://doi.org/10.1016/j.sste.2015.12.002.
- Lindtjørn, B. 1990. Famine in southern Ethiopia 1985-6: Population structure, nutritional state, and incidence of death among children. BMJ 301 (6761):1123–27. doi:https://doi.org/10.1136/bmj.301.6761.1123.
- Lindtjorn, B., and T. Alemu. 2002. Year-to-year and seasonal variations in stunting among preschool children in Ethiopia. Journal of Health, Population, and Nutrition 20 (4):326–33.
- Makoka, D., and P. K. Masibo. 2015. Is there a threshold level of maternal education sufficient to reduce child undernutrition? Evidence from Malawi, Tanzania and Zimbabwe. BMC Pediatrics 15:96. doi:https://doi.org/10.1186/s12887-015-0406-8.
- Mulu, E., and B. Mengistie. 2017. Household food insecurity and its association with nutritional status of under five children in Sekela District, Western Ethiopia: A comparative cross-sectional study. BMC Nutrition 3:35. doi:https://doi.org/10.1186/s40795-017-0149-z.
- Niang, I., O. C. Ruppel, M. A. Abdrabo, A. Essel, C. Lennard, J. Padgham, and P. Urquhart. 2014. Africa. In Climate change 2014: Impacts, adaptation, and vulnerability. Part B: Regional aspects. Contribution of Working Group II to the fifth assessment report of the intergovernmental panel on climate change, ed. V. R. Barros, C. B. Field, D. J. Dokken, M. D. Mastrandrea, K. J. Mach, T. E. Bilir, M. Chatterjee, K. L. Ebi, Y. O. Estrada, R. C. Genova, et al., 1199–265. Cambridge: Cambridge University Press.
- Pérez-Escamilla, R. 2017. Food security and the 2015–2030 sustainable development goals: From human to planetary health: Perspectives and opinions. Current Developments in Nutrition 1 (7):e000513. doi:https://doi.org/10.3945/cdn.117.000513.
- Persson, L. A., K. M. Rasmussen, and H. Yang. 2019. Nutrition for women and children-Are we doing the right things in the right way? PLoS Medicine 16 (8):e1002906. doi:https://doi.org/10.1371/journal.pmed.1002906.
- Regassa, N., and B. J. Stoecker. 2012. Household food insecurity and hunger among households in Sidama district, southern Ethiopia. Public Health Nutrition 15 (7):1276–83. doi:https://doi.org/10.1017/s1368980011003119.
- Roba, K. T., T. P. O’Connor, T. Belachew, and N. M. O’Brien. 2016. Variations between post- and pre-harvest seasons in stunting, wasting, and Infant and Young Child Feeding (IYCF) practices among children 6–23 months of age in lowland and midland agro-ecological zones of rural Ethiopia. The Pan African Medical Journal 24:163. doi:https://doi.org/10.11604/pamj.2016.24.163.9387.
- Ruel, M. T., and H. Alderman, Maternal, and Group Child Nutrition Study. 2013. Nutrition-sensitive interventions and programmes: How can they help to accelerate progress in improving maternal and child nutrition? The Lancet. 382 (9891):536–51. doi:https://doi.org/10.1016/S0140-6736(13)60843-0.
- Rutstein, S., and S. Staveteig. February 2014. Making the demographic and health surveys wealth index comparable. DHS Methodological Reports No. 9. Rockville, Maryland, USA: ICF International.
- Saha, K. K., E. A. Frongillo, D. S. Alam, S. E. Arifeen, L. A. Persson, and K. M. Rasmussen. 2008. Appropriate infant feeding practices result in better growth of infants and young children in rural Bangladesh. The American Journal of Clinical Nutrition 87 (6):1852–59. doi:https://doi.org/10.1093/ajcn/87.6.1852.
- Simane, B., H. Beyene, W. Deressa, A. Kumie, K. Berhane, and J. Samet. 2016. Review of climate change and health in Ethiopia: Status and gap analysis. Ethiopian Journal of Health Development 30 (1 Spec Iss):28–41.
- Swindale, A., and P. Bilinsky. 2006. Household Dietary Diversity Score (HDDS) for measurement of household food access: Indicator guide (v.2).Washington, D.C.: FHI 360/FANTA. https://www.fantaproject.org/sites/default/files/resources/HDDS_v2_Sep06_0.pdf
- Tesfaye, B. 2011. Rural household food security situation anaylsis: The case of Boricha Wereda, Sidama Zone. A Thesis Presented to the School of Graduate studies of the Addis Ababa.
- Tranvåg, E. J., M. Ali, and O. F. Norheim. 2013. Health inequalities in Ethiopia: Modeling inequalities in length of life within and between population groups. International Journal for Equity in Health 12 (1):52. doi:https://doi.org/10.1186/1475-9276-12-52.
- Tumilowicz, A., M. T. Ruel, G. Pelto, D. Pelletier, E. C. Monterrosa, K. Lapping, K. Kraemer, L. M. De Regil, G. Bergeron, M. Arabi, et al. 2018. Implementation science in nutrition: Concepts and frameworks for an emerging field of science and practice. Current Developments in Nutrition 3 (3). doi: https://doi.org/10.1093/cdn/nzy080.
- UNDP. 2019. Human development report 2019. http://hdr.undp.org/sites/default/files/hdr2019.pdf
- Vaughan, C., and S. Dessai. 2014. Climate services for society: Origins, institutional arrangements, and design elements for an evaluation framework. Wiley Interdisciplinary Reviews. Climate Change 5 (5):587–603. doi:https://doi.org/10.1002/wcc.290.
- Victora, C. G., J. P. Vaughan, B. R. Kirkwood, J. C. Martines, and L. B. Barcelos. 1986. Risk factors for malnutrition in Brazilian children: The role of social and environmental variables. Bulletin of the World Health Organization 64 (2):299–309.
- WHO. 2005. Handbook: IMCI Integrated management of childhood illness. Geneva: World Health Organization. https://apps.who.int/iris/handle/10665/42939
- WHO. 2006. WHO child growth standards based on length/height, weight and age: WHO multicenter growth references study group. Acta Pñdiatrica Suppl 450: 76Á/85.
- Wirth, J. P., J. Matji, B. A. Woodruff, S. Chamois, Z. Getahun, J. M. White, and F. Rohner. 2017. Scale up of nutrition and health programs in Ethiopia and their overlap with reductions in child stunting. Maternal & Child Nutrition 13 (2):e12318. doi:https://doi.org/10.1111/mcn.12318.
- Woldeamanuel, B. T., and T. T. Tesfaye. 2019. Risk factors associated with under-five stunting, wasting, and underweight based on Ethiopian demographic health survey datasets in tigray region, Ethiopia. Journal of Nutrition and Metabolism 2019:6967170. doi:https://doi.org/10.1155/2019/6967170.
