
 ?Mathematical formulae have been encoded as MathML and are displayed in this HTML version using MathJax in order to improve their display. Uncheck the box to turn MathJax off. This feature requires Javascript. Click on a formula to zoom.
ABSTRACT
In the Tsitsa River catchment of the Eastern Cape Province, South Africa, concerns regarding the sedimentation of a proposed large, multipurpose, in-channel water storage scheme prompted investigations of sub-catchment suspended sediment loads and yields. Confluence-based fingerprinting and source apportionment was undertaken to explore whether this simple approach could identify relative sub-catchment contributions to downstream sediment loads, supplementing modelling and direct sampling. In November 2018, fine sediment sequestered in bed substrates was sampled above and below confluences, using a resuspension technique. The < 63 µm sample fraction underwent analysis of mineral magnetic properties, gamma emitting radionuclide activities and geochemistry to identify suitable tracers. Conservatism and range tests were used to select different combinations of composite fingerprints at seven confluences. Bivariate source apportionment using an unmixing model showed that the approach could be used as a preliminary means of determining relative sub-catchment sediment contributions. Catchment characteristics such as geology and land cover, as well as land tenure and management, were considered as explanatory factors for the difference in sediment contributions. The results for most sub-catchments were broadly similar to those from other studies. Shortcomings of this approach included the reliance on a single sampling effort, and uncertainty associated with sub-catchment sediment transport and residence times.
1. Introduction
Loss of water storage due to siltation is a significant problem in South Africa, where the economy depends on the large dams that provide consistent water supply in this semi-arid region (Le Roux, Citation2018). In 2014, the South African Department of Water Affairs (DWA) indicated their intention to construct the Ntabelanga and Lalini Dams on the Tsitsa River in the Eastern Cape Province of South Africa. This multi-purpose scheme was envisaged to supply domestic and irrigation water, and energy for power generation (van Tol et al., Citation2016). Existing soil erosion mapping and sediment yield modelling raised concerns that high sediment loads from the visibly eroded catchment would negatively impact the dams’ life span (Le Roux et al., Citation2008; van Tol et al., Citation2016). In response, the Department of Environmental Affairs, Forestry and Fisheries initiated the Tsitsa Project, that promoted soil erosion control in support of communal rural livelihoods and climate change resilience (Itzkin et al., Citation2021). The Tsitsa Project included a sub-catchment-scale suspended sediment sampling programme, undertaken from December 2015 to April 2023. In November 2018, confluence-based fingerprinting and source apportionment was undertaken to explore whether this simple approach could supplement the suspended sediment yields estimated from modelling and direct sampling, by identifying relative sub-catchment contributions to downstream sediment loads.
Sediment fingerprinting and source tracing is based on measurable physicochemical properties of fine (<63 µm) sediment that exhibit both spatiotemporal constancy and conservative behaviour and which can therefore be used to discriminate between sediment sources (Collins et al., Citation2020; Foster & Lees, Citation2000). Potential tracers include mineral magnetic properties, colour, radionuclide activities, geochemistry, particle size, and pollen (Stander et al., Citation2020; Walling & Foster, Citation2016). The ‘fingerprint’ is developed using statistical methods based on the measured properties. Composite fingerprints comprising several tracers typically provide more reliable results than single-component tracers, due to the heterogeneity of catchments, and the reduced likelihood of non-conservatism and poor discrimination that may be associated with a single component (Collins et al., Citation2020; Patault et al., Citation2019; Walling & Foster, Citation2016). Sediment fingerprints can be used to discriminate between sediment source types such as hillslopes and river channels, geological units, or surface and subsurface soils, or to provide a spatial overview, as when using confluence-based fingerprinting to apportion sediment to two sediment tributary sub-catchments (Collins & Walling, Citation2004).
Pioneered by Caitcheon (Citation1993) in Australian catchments, confluence-based fingerprinting and tracing is a relatively rapid, simple, and low-cost reconnaissance method (Collins et al., Citation2017). Where sub-catchment characteristics such as geology and land cover differ sufficiently between two confluent source tributaries, their sediment fingerprints are likely to also differ. Using an unmixing model, the relative contributions to downstream sediment of the two ‘source’ sub-catchments is determined from the proportions of their fingerprints found in a ‘sink’ sample collected below their confluence (Caitcheon, Citation1993; Walling & Foster, Citation2016).
Sediment fingerprinting and tracing have been routinely used in South Africa. Mineral magnetic properties have been used to discriminate between lithologies to ascribe sediment sources during storm events, and to apportion sources of reservoir sediments (Foster et al., Citation2005, Citation2007; Manjoro et al., Citation2017; Miller et al., Citation2022; Rowntree & Foster, Citation2012; Stander et al., Citation2020). Composite fingerprinting has been used to discriminate between non-point sediment sources, transport, and storage in agricultural catchments, and to apportion surface/subsurface sources (Manjoro et al., Citation2017; Miller et al., Citation2013). However, an extensive literature search found no references to confluence-based sediment fingerprinting and source apportionment in South Africa, prompting this exploratory confluence-based sediment fingerprinting study with the following aims:
to determine whether a single resuspension sampling effort could be used with composite tracer unmixing to make a preliminary estimate of the sub-catchment contributions to downstream sediment and, if so,
to examine whether catchment characteristics such as geology, land cover and land tenure could explain the observed differences in tributary contributions to the downstream mixture.
2. Study area
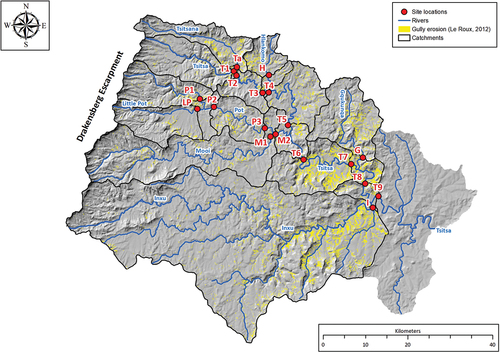
The 4900 km2 Tsitsa River catchment flows south-eastwards from the Drakensberg escarpment (~2700 m.a.s.l.) to its confluence with the Mzimvubu River (~200 m.a.s.l.) in the Eastern Cape Province of South Africa. shows the study area location, the contributing sub-catchments, the footprints of the proposed dams, and the sample-sites, while summarizes the confluence/node information and sample descriptions and coordinates.
Figure 1. Study area location, the contributing sub-catchments, the footprints of the proposed dams, and sample sites.
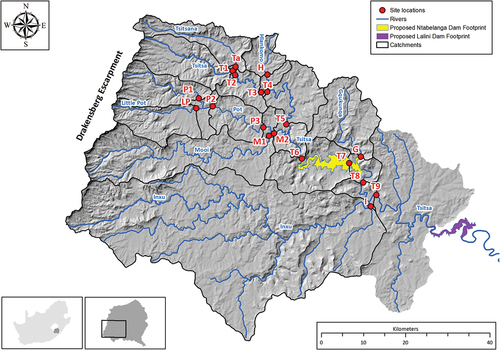
Table 1. Confluence/node numbers and names, with site codes, descriptions and coordinates (from upstream to downstream catchments).
The climate is sub-humid. Rainfall is seasonal, with mean annual precipitation ranging from ~1300 mm at the escarpment to ~620 mm towards the Mzimvubu confluence (ARC, Citation2012). Low river flows predominate from June to November with 75% of mean annual precipitation (824 mm) occurring between November and March (Moore, Citation2016). Monthly mean minimum/maximum temperatures range from −4.5/10.7 ºC (winter), and 17.1/29.8 ºC (summer). In sub-humid environments sediment is generated and stored in the dry season and is mobilized in the wet season, particularly during storm events occurring at the start of the wet season (Rowntree et al., Citation2017).
Discharge data were available for the study sub-catchments from mid-2015 (Huchzermeyer et al., Citation2019). Annual peak discharges from the DWA gauging weir T3H006, which is situated at the inlet to the Lalini Dam, are shown in . The daily discharge time-series for the study sub-catchments (01/09/2017–30/11/2018) are illustrated in
Figure 2. Peak annual discharge at DWA monitoring station T3H006 2000 – 2018.
, except for the Tsitsa above the Tsitsana, for which no hydrological data were available. Note that due to changes in the catchment area maximum discharge varied widely, from ~8 m3 s−1 for the Little Pot sub-catchment to >350 m3 s−1 for the Tsitsa River at the N2 Bridge.
Figure 3. Average daily discharge time series for sub-catchments in the Tsitsa River catchment 01 09 2017–30 11 2018.
The last major flood recorded at Station no. T3H006 was in 2013 () whilst the intervening years were relatively dry (2014–15, 2015–16 and 2016–17). Except for Hlankomo (which recorded only one high magnitude flow), the sub-catchments experienced similar sequences of sediment transporting and depositing flows (). An isolated flood in early October 2017 was later followed by a period of varied wet season flows, from mid-January 2018 to early May 2018. This was followed by the dry season low flows, during which the resuspension sampling took place in early November 2018. Whilst this indicated similar catchment-wide hydrological conditions, differences in the range of discharge magnitude between sub-catchments could have affected sediment transport capacity, in terms of both load and grain size.
The topography is generally hilly to rolling, but is broken by steep escarpments in the upper and middle catchment. As can be seen from , with the exception of the Hlankomo and Gqukunqa Rivers, the headwater tributaries of the Tsitsa River catchment originate in Drakensberg Formation basalt. A detailed lithographic description is provided in the online supplementary information (Table A1) whilst Table A2 summarizes the lithologies as sub-catchment area percentages. The Hlankomo originates in the Elliot Formation whilst the Gqukunqa originates in the Tarkastad Formation. Clarens Formation sandstones predominate in the upper catchment, progressing to Elliot Formation mud- and sandstones in the middle catchment. The lower catchment is mainly composed of Molteno Formation sand- and mudstones, and Tarkastad Formation mudstones. Karoo dolerite intrusives with associated metamorphic rocks are found throughout the area (CGS, Citation2018). The Elliot and Tarkastad Formations are the most erodible of the lithologies present (Rowntree et al., Citation2017). The latter is associated with dispersive duplex soils that are extensively gullied () and prone to piping (Le Roux & Sumner, Citation2012; Le Roux et al., Citation2015).
Figure 4. Study area geology (data sourced from CGS, Citation2018).
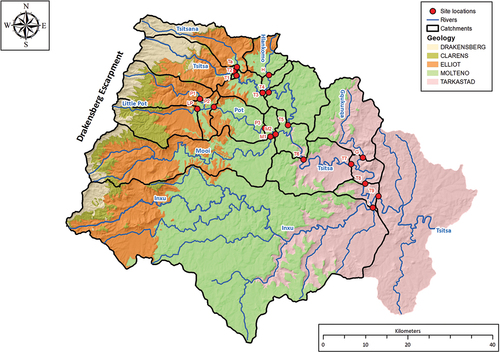
Figure 5. Gully erosion in the Tsitsa River catchment (gully data provided by Le Roux & Sumner, Citation2012).
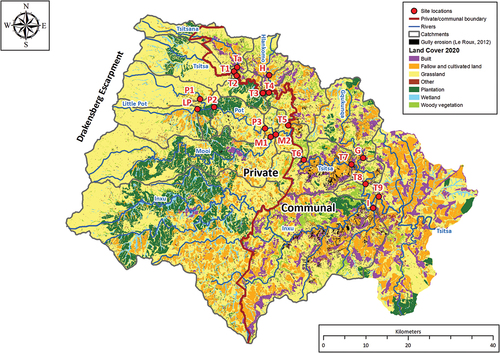
The distributions of land cover and land tenure types are illustrated in . A detailed land cover description is provided in the online Supplementary Information (Table A3) whilst Table A4 summarizes the land cover as sub-catchment area percentages. Commercial and privately-owned farmland dominates the upper (higher elevation) catchments (Little Pot, Pot and Mooi and upper Inxu), whilst the eastern edge and lower catchment (Tsitsana, Hlankomo, Middle Tsitsa, Gqukunqa, lower Inxu) lie in aformer ‘homeland’ area (i.e.a communal area reserved for black South Africans under the Apartheid regime (Rowntree et al., Citation2018). The communal area in the lower catchment is largely coincidental with the dispersive soils associated with the Tarkastad Formation (Le Roux et al., Citation2015) which are prone to erosion.
Figure 6. Study area land tenure (red line) and land cover (data provided by DFFE, Citation2020).
Grassland dominates land cover throughout the catchment, particularly in the upper catchment outside the communal areas. Mucina & Rutherford (Citation2006) describe three grassland types in the study area, all categorized as sourveld (acid grassland). Their erosion status was described as ranging from low to moderate as rainfall decreases at lower altitudes, with a commensurate decrease in cover density (Mucina & Rutherford, Citation2006).
Land management is related to land tenure and can affect, for example, the vegetation cover and erosion risk. Although discouraged, frequent burning is used throughout the Tsitsa River catchment as a management tool to encourage early spring growth of palatable grass, to create fire breaks around plantations, and to control ticks (Snyman, Citation2019). The grasslands are also impacted by cultivation, plantations, invasion by alien woody wattle species and urban and rural settlements. In communal areas, continuous grazing places additional pressure on grasslands (Itzkin et al., Citation2021).
Plantation forestry is prevalent in the upper Tsitsa, Pot, Mooi and Inxu River catchments, whilst wetlands are found in these valley bottoms and that of the Little Pot catchment. Although small in area, wetlands can function as significant sediment traps and attenuate floods (Wiener et al., Citation2022).
In most catchments, cultivation typically represents less than 10% of catchment land cover, but is more widespread in the Hlankomo (17.3%), Gqukunqa (18.9%) and Inxu River (20.5%) catchments (Table A4). Observations during field visits show that in the communal areas of the lower Tsitsa River catchment much of the area shown as cultivated has been abandoned and utilized for grazing, leaving it vulnerable to erosion. The ‘built’ areas shown in include rural villages, which are significant features of the communal areas and are associated with increased connectivity and susceptibility to erosion due to ubiquitous dirt roads, footpaths, and livestock tracks. The main built area is the town of Maclear, situated in the Mooi catchment, which has an adjacent high density informal settlement characterized by steep dirt roads.
3. Methods
The key confluences of the Tsitsa River and its tributaries were identified for sampling. This resulted in the seven ‘nodes’ for sub-catchment source attribution and apportionment that are illustrated in .
Figure 7. Schematic diagram of sediment fingerprinting nodes and sites in the Tsitsa River catchment.
In the South African context, direct suspended sediment sampling and/or the use of installed time-integrated samplers presents considerable practical difficulty, due to the adverse physical and socio-economic conditions (Bannatyne et al., Citation2022). However, when channel beds are accessible during periods of low flow it is possible to resuspend and sample fine sediment that is sequestered, for example, in gravels and potholes. Due to financial constraints, all sites were sampled during one field visit at the end of the dry season (10–16/11/2018), when water levels were low enough to allow both safe access to sites and the use of a resuspension sampling technique. In two instances (Site M2 and Site T8) the sink site of one node became one of the source sites for the node immediately downstream (, ).
Site selection was influenced by:
Site access
Source sites upstream of backwatering during high flows (judged by channel width and gradient)
Sink sites far enough downstream to allow thorough mixing of tributary flows (judged by channel width and gradient)
Samples were collected using a resuspension technique (Lambert & Walling, Citation1988; Walling et al., Citation2003). A plastic cylinder of 33 cm diameter and 31 cm height with an open top and bottom (i.e.a rigid bucket with the base removed) was driven ~5 cm into the channel substrate so that the water and sediment were trapped in the container (Huchzermeyer & Rowntree, Citation2021). The river substrate was then vigorously stirred for 30 seconds to a depth of ~10 cm using a wooden pole to release and re-suspend the fine sediments trapped in the gravel layer (Lambert & Walling, Citation1988). Plastic and wooden equipment were used to prevent metallic contamination that might affect mineral magnetic properties or subsequent geochemical analysis. To sample the full width and depth of the bucket, a set of four 450 ml plastic jars was plunged into the container and drawn upwards from the stream bed to the water surface whilst the water was still swirling rapidly inside the container (). Before capping, the samples were preserved to prevent algal growth using a water purification tablet containing 17 mg sodium dichloroisocyanurate.
Figure 8. Resuspension sampling of fine sediments (Photo: K Rowntree).
Samples were collected by moving from the most downstream place to the most upstream place in a selected river reach to avoid resampling the resulting sediment plume. Three different depositional environments were sampled at each site, including bars, potholes, and gravel bed stretches. Selection of sampling places at each site was conditioned by the presence/absence of sequestered fine sediment, and by the water depth which needed to be between 10 and 20 cm deep to isolate an area of stream bed and prevent overtopping of the container. To optimize the catchment representivity of the samples, local sediment sources were avoided, including areas of bank collapse and animal or vehicle tracks that might deliver sediment directly from local hillslopes (Caitcheon, Citation1993; Duerdoth et al., Citation2014). The degree to which the samples were representative of the sediment transport and deposition sequences that had occurred during the previous wet season was unknown, but was assumed to be similar for each pair of sub-catchments (Caitcheon, Citation1993; Collins et al., Citation2017; Patault et al., Citation2019; Vale et al., Citation2016; Walling, Citation2013; Walling & Foster, Citation2016; Walling et al., Citation2007).
The samples were retained in their original jars and allowed to settle for 6 weeks, after which the supernatant was siphoned off and the samples were oven-dried at 39° C until completely desiccated, as evidenced by moisture indicator crystals in the oven. Desiccating at 39° C ensured that the magnetic properties of the samples were unaffected by the temperature (Caitcheon, Citation1993; Collins et al., Citation2012). The sediment was gently disaggregated using a pestle and mortar following the removal of visible plant and invertebrate fragments. Samples were then dry sieved to obtain the <1000 µm fraction which, due to the small amount of material recovered, was composited at each site to provide a single sample. This also accommodated any variability resulting from different reach-scale depositional environments (Duerdoth et al., Citation2014; Lambert & Walling, Citation1988; Walling et al., Citation2003). A small sub-sample of the <1000 µm fraction from each site was treated with hydrogen peroxide to remove organic matter and disperse aggregates, and the particle size distribution was determined using the Malvern Mastersizer 3000 laser diffraction system. These results were interpreted to derive the particle size distribution of the <63 µm fraction to align with the results from other analyses.
The remaining sample material for each site was sieved to obtain the <63 µm fraction (Collins et al., Citation2012). Analysis of the physicochemical properties of the <63 µm samples was undertaken to determine their fingerprints using the same sample material throughout the analyses. Available equipment, technical expertise, and funding allowed the following analyses to be undertaken:
mineral magnetic properties including susceptibility and remanence,
gamma emitting radionuclide activities,
geochemical analysis,
organic matter content.
Mineral magnetic properties were measured at the Geography Department Rhodes University, according to the methods outlined in Walden et al. (Citation1999) and Walling and Foster (Citation2016). Samples were compacted into standard 10 ml polystyrene containers to ensure that particles in the sample material were unable to re-orientate whilst magnetic remanence was being measured in the Molspin® spinner magnetometer. summarizes the mineral magnetic properties measured and the equipment used, whilst summarizes the units and calculations associated with the properties that were measured and derived from the mineral magnetic analysis. Replicate measurements showed that the percentage coefficient of variation (%CV) for measured magnetic susceptibility was < 10%, whilst the %CV for measured magnetic remanence was < 5% (Miller, Citation2021).
Table 2. Mineral magnetic properties: measurements and equipment.
Table 3. Mineral magnetic properties: Units and calculations.
The activities of lithogenic and fallout radionuclides present in the samples were measured at the Faculty of Arts, Science & Technology, University of Northampton (UoN) using Ortec EG&G hyperpure Ge detectors in a well configuration. Sample preparation and analysis were undertaken in accordance with the procedures described in Collins et al. (Citation2012). Activities of210Pb; 226Ra; 7Be; 137Cs; 228Ac; 40K; 234Th; 235U; and212Pb were determined on all samples and counting errors are reported to ±1 standard error.
Geochemical analysis was undertaken using a Thermo Scientific ICAP 6000 inductively coupled plasma optical emission spectrometer (ICP-OES), at the Institute for Creative Leather Technologies, UoN. Samples were prepared and analysed in accordance with the procedures described in EPA/SW 846 Methods 3015/3050B/6010B (SERAS, 2006), with the exception that hydrochloric acid (HCl) digestion was used because facilities for hydrogen fluoride (HF) and the more commonly used aqua regia digestion were unavailable. This likely resulted in the incomplete digestion and extraction of elements, increasing uncertainty in the tracing results (Nosrati et al., Citation2022).
The selection of elements for analysis was guided by solubility in HCl, chemical stability of the elements, and the sub-catchment scale geological and land-use provenances present in the study area (). B, Mg, Al, P, S, K, Ca, Ti, Cr, Mn, Fe, Co, Ni, Cu, Zn, Sr, Y, Zr, Ba, and Pb were measured. Replicate measurements showed that measurement errors were less than ±5%.
X-ray fluorescence analysis was undertaken using a handheld Thermoscientific Niton XL3t Goldd XRF analyser. Samples were placed in crucibles for measurement. Readings were taken in mg kg−1. Whilst the elements analysed in this manner (Al, Si, Cl, K, Ca, Ti, V, Cr, Mn, Fe, Zn, As, Rb, Sr, Zr, Nb, Mo, Pb, and Bi) overlapped with some of those analysed using the ICP, the different techniques effectively provided discrete suites of potential tracers. Results from X-ray fluorescence were reported to within 2 standard deviations.
Lastly, loss on ignition was used to determine the percentage of organic matter present in each <63 µm sample. Samples were weighed to four decimal places of a gram, subjected to one 4 hr cycle of 450° C in a Carbolite Industries SCF1100 muffle furnace, and reweighed after cooling in a desiccator. The difference in weight was calculated as a percentage loss due to the removal of organic matter by combustion and applied as a correction factor to the magnetic analyses (Foster et al., Citation2008).
The analytical methods described above yielded more than 60 potential magnetic, radionuclide, and geochemical tracers. Of these, non-conservative and non-discriminative tracers were rejected on a tracer-by-tracer basis at each tributary node, using the decision tree shown in . This resulted in 34 tracers in total, but the number of acceptable tracers varied by node. There was no colour difference between samples after LOI, discounting colour as a possible tracer. Particle size was also discounted as a possible tracer due to a lack of any significant difference among the paired sources and the main channel sink.
Figure 9. Flow chart showing the application of range and ratio tests on a tracer-by tracer basis to eliminate non-conservative and non-discriminant tracers.
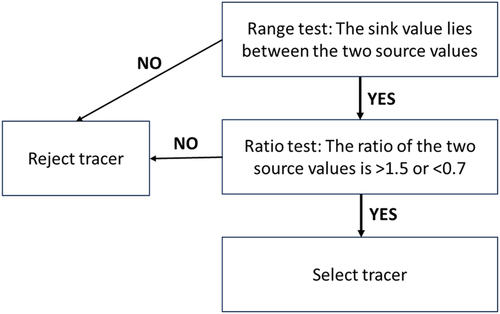
The range test ensured that selected tracers displayed mass conservation, whilst the parameters chosen for the ratio test (>1.5 or < 0.7) ensured robust bivariate source discrimination (Caitcheon, Citation1993; Patault et al., Citation2019; Vale et al., Citation2016). The magnetic susceptibility parameters (Xlf and Xhf) and the remanence properties (SIRM and IRM 100) are always highly correlated (Walling & Foster, Citation2016) and are used to derive Xfd and the S ratio respectively. Consequently, such correlated tracers were identified, and the tracer with the least difference between source values was rejected to prevent co-linearity (which could skew source apportionment). With only two sources and different tracer combinations at each node, it was not possible to use multivariate statistics such as Principal Component or Discriminant Function Analysis to establish tracer co-linearity as is often done using multiple source samples following the range test (e.g. Collins et al., Citation2020).
Source apportionment at each node was undertaken using the selected tracers in an ‘unmixing’ model, Mixmods.xls (Foster, Citation2001) based on a SIMPLEX algorithm as described by Thompson (Citation1986) and available in the ‘Solver’ routine in the MSExcel 2013 Data Analysis Toolpak. Mixmods.xls minimizes the sum of squared differences between the observed and modelled concentrations in the sink mixture for the tracers that were input to the model to ‘unmix’ and apportion the percentage of the sediment contribution of each of the sources. It was not possible to do a conventional Monte Carlo simulation as recommended by Collins et al. (Citation2020), as there was only one single source measurement for each potential contributing source.
To provide insight into comparative sub-catchment sediment production by accounting for different areas of the paired catchments, the results of source apportionment were weighted by the percentage area of each sub-catchment contributing to the confluence as described by Miller et al. (Citation2022) and shown in EquationEquations (1)(1)
(1) and (Equation2
(2)
(2) ). The result indicates the relative sediment yield of the paired source catchments at each node.
The relative sediment yield for the two sub-catchments at each node was expressed as a ratio by dividing the largest value by the smallest.
4. Results and discussion
4.1. Particle size distribution
The particle size distribution summary for each of the sampled sites is summarized in . There was minimum difference between the paired confluences and the downstream sink. This meant that particle size variation was unlikely to be a potential source of observed differences in tracer concentrations, increasing the reliability of the results.
Table 4. Particle size distribution of the <63 µm fraction at each of the sampled sites.
4.2. Fingerprinting and tracing
Each of the nodes was represented by fingerprints of at least three and up to sixteen tracers, that were derived from at least two analytical methods. Different combinations of tracers discriminated most effectively at different tributary nodes, providing at least three independent analyses at each node for input to source apportionment modelling using mixmod.xls. summarizes which of the 34 tracers were selected at each node, based on mass conservation, source discrimination, and, in the case of mineral magnetic properties, non-correlation.
Table 5. Tracers that were selected for source apportionment at each node.
4.3. Apportionment of suspended sediment contributions
Suspended sediment fingerprinting and tracing allowed apportionment between the two source channels at each confluence and showed the relative sediment contributions from the tributaries of the Tsitsa River catchment, thereby achieving the first aim of this study. Further, compensating for catchment area indicated the sub-catchments in the Tsitsa River system that had a higher erosion risk. However, without more detailed hydrological characterization and further sampling and multivariate analysis of e.g. banks, floodplains, hillslope surfaces and gullies, this approach could not differentiate between sources within sub-catchments, or indicate which sources were related to events of varying discharge magnitude. Neither can any tracing method on its own give insight into quantitative yields.
Sub-catchment sediment contributions at each node are illustrated in . summarizes the proportional sub-catchment contributions and the ratio of contributions to downstream suspended sediment. Sediment production per unit area and the ratio of sub-catchment sediment production at each node in the Tsitsa River catchment are also summarized in .
Figure 10. The proportional contribution of sub-catchments to downstream sediment at each node in the Tsitsa River catchment, represented by pie chart segments.
Table 6. Sub-catchment area, relative area and average thalweg gradient; proportional sub-catchment sediment contributions and the ratio of contributions to downstream sediment; comparative sediment production per unit area and the ratio of sub-catchment sediment production at each node in the Tsitsa River catchment.
The results summarized in agree broadly with those from modelled and measured approaches. Confluence-based fingerprinting showed that the Tsitsana, Hlankomo, and Gqukunqa River catchments contributed significantly to downstream sediment, whilst the Little Pot, Pot and Mooi catchments were shown to be relatively minor contributors. These results are in broad agreement with those derived from modelling (Le Roux et al., Citation2015) and from direct measurement (Bannatyne et al., Citation2022). However, direct suspended sediment measurement of the Inxu and Tsitsa above their confluence indicated that for the 2017–2018 wet season the Inxu supplied ~ 83% of downstream sediment (based on suspended sediment load), and ~ 6.5 times more sediment per unit area than the Tsitsa (based on suspended sediment yield, Bannatyne et al. (Citation2022)). The source apportionment at Node 7 aligns less well with these findings, perhaps because these two large catchments may have highly variable source contributions (Liu et al., Citation2023): measured sediment loads and yields varied greatly between 2015 and 2019, notably for the Inxu and to a lesser extent for the Tsitsa above this confluence (Bannatyne et al., Citation2022).
4.4. The role of catchment characteristics in the relative contributions of paired catchments
Whilst the results are constrained by the single sampling effort, the spatial relationship between soil erosion and geology, soils, land tenure, land cover, and land management becomes evident (, ). Slope gradient does not appear to be a significant factor; the Little Pot has the steepest gradient but contributes relatively little sediment whereas the Gqukunqa has the lowest gradient but a relative high contribution. All other catchments have a similar gradient.
A comparison of and shows that gullies are especially prevalent on the Tarkastad Formation, which is coincident with the communal areas of the lower Inxu and Tsitsa catchments. The mudstones of the Elliot and Molteno Formations occurring throughout the middle catchment are also vulnerable to gully erosion (van der Waal et al., Citation2015). This is more pronounced in the communal areas, i.e. the Tsitsana, Hlankomo, Gqukunqa, the Tsitsa between the Hlankomo and Mooi confluences, and the Inxu ().
Figure 11. The relationship between the percentage sub-catchment areas of communal land tenure and gullies.
The Pot, Little Pot and Mooi are 100% privately/commercially owned and have low sediment production rates, likely related to less erodible geology, denser grass cover, and the presence of wetlands. Plantation forestry covers significant areas of both the Pot and Mooi sub-catchments, but the greater plantation cover in the Mooi is associated with a lower relative sediment production rate than that of the Pot at Node 4 (). Plantation forestry is therefore not seen to be a significant sediment source, in contradiction to the findings of Hill et al. (Citation2019) who, through modelling, found that the sediment yield from forest plantations was greater than that from both grassland and cultivated land.
In the areas dominated by communal land tenure, decreased rainfall due to lower altitude reduces the grass cover and increases the erosional status (Mucina & Rutherford, Citation2006). Poor grazing practices, often utilizing abandoned cultivated areas, exacerbate this greater erosion potential by further reducing vegetative cover and negatively impacting wetlands (Itzkin et al., Citation2021).
A significant difference between the two land tenure categories is the extent of the built cover class. As the percentage of communal ownership increases, so does the extent of the built area ().
Figure 12. The relationship between the percentage sub-catchment areas of communal land tenure and built land cover.
In the communal areas, built areas refer to villages with their associated unmetalled roads, footpaths, livestock tracks and concentrated grazing pressure (personal observation). Although small as a percentage area, these built areas produce high surface runoff, are foci of erosion and sediment production and transfer through gully systems, thus increasing connectivity between hillslopes and channels (van der Waal & Rowntree, Citation2018).
4.5. Sources of uncertainty associated with these results
There are several sources of uncertainty associated with this exploratory approach to source apportionment and determination of sediment production per unit area. Firstly, the temporal representation of the sampled sediment was unknown: the results might represent the latest high-water event, or the previous wet season, or be the result of longer-term, multi-year deposition (Kitch et al., Citation2019; Liu et al., Citation2023; Walling & Foster, Citation2016). The residence time of such sequestered sediment is difficult to determine, but the assumption was made that it is spatiotemporally representative of upstream catchment characteristics, due to the ‘averaging’ effect of repeated flows of different magnitudes (Caitcheon, Citation1993; Collins et al., Citation2017; Patault et al., Citation2019; Vale et al., Citation2016; Walling, Citation2013; Walling & Foster, Citation2016; Walling et al., Citation2007). Repeat sampling or time-integrated samplers would be required to constrain this uncertainty (c.f. Patault et al., Citation2019).
The second assumption was that sediment transport and deposition occurred in a similar way in the two paired sub-catchments and in the downstream sink. This assumption should hold for those nodes where the area of the two source catchments was similar, especially given that indicates a similar basin-wide hydrological response. Exceptions are the confluence of the Hlankomo and Gqukunqa Rivers with the Tsitsa River (see ). Sediment particle size is known to influence tracing results (Collins et al., Citation2020) but Laceby et al. (Citation2017) claim that tributary tracing techniques can mitigate this problem. confirms that the <63 µm fraction particle size was very similar for the paired catchments and associated sink at each node.
5. Conclusions and recommendations
Confluence-based fingerprinting using composite tracers successfully apportioned the 2017–2018 suspended sediment contributions of sub-catchments in the Tsitsa River catchment in South Africa. This relatively rapid, low-cost, and simple technique can be used standalone for a reconnaissance survey of sediment sources. It can also guide effective and efficient suspended sediment sampling programme design.
The study indicates that land tenure, in association with geology and land cover, are major determinants of sediment source areas in the Tsitsa River catchment. The communal areas of the Tsitsana, Hlankomo, Gqukunqa, Tsitsa, and Inxu catchments contribute significant amounts of sediment to downstream areas and should be prioritized for interventions that aim to reduce soil loss from hillslopes and consequent downstream dam siltation.
The results presented in this paper were derived from a single survey and are subject to uncertainties relating to temporal representation, hydrological variability, and the efficacy of the different substrates to sequester sediment within the <63 µm fraction. Further investigation is required to validate the resuspension technique under the conditions prevailing in the Tsitsa catchment. Repeat surveys would help to reveal the temporal variability of sequestered sediment under different flow sequences. The survey could be spatially extended in order to provide insight into the distribution of key sediment sources, for example to include the tributaries of the Inxu which is currently represented in its entirety by one site.
Supplementary information.docx
Download MS Word (22.6 KB)Acknowledgments
We thank the South African Department of Forestry, Fisheries and the Environment which supported this research as part of the Tsitsa Project (http://www.ru.ac.za/tsitsaproject).
We thank Dr Ruth Copeland Phillips, Dr Simon Pulley, Dr Atish Vadher, and Mr Paul Stroud (Faculty of Art, Science and Technology at the University of Northampton) for their advice and support with the geochemical, XRD and radionuclide analysis. Mr Abe Ngoepe (Geography Department at Rhodes University) is thanked for his assistance with the analysis of mineral magnetic properties and with radionuclide sample preparation.
We are indebted to our reviewers and editors for their deep engagement with this paper. We thank them for their time and insight, which significantly improved the quality of the manuscript.
Disclosure statement
No potential conflict of interest was reported by the author(s).
Supplementary data
Supplemental data for this article can be accessed online at https://doi.org/10.1080/03736245.2024.2372249.
Additional information
Funding
References
- ARC. (2012). ARC-ISCW agrometeorology weather station network data for South Africa. Pretoria: ARC-Institute for Soil, Climate and Water.
- Bannatyne, L. J., Foster, I. D. L., Rowntree, K. M., & van der Waal, B. W. (2022). Suspended sediment load estimation in a severely eroded and data poor catchment. Hydrological Processes, 36(11), e14730. https://doi.org/10.1002/hyp.14730
- Caitcheon, G. G. (1993). Sediment source tracing using environmental magnetism: A new approach with examples from Australia. Hydrological Processes, 7(4), 349–358. https://doi.org/10.1002/hyp.3360070402
- CGS. (2018). Council for Geoscience. 1:1 000 000 geological map vector. Retrieved July 3, 2023, from https://maps.geoscience.org.za/portal/apps/sites/#/council-for-geoscience-interactive-web-map-1
- Collins, A. L., Blackwell, M., Boeckx, P., Chivers, C. A., Emelko, M., Evrard, O., Foster, I., Gellis, A., Gholami, H., Granger, S., Harris, P., Horowitz, A. J., Laceby, J. P., Martinez-Carreras, N., Minella, J., Mol, L., Nosrati, K., Pulley, S. , and Zhang, Y. (2020). Sediment source fingerprinting: Benchmarking recent outputs, remaining challenges and emerging themes. Journal of Soils and Sediments, 20(12), 4160–4193. https://doi.org/10.1007/s11368-020-02755-4
- Collins, A. L., Pulley, S., Foster, I. D. L., Gellis, A., Porto, P., & Horowitz, A. J. (2017). Sediment source fingerprinting as an aid to catchment management: A review of the current state of knowledge and a methodological decision-tree for end-users. Journal of Environmental Management, 194, 86–108. https://doi.org/10.1016/j.jenvman.2016.09.075
- Collins, A. L., & Walling, D. E. (2004). Documenting catchment suspended sediment sources: Problems, approaches and prospects. Progress in Physical Geography, 28(2), 159–196. https://doi.org/10.1191/0309133304pp409ra
- Collins, A., Zhang, Y., Williams, L., Foster, I., & McMillan, S. (2012). Sediment investigations in support of catchment management in the Western Rother Issued by : Soils, Agriculture, and Water, ADAS. () () Final Report to the Environment Agency.
- DFFE. (2020). South African national land cover database. https://egis.environment.gov.za/sa_national_land_cover_datasets
- Duerdoth, C., Arnold, A., Murphy, J., Naden, P. S., Scarlett, P., Collins, A. L., Sear, D. A., & Jones, J. I. (2014). Assessment of a rapid method for quantitative reach-scale estimates of deposited fine sediment in rivers. Geomorphology, 230, 37–50. https://doi.org/10.1016/j.geomorph.2014.11.003
- Foster, I. D. L. (2001). Un-mixing models using the Microsoft excel solver routines: an explanation of the theory and description of solver routines in the EXCEL workbook: Mixmods. xls. Coventry: Coventry University.
- Foster, I. D. L., Boardman, J., & Keay-Bright, J. (2007). Sediment tracing and environmental history for two small catchments, Karoo Uplands, South Africa. Geomorphology, 90(1–2), 126–143. https://doi.org/10.1016/j.geomorph.2007.01.011
- Foster, I. D. L., Boardman, J., Keay-Bright, J., & Meadows, M. E. (2005). Land degradation and sediment dynamics in the South African Karoo. In A. J. Horowitz & D. Walling (Eds.), Sediment budgets 2. (IAHS Symposium, Foz do Iguacu, Brazil, April 2005). IAHS Pub.292 (pp. 207–213). Wallingford: IAHS press.
- Foster, I. D. L., Oldfield, F., Flower, R. J., & Keatings, K. (2008). Mineral magnetic signatures in a long core from lake qarun, middle Egypt. Journal of Paleolimnology, 40(3), 835–849. https://doi.org/10.1007/s10933-008-9202-x
- Foster, I., & Lees, J. (2000). Tracers in geomorphology: Theory and applications in tracing fine particulate sediments. In I. Foster (Ed.), Tracers in geomorphology (pp. 3–20). Wiley. https://pascal-francis.inist.fr/vibad/index.php?action=getRecordDetail&idt=6171219
- Hill, T. R., Scott-Shaw, B. C., Gillham, J. S., Dickey, M., Duncan, G. E., Everson, C. S., Everson, T. M., Zuma, K., & Birkett, C. K. (2019). Assessing the impact of erosion and sediment yield from farming and forestry systems in selected catchments of South Africa. WRC Report TT788/19.
- Huchzermeyer, N. H., & Rowntree, K. (2021). Developing a taxa-related physical habitat score based on the response of macroinvertebrate community structure to fine bed sediment composition in the Tsitsa River, Eastern Cape, South Africa. River Research and Applications, 37(10), 1437–1450. https://doi.org/10.1002/rra.3857
- Huchzermeyer, N., Schlegel, P., & Van der Waal, B. W. (2019). Biophysical monitoring methods in the Upper Tsitsa Catchment (T35 A-E). Unpublished project report of the Tsitsa Project.
- Itzkin, A., Scholes, M. C., Clifford-Holmes, J. K., Rowntree, K., van der Waal, B., & Coetzer, K. (2021). A social-ecological systems understanding of drivers of degradation in the Tsitsa river catchment to inform sustainable land management. Sustainability, 13(2), 516. 18 January 2021. https://doi.org/10.3390/su13020516
- Kitch, J. L., Phillips, J., Peukert, S., Taylor, A., & Blake, W. H. (2019). Understanding the geomorphic consequences of enhanced overland flow in mixed agricultural systems: Sediment fingerprinting demonstrates the need for integrated upstream and downstream thinking. Journal of Soils and Sediments, 19(9), 3319–3331. https://doi.org/10.1007/s11368-019-02378-4
- Laceby, J. P., Evrard, O., Smith, H. G., Blake, W. H., Olley, J. M., Minella, J. P. G., & Owens, P. N. (2017). The challenges and opportunities of addressing particle size effects in sediment source fingerprinting: A review. Earth-Science Reviews, 169, 85–103. https://doi.org/10.1016/j.earscirev.2017.04.009
- Lambert, C. P., & Walling, D. E. (1988). Measurement of channel storage of suspended sediment in a gravel-bed river. Catena, 15(1), 65–80. https://doi.org/10.1016/0341-8162(88)90017-3
- Le Roux, J., Barker, C., Weepener, H., Van den Berg, E., & Pretorius, S. (2015). Sediment yield modelling in the umzimvubu catchment. Water Research Commission.
- Le Roux, J. J. (2018). Sediment yield potential in south africa’s only large river network without a dam: implications for water resource management. Land Degradation & Development, 29(3), 765–775. https://doi.org/10.1002/ldr.2753
- Le Roux, J. J., Mashimbye, Z. E., Weepener, H. L., Newby, T. S., & Pretorius, D. J. (2008). Erosion status of priority tertiary catchment areas identified by the soil protection strategy of the department of agriculture. Report No. GW/A/2008. ISCW.
- Le Roux, J. J., & Sumner, P. D. (2012). Factors controlling gully development: Comparing continuous and discontinuous gullies. Land Degradation & Development, 23(5), 440–449. https://doi.org/10.1002/ldr.1083
- Liu, Y., Walling, D. E., Yang, M., & Zhang, F. (2023). Sediment source fingerprinting and the temporal variability of source contributions. Journal of Environmental Management, 338, 117835. https://doi.org/10.1016/j.jenvman.2023.117835
- Manjoro, M., Rowntree, K., Kakembo, V., Foster, I., & Collins, A. L. (2017). Use of sediment source fingerprinting to assess the role of subsurface erosion in the supply of fine sediment in a degraded catchment in the Eastern Cape, South Africa. Journal of Environmental Management, 194, 27–41. https://doi.org/10.1016/j.jenvman.2016.07.019
- Miller, J. (2021). Sediment source tracing using reservoir sediments in Kruger national park, S Africa. Makhanda (Grahamstown): Rhodes University PhD Thesis.
- Miller, J. K., Rowntree, K. M., Foster, I. D. L., Reinwarth, B., & Baade, J. (2022). Application of environmental magnetism to estimate source contribution by lithology to Kruger National Park reservoirs. Hydrological Processes, 36(10), e14709. https://doi.org/10.1002/hyp.14709
- Miller, J. R., Mackin, G., Lechler, P., Lord, M., & Lorentz, S. (2013). Influence of basin connectivity on sediment source, transport, and storage within the Mkabela Basin, South Africa. Hydrology and Earth System Sciences, 17(2), 761–781. www.hydrol-earth-syst-sci.net/17/761/2013/12July2023
- Moore, N. J. (2016). Rainfall erosivity in the tsitsa catchment, eastern cape, South Africa. Grahamstown: Rhodes University Unpublished Honours project.
- Mucina, L., & Rutherford, M. C. (2006). (Eds) The vegetation of South Africa, Lesotho and Swaziland Strelitzia 19. Pretoria: South African National Biodiversity Institute.
- Nosrati, K., Moradian, H., Dolatkordestani, M., Mol, L., & Collins, A. L. (2022). The efficiency of elemental geochemistry and weathering indices as tracers in aeolian sediment provenance fingerprinting. Catena, 210, 105932. https://doi.org/10.1016/j.catena.2021.105932
- Patault, E., Alary, C., Franke, C., & Abriak, N. E. (2019). Quantification of tributaries contributions using a confluence-based sediment fingerprinting approach in the Canche river watershed (France). Science of the Total Environment, 668, 457–469. https://doi.org/10.1016/j.scitotenv.2019.02.458
- Rowntree, K., & Foster, I. (2012). A reconstruction of historical changes in sediment sources, sediment transfer and sediment yield in a small, semi-arid Karoo catchment, semi-arid South Africa. Zeitschrift für Geomorphologie, Supplementary Issues, 56(1), 87–100. https://doi.org/10.1127/0372-8854/2012/S-00074
- Rowntree, K. M., Conde Aller, L., Fox, H., Duma, M., & Ntshudu, M. (2018). Improving socio-economic conditions through landscape greening, a case study from the Tsitsa catchment, uMzimvubu basin. In Improving socio-economic conditions in the Tsitsa catchment and Ohombe communities through landscape greening and integrated green innovations. Pretoria: Water Research Commission. WRC Research Report TT 777/1/18 195 pp. Pretoria.
- Rowntree, K. M., van der Waal, B. W., & Pulley, S. (2017). Magnetic susceptibility as a simple tracer for fluvial sediment source ascription during storm events. Journal of Environmental Management, 194, 54–62. https://doi.org/10.1016/j.jenvman.2016.11.022
- Snyman, G. (2019). An investigation into the fire regimes of the upper Tsitsa River catchment. Makhanda (Grahamstown): Rhodes University MSc Thesis.
- Stander, M. H., Le Roux, J. J., Abd Elbasit, M. A. M., & Liu, G. (2020, July 27). A review of sediment fingerprinting for erosion hotspot assessment in southern Africa. South African Geographical Journal, 103(1), 82–98. https://www.tandfonline.com/doi/full/10.1080/03736245.2020.1791240
- Thompson, R. (1986). Modelling magnetization data using SIMPLEX. Physics of the Earth and Planetary Interiors, 42(1–2), 113–127. https://doi.org/10.1016/S0031-9201(86)80013-9
- Vale, S. S., Fuller, I. C., Procter, J. N., Basher, L. R., & Smith, I. E. (2016). Application of a confluence-based sediment-fingerprinting approach to a dynamic sedimentary catchment, New Zealand. Hydrological Processes, 30(5), 812–829. https://doi.org/10.1002/hyp.10611
- van der Waal, B., Rowntree, K., & Pulley, S. (2015). Flood bench chronology and sediment source tracing in the upper Thina catchment, South Africa: The role of transformed landscape connectivity. Journal of Soils and Sediments, 15(12), 2398–2411. https://doi.org/10.1007/s11368-015-1185-4
- van der Waal, B. W., & Rowntree, K. M. (2018). Landscape connectivity in the upper mzimvubu river catchment: An assessment of anthropogenic influences on sediment connectivity 29. Land Degradation & Development 713- 723 doi:10.1002/ldr.2766.
- van Tol, J., Akpan, W., Kanuka, G., Ngesi, S., & Lange, D. (2016). Soil erosion and dam dividends: Science facts and rural ‘fiction’ around the Ntabelanga dam, Eastern Cape, South Africa. South African Geographical Journal, 98(1), 169–181. https://doi.org/10.1080/03736245.2014.977814
- Walden, J., Oldfield, F., & Smith, J. (Eds.). (1999). Environmental magnetism: A practical guide. Quaternary Research Association.
- Walling, D. E. (2013). The evolution of sediment source fingerprinting investigations in fluvial systems. Journal of Soils and Sediments, 13(10), 1658–1675. https://doi.org/10.1007/s11368-013-0767-2
- Walling, D. E., & Foster, I. D. L. (2016). Using environmental radionuclides and sediment geochemistry for tracing and dating fine fluvial sediment. In G. M. Kondolf & H. Piegay (Eds.), Tools in fluvial geomorphology (pp. 183–209). Chichester: Wiley-Blackwell.
- Walling, D. E., Owens, P. N., Carter, J., Leeks, G. J. L., Lewis, S., Meharg, A. A., & Wright, J. (2003). Storage of sediment-associated nutrients and contaminants in river channel and floodplain systems. Applied Geochemistry, 18(2), 195–220. https://doi.org/10.1016/S0883-2927(02)00121-X
- Walling, D. E., Webb, B. W., & Shanahan, J. (2007). Investigations into the use of critical sediment yields for assessing and managing fine sediment inputs into freshwater ecosystems. Natural England Research Reports, 007.
- Wiener, K. D., Schlegel, P. K., Grenfell, S. E., & van der Waal, B. (2022). Contextualising sediment trapping and phosphorus removal regulating services: A critical review of the influence of spatial and temporal variability in geomorphic processes in alluvial wetlands in drylands. Wetlands Ecology and Management, 30(4), 737–770. https://doi.org/10.1007/s11273-022-09861-9