
ABSTRACT
While the contemporary influenza season in South Africa is understood, its historical occurrence and dynamics are not. This study applies methods in historical geography, using archival newspaper reports to reconstruct the historical influenza season in South Africa over the past century (1904–2019) to examine changes in the seasonality of influenza in South Africa, and to compare this to contemporary records. A 20% seasonal threshold was calculated and applied to the data to return this approximate 19-week season, with the start of the influenza season ranging from week one in 1917 to week 41 of the year in 1918. On average, over the past century, the South African influenza season has started in the first week of May and ended in the last week of August, lasting 19 weeks. This outcome aligns with the contemporary influenza season described in other studies. These records reveal considerable interannual variability in length and timing with no unimodal shifts. The most linked climate phenomenon to influenza transmission rate were cold and winter conditions. This has important implications in advancing the timing of influenza vaccines to the late summer and early autumn weeks. Moreover, this shows how archival newspaper proxy records can help us reconstruct the past.
Introduction
Influenza, an acute viral upper respiratory disease, causes half a million deaths globally each year (Kandeel et al., Citation2016), but has a much lower mortality rate when compared to other respiratory diseases such as pneumonia (Alonso et al., Citation2007). While people can contract influenza several times in their lives, certain populations are at higher risk of hospitalization and mortality from influenza, including children under five and people over 60 years of age, pregnant people, and people with other health conditions such as HIV/AIDS or tuberculosis (Cohen et al., Citation2021; Fraaij & Heikkinen, Citation2011). This means that there are particularly vulnerable populations that can be protected from this vaccine-preventable disease, provided that influenza vaccines are administered sufficiently early each year (Azziz Baumgartner et al., Citation2012).
Influenza exhibits a clear seasonal trend, with the peak infection rate occurring in winter (Fuhrmann, Citation2010; NICD, Citation2023). Influenza seasonality is particularly distinct in temperate and subtropical regions of the world, with only East and Southeast Asia experiencing a year-round influenza season (Moa et al., Citation2019). The winter seasonality of the flu is understood to be due to two factors: first, cold temperatures are more favourable conditions for influenza pathogens to spread; and second, in winter people spend more time in crowded indoor spaces with windows closed (Fuhrmann, Citation2010; Moa et al., Citation2019). In South Africa, winter is statistically classified as starting in June and ending in August (Van der Walt & Fitchett, Citation2020), which coincides with the South African National Institute of Communicable Diseases (NICD, Citation2019) defined 19-week influenza season, when classified on the basis of hospitalization and medical aid claims data (Motlogeloa et al., Citation2023). The seasonal occurrence of infectious diseases like influenza has been understood since around 300 BCE and the beginning of Hippocratic medicine (Fisman, Citation2007). However, most studies on influenza focus on either the spread or the effects of influenza on individuals and do not examine the narratives around the illness. This study aims to understand both the seasonality of historical influenza as well as the colloquial narratives around influenza and climatic phenomena.
Over the past century the climate (Lee et al., Citation2023), healthcare system, and the development and administration of influenza vaccines in South Africa (Maphumulo & Bhengu, Citation2019) have changed, and thus the seasonality of influenza may have shifted. It is argued that tracking the seasonality of influenza is important as it can inform allocation of resources in the healthcare sector, preparing for peak infection periods and protecting at risk populations (Kandeel et al., Citation2016). However, long-term data and records that track changes in influenza seasonality are lacking. This study draws on the extensive literature on environmental histories, and the reconstruction of climatic histories in southern Africa (Cheval et al., Citation2021; Fitchett & Raik, Citation2021; Fitchett et al., Citation2022; Grab & Nash, Citation2010; Kelso & Vogel, Citation2007; Nash et al., Citation2015, Citation2019; Snyman & Fitchett, Citation2022; Tavares et al., Citation2021; Vogel, Citation1989), to explore the influenza season over the past century from newspaper records. Given the impact that influenza has on human wellbeing, seasonal outbreaks of influenza, and cases of influenza amongst people in the public eye have been widely reported in newspapers. Analyses of these reports provides a source of data from which interannual changes in the timing and duration of the influenza season can be reconstructed.
Historical climatology and geography
In regions where long-term datasets are not available, approaches in historical climatology and historical geography can aid in the compilation of information to explore long term change (Harris, Citation1991; Moore, Citation2010). It is argued that because of its clear seasonal pattern, it is easy to identify historical influenza patterns without testing or hospitalization data (Monto, Citation2008). Thus, it is possible to use a proxy data source to reconstruct influenza seasonality.
A key source of data in reconstructing records is the use of archival newspapers (Cheval et al., Citation2021, Nash et al., Citation2019). This provides a way to explore changes in climate over centuries, as well as discrete climate events. Therefore, archival newspaper reporting data has been crucial to examining climate change, especially in the absence of long-term meteorological records (Cheval et al., Citation2021). While newspaper reports were already a useful source of data pre-2000 (Vogel, Citation1989), this method of data collection became more accessible and thus more widely used after the 2000s (Cheval et al., Citation2021; Grab & Nash, Citation2010; Nash et al., Citation2015, Citation2019; Tavares et al., Citation2021). This is mainly as a result the digitization of archival newspapers which became more available with a more widely accessible through the world wide web, however, in many places this only happened later than the early 2000s as digitization is a slow process (Bingham, Citation2010; Nicholson, Citation2013). Systematically digitized newspaper archives today offer a large amount of continuous data over a long period of time, up to several centuries, however, newspaper records from 1800 to 1900 are the most accessible globally as there are less copyright concerns than more recent newspaper publications (Bingham, Citation2010).
Archival newspaper sources have also been used is in historical geography. One of the main ways that this approach has been applied is in exploring changes in seasonality in the natural world, through exploring phenological events such as the timing of butterfly migration or different plant flowering dates (Fitchett & Raik, Citation2021; Fitchett et al., Citation2022; Snyman & Fitchett, Citation2022). Linking certain events or seasonal shifts to climate change can only be done when more than 30 years of data is analysed, therefore, long-term records are key (World Meteorological Organization, Citation2017). Thus, archival newspaper articles could be a useful source of data on the seasonality of influenza as its clear seasonal pattern, identifying influenza can be as simple as searching for seasonal influenza-like illness in historical records (Monto, Citation2008). As this study explores the broader patterns of influenza seasonality, symptomatic diagnosis is sufficient to find influenza infection patterns (Monto, Citation2008). Moreover, even in hospital settings symptomatic diagnosis is more common than positive laboratory testing of influenza patients.
Methods
Study region
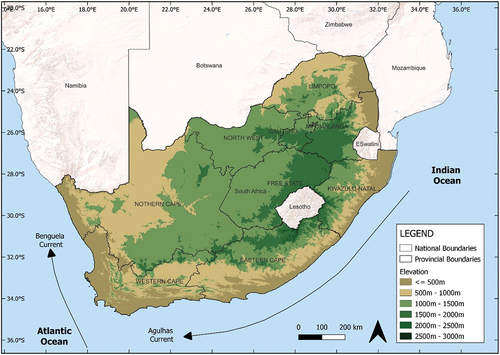
This study focusses on South Africa, which lies between 22–35°S and 16–33°E and is divided into nine provinces (). It is located at the southern tip of Africa, and it spans the subtropical easterlies and the temperate westerlies (Lennard, Citation2019). South Africa receives an average of 500 mm of rainfall annually (Botai et al., Citation2018). The cold Benguela Current of the South-eastern Atlantic Ocean significantly influences the dry western coast and the warm Agulhas Current of the southwest Indian Ocean induces the more tropical east coast (Jury, Citation2013). The country can be classified into three rainfall zones: the summer-, winter-, and year-round-rainfall zones (Roffe et al., Citation2019). The summer-rainfall zone includes most of the central and eastern parts of the nation. The year-round-rainfall zone is mainly along the Southern coast and the winter rainfall zone falls along the west coast and Cape of Good Hope region (Roffe et al., Citation2019). In addition to the ocean currents, topography plays a major role in rainfall as the Great Escarpment that rises to the inland plateau blocks most winter rainfall from reaching the inland areas (Lennard, Citation2019). In addition to this, the South African climate is influenced by the El Niño-Southern Oscillation (ENSO), the Indian Ocean Dipole (IOD) and the Southern Annular Mode (SAM) which all influence the length of different seasons and moisture availability (Gaughan et al., Citation2016; Gillett et al., Citation2006). As a result of the higher altitude of the interior plateau, South Africa has lower than average temperature than similarly located countries by latitude (South African Government, Citation2023). The mean annual temperature across the country is 16.5℃ (Roffe & van der Walt, Citation2023). Average temperatures range between about 12–30℃ in summer and from −2 to 26 ℃ in winter (Roffe & van der Walt, Citation2023).
Figure 1. Map of South Africa and neighbouring countries, showing elevation.
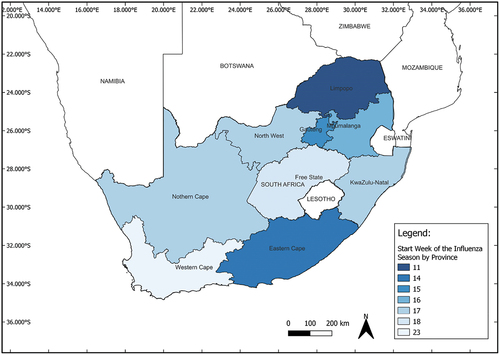
South Africa is facing an increase in non-communicable and chronic diseases including cancer, diabetes, and heart disease (Mayosi et al., Citation2009). The people most affected by these issues are very rural communities and the urban poor (Mayosi et al., Citation2009). In addition to non-communicable diseases, South Africa is experiencing pressure from communicable diseases including HIV/AIDS and tuberculosis (Pillay van Wyk et al., Citation2016). Lower respiratory disease, including pneumonia, was responsible for 5% of all deaths in South Africa between 1997 and 2009 (Pillay van Wyk et al., Citation2016). Since influenza is more dangerous to people with pre-existing health conditions, these all play into the vulnerability to influenza in South Africa. Sub-Saharan Africa has some of the highest rates of influenza mortality in the world (Cohen et al., Citation2021). The contemporary influenza season has been described by South African province (; Motlogeloa et al., Citation2023). This study found that the northeastern provinces of South Africa tend to start and end the influenza season earlier than the southeastern provinces (Motlogeloa et al., Citation2023).
Figure 2. Map of South African provinces and the average start week of the influenza season between 2008–2019 (data from Motlogeloa et al., Citation2023).
Data collection
The primary data were collected from newspapers archived digitally on the online platform, Readex, for the period 1904–2019. Several global and local newspapers are stored on this repository; this study focuses on news articles published in the South African Rand Daily Mail (published from 1902 until its closure in 1985) and the Business Day (published from 1985 until the present), together these newspapers span the entire study period with no overlap. Both newspapers published daily editions and had headquarters in Johannesburg, while reporting on a national scale. The first digitized records from the Rand Daily Mail are from 1902; however, there are no mentions of influenza until 1904, which is thus the start of the study period. The end of the study period is 2019, in the interests of consistency with the output of contemporary influenza studies and to avoid confusion with reporting on COVID-19 from the 2020 pandemic (Motlogeloa et al., Citation2023). Due to COVID-19 prevention measures, including masks and social distancing, which prevented transmission of a wide group of contagious acute upper respiratory diseases, no seasonal trends of influenza can be detected for the year 2020 (Jones, Citation2020).
The data collection was conducted through use of the search function on Readex, using the keywords of ‘influenza’ and ‘flu’, followed by the manual screening, reading, and coding of each article. Only the keyword ‘influenza’ was used for the Rand Daily Mail, but both ‘flu’ and ‘influenza’ were used for the Business Day. From these three searches a total of 10,477 results were returned. Each of the resultant articles were manually screened to determine whether they were reporting on current cases of influenza () to determine inclusion into the database. Many results were excluded due to being advertisements for remedies which purported to treat, often amongst other conditions, influenza.
Table 1. Exclusion and inclusion criteria for the database.
The two search terms were used in working through the digitized newspaper results on Readex. Searching in the Rand Daily Mail (1903–1985) for ‘flu’ yielded 14,382 results, but these included several words which incorporate the consecutive letters of ‘f’, ‘l’, and ‘u’, such as ‘flux’, and unrelated three letter words such as ‘the’ or ‘his’ in more poorly preserved or ineffectively digitized newspaper reports. Therefore, ‘influenza’ was used exclusively for searches in the Rand Daily Mail. The falsely flagged words in the early part of the study period also align with the colloquial use of ‘flu’ which only began to be widely used in newspaper reports after the Spanish Influenza pandemic in 1918–1919. However, even after this, ‘influenza’ was still more widely used until the 1970s and only became dominant in the 1990s. This is clearly shown in the two sections of the study period, where between 1904 and 1985, 9,175 newspaper results were returned for the search term ‘influenza’ (), whereas between 1996 and 2019, only 244 results use the word ‘influenza’. Therefore, for searches in Business Day both terms were used with 244 results for ‘influenza’ and 1,058 results for ‘flu’. A total of 1,440 current cases of influenza were collected in the database from both newspapers. A flow chart following the numbers of results for each keyword search and how many applicable results were found was created (). There are no significant synonyms for influenza that could have been used throughout the study period.
Figure 3. Flow chart of the search results, and the inclusion and exclusion filtering.
There is also a ten-year gap in newspaper reports on influenza between 1986 and 1996. The Rand Daily Mail closed in April of 1985 and the Business Day became operational in May of that same year. For the first decade of the Business Day reporting there are no results for searches with the keywords ‘influenza’ or ‘flu’. The decade long gap does not signify a gap in newspaper reports, simply a gap on reporting on influenza.
All the newspaper reports that were deemed suitable after screening were captured in a Microsoft Excel database. The manual screening included the investigation of all the 10,477 Readex results, from which 9,037 articles and advertisements were excluded. The final database contained 1,440 newspaper articles, and for each included the date of the newspaper article, any date corrections where reporting may be of cases of influenza in days or weeks prior, the location discussed, and any quotes where newspaper articles made claims regarding the role of the weather in driving the influenza season. Date corrections were included if they gave a very recent time frame, while date corrections to a childhood influenza attack, for example, were excluded. Determining date corrections was relatively easy as most reports in the newspapers started with a location and date such as ‘Capetown, Tuesday’ (, Example C). These dates generally fell into the week prior to the newspaper being published and essentially account for lag time, meaning that no lag time was calculated into the data analysis.
Figure 4. Examples of quotes from newspaper reports on influenza from the rand daily mail. a) sports reporting from 16 June 1954, b) personal advertisements from 11 May 1917, c) political reporting from 24 July 1907 and d) Spanish influenza reporting from late 1918.
Data analysis
The data collected from the Rand Daily Mail and the Business Day were classified and totalled by week of the year (weeks 1–52, starting in January) for consistency with the classification of contemporary studies (Motlogeloa et al., Citation2023). Both newspapers were published daily. The articles included in the database were classified by week of the year with each week starting on a Sunday. The number of cases per week, and per year, were plotted, with colour coding relating to the raw number of cases reported per week (Motlogeloa et al., Citation2023). None of the data that met the inclusion criteria were excluded from the record. Diagrams showing the number of newspaper reports for each week of the year as well as number of newspaper reports per year of the study period were created following the approach of other historical geography studies (Motlogeloa et al., Citation2023; Snyman & Fitchett, Citation2022). These charts were used to determine temporal trends within the data. Where location was mentioned, spatial trends were also examined in more detail.
The mean weekly frequency of newspaper reports was calculated to estimate the length of the influenza season and its start weeks for each year of the study period. Influenza seasonality is often classified by using thresholds to map the beginning and end of the season (Motlogeloa et al., Citation2023). Commonly used thresholds, including the United States Centers for Disease Control and Prevention (CDC) threshold of the first and last recorded case (CDC, Citation2022), the European 5% threshold (Vega et al., Citation2015), and the South African national 17% threshold (Motlogeloa et al., Citation2023), were tested on the database to determine if these returned an average 19-week influenza season. If a 19-week season was not returned, a further set of thresholds were tested sequentially to optimize for the NICD defined influenza season (NICD, Citation2019).
The qualitative component of this research explored commentary on the link between climate and influenza in news reports using thematic analysis (Javadi & Zarea, Citation2016; Jnanathapaswi, Citation2021). First, all the newspaper articles were read for taking initial notes, then these were used to generate the initial themes or codes. These were reviewed after all the newspaper reports had been allocated to a theme or code. Illustrative quotes from each theme were retained for the results chapter. The dates of these quotes were explored, to identify any changes in perception through time.
Results
The newspaper reports compiled in the database spanned many sections of the newspaper. The largest proportion of influenza reporting throughout the study period were from the sports section of the newspaper, yielding 29% (n = 1,440) of all reports. The first mention of influenza in a sports section was in 1904 and the most recent was in 2019, spanning the entire study period. Most sports reports mention that a sportsman is ill with influenza and cannot compete in a sporting event and were thus included in the database as current cases of influenza (). Between 1904 and the 1950s, another prominent section for influenza reporting is the personals section of the Rand Daily Mail. In most cases this was used as a way for people to let friends and family know that they were ill and unable to attend functions or engagements. Within the database, there are 161 personal advertisements announcing influenza cases, amounting to 11% (n = 1,440) of all newspaper reports. General political news is also a source for influenza reports. This reporting was usually a small headline and single paragraph speaking about a specific political figure being ill and was distinctly different from the personals section reporting. Within the database, 78 reports (5%, n = 1,440) were about prominent politicians or judges being ill and unable to attend to parliament or court. Many of these reports mention ministers (32) and judges (15), while Jan Smuts specifically is named in eight unique articles. A more official source for reporting on current cases on influenza are the Health of the Union Reports that started during the 1918 Spanish Influenza Pandemic. These were government reports published as news articles in the Rand Daily Mail that spoke in general about different issues facing the union. There were 16 Health of the Union Reports throughout the two-year period of the Spanish Influenza, amounting to only 1% (n = 1,440) of the total influenza reporting. There was also more general reporting on influenza such as hospitals being overwhelmed by influenza patients, which happened at least once a decade. Other sources of influenza reporting are court records, obituaries, cartoon columns, theatre columns, and business reporting. While sports, personals, political news, and Health of the Union reports combined comprise approximately half of the reports, 54% (n = 1,440) of the database is made up of all other sources with no single source making up a majority. Other than global pandemics such as the Spanish Influenza outbreak and the 2009–2010 Swine Influenza outbreak, there is not much dedicated influenza reporting.
There are several temporal patterns in newspaper reporting on influenza across the study period (). The first peak in newspaper reporting is between 1918 and 1920, which corresponds with the Spanish Influenza Pandemic. During the peak of the Spanish Influenza pandemic in 1919, up to 30 reports and articles were published in the Rand Daily Mail, reporting on cases of influenza across different parts of the country or on notable people who have caught the influenza virus. One report mentioned Spanish Influenza as the ‘fashionable virus’. Like the COVID-19 pandemic, reporting started slowly and spoke simply of influenza outbreaks and then began reporting on cancelled events including a Halloween Ball held by the New Caledonian Society of Johannesburg. The second major peak of influenza reporting is in 1932 (). This peak does not correspond to any clear or intense influenza season, as there were no global influenza pandemics in the 1930s (CDC, Citation2019). However, in the early 1930s, there was an increased interest in the influenza virus as scientists first isolated the Influenza A virus and began working on a vaccine (Berche, Citation2022). The next distinct peak occurs in the late 1950s which corresponds to the 1957–1958 Hong Kong or Asian Influenza pandemic (; Gatherer, Citation2009). According to the CDC, this global pandemic caused between one and two million deaths (CDC, Citation2001b). After this the reporting remains relatively stable with a small peak in 1984, with this influenza season being linked to a high rate of pneumonia cases among influenza patients (; CDC, Citation2001a). The next peak comes after the beginning of the Business Day reporting on influenza in 1996 (). This global influenza season is linked to a mix of Influenza A and B (CDC, Citation2023). Reporting over the next decade is consistently declining until a small peak in 2009 (). This aligns with the global Swine Influenza pandemic (Gatherer, Citation2009). While the peak in reporting is small, this is mainly because most reporting on Swine Influenza did not meet the inclusion criteria for this study as it spoke about other countries, or influenza in different animals.
Figure 5. Total number of newspaper reports per year of the study period.
Historical variability in the timing of the influenza season
With over a century of influenza commentary from the newspaper reports, a clear seasonal pattern emerges. The total reports per week of the year over the entire study period were calculated and plotted, totalling each time a report was made in a specific week of the year (). There is a clear peak in the winter months from June to August. The first part of the year has a relatively stable rate of reporting until week 17, when reporting picks up and peaks in week 29 and then gradually declines again with a small peak in week 51 of the year. Week 29 has the highest total number of newspaper reports from the whole study period with 62 total reports. This means that out of the 116 years of the study period, 71% of the years reported influenza in week 29 of the year. Week 29 corresponds roughly with the dates of 15 to 25 July This means that, on average, across the past century, South Africa has experienced a clear influenza season peaking in the second half of July. Week 1 has the lowest total number of reports with only eight over the whole study period.
Figure 6. Total number of newspaper reports by week of the year over the study period.
The seasonal fluctuation of the influenza season is well documented where the ‘annual visitation’ of influenza was reported on regularly. Quantifying the specific timing of the onset and cessation of the influenza season is generally determined by a threshold number of influenza cases that marks the beginning and end of the season (Motlogeloa et al., Citation2023). The US CDC threshold classifies the influenza season as starting at the first positive case of influenza (CDC, Citation2019). Applying this CDC threshold to the database of newspaper reports yielded an average 33-week influenza season; the maximum length of the influenza season with this threshold was 51 weeks, in 1916, 1919, 1932, 1940 and 1954. A minimum season length is not a useful measure with this dataset as 1906 has no reports and thus, seemingly no influenza season. The years 1985 and 2002 both have only a single report for the whole year and thus have a single week season no matter which threshold is applied. It is possible that there were cases of influenza that were simply not reported on in these seasons. The year 1985 coincides with the switch from the Rand Daily Mail (which closed in April of 1985) to Business Day reporting (which was opened in May of 1985), which is likely the main reason for only having one report. The year 2002 had several reports on influenza cases overseas; however, there was only one newspaper report in 2002 that met the inclusion criteria for this study. Another widely used threshold is the European 5% threshold (Vega et al., Citation2015). This threshold yielded an average 30-week influenza season and is thus not a meaningful threshold for this dataset either. Again, the maximum season for this threshold was 51 weeks in the years 1916, 1919, 1932, 1940 and 1954. The South African national threshold of 17% calculated from Discovery Health Medical Scheme data and Baragwanath Hospital case data (Motlogeloa et al., Citation2023) was then applied and yielded a 21-week influenza season, which is closer to the NICD-defined 19-week season. This threshold yielded the same minimum seasons in 1906, 1985 and 2002. The maximum season differed from the above, with 1923 yielding a 48-week season and 1961 yielding 46 weeks.
A range of subsequent thresholds were applied to this dataset following the work of Motlogeloa et al. (Citation2023) to find a threshold that would yield a 19-week influenza season as defined by the NICD (Citation2019). A 19% threshold yielded a 20-week influenza season. A 20% threshold yielded an 18-week season, and 21% threshold also yielded 18 weeks. Therefore, 20% was used for this dataset (). The 20% threshold yielded the same minimum seasons as above in 1906, 1985 and 2002. The longest seasons were in 1923 and 1961, yielding 48 and 46 weeks, respectively (). On average, this 20% threshold returns a mean start week for the influenza season as week 18 and the average last week of the season as week 35. Therefore, over the past century the average South African influenza season has fallen between the first week of May and the last week of August. There is no obvious progressive shift in the timing over the century as this annual seasonality has stayed relatively stable over the study period. There is, however, considerable interannual variability in the timing of the influenza season; however, this does not seem to link to broader climatic patterns. Based the historical occurrence of ENSO over the past century (Gergis & Fowler, Citation2009), there seems to be no link between longer and shorter influenza seasons and the ENSO phases. The longer season in 1916 and 1923 overlap with La Niña years while longer seasons in 1919 and 1940 correspond with El Niño years and longer seasons in 1932, 1954 and 1961 fall in between distinct ENSO phases (Gergis & Fowler, Citation2009). There are also two sets of later seasons in 1943–1944 and 1961–1962 where the influenza season ends in the final two weeks of the year (). Both of the seasons that start later in the year fall in between ENSO phases and thus correspond with neither (Gergis & Fowler, Citation2009).
Figure 7. The annual influenza season applying a 20% seasonal threshold.
Commentary on the link between climate and influenza
Throughout the dataset, 37 (2.5% of the 1440) newspaper reports mention weather or climatic conditions that are perceived, by the authors of those reports, to be linked to influenza cases. The earliest mention of influenza and climate appeared in 1904. The Rand Daily Mail reports contained most of the mentions of climate while Business Day had only two mentions in the 1990s, with no mentions of weather in the last two decades of the study (). There were nine mentions of weather in the 1910s, followed by the 1920s and 1940s with six mentions each ().
Figure 8. Types of weather and climatic conditions mentioned in influenza reporting.
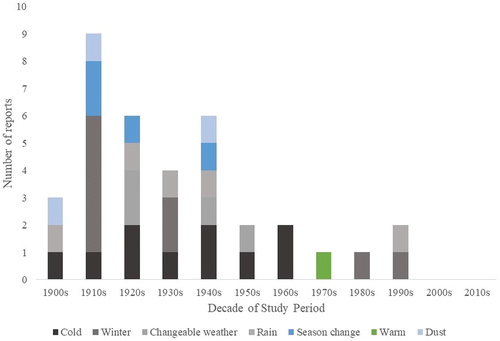
The meteorological factors associated with influenza in the news reports vary considerably, from cold or cold snaps to warm weather. Cold weather and cold snaps were the most mentioned reasons for cases of influenza with 11 newspaper articles linking increased influenza transmission with cold (). Associated winter conditions and winter weather were the second most mentioned, appearing in nine of the newspaper articles on influenza. These were different from articles about the cold as they did not mention cold weather specifically but rather spoke to the winter seasonality of influenza (). Mentions of the bad winter weather in the Cape were found throughout the study period.
Figure 9. Examples of reporting on different weather conditions. a) cold snap from 1 July 1919 b) warm winter conditions from 21 July 1948 c) dust as a cause of influenza on 1 July 1919 and d) rain as a cause of influenza cases 3 June 1925.
Dust, although not inherently a climatic phenomenon, but often representative of dry and windy conditions, was mentioned three times as part of the cause and an exacerbating factor in influenza cases across the study period (). It was mentioned in 1909, 1910 and 1947. Dust was mentioned in all three occasions as being linked to winter or cold weather ().
Rain was mentioned five times (). The reports of rain as an exacerbating factor in influenza transmission does not show a clear seasonal trend with two mentions in June, and one each in February, April, and December.
Discussion
Climate and the timing of influenza in South Africa
The average timing of the South African influenza season, as reconstructed from newspaper reports spanning the past century, has been between week 18 and week 35 of the year with an average of 19 weeks as proposed by the NICD (Citation2019). Of the century of newspaper reports collected, only seven years indicate an influenza season of exactly 19 weeks when applying the standard threshold of 20%, namely, 1909, 1915, 1917, 1957, 1979, 1984, and 2004. This outcome is comparable to the findings of other contemporary studies, where the average influenza season starts in week 16 and ends in week 35 of the year (Motlogeloa et al., Citation2023). Therefore, the South African influenza season falls somewhere between the beginning of May and the end of August, however, it is unlikely to be exactly 19 weeks in length every year.
The timing of May to August falls mainly in the South African winter (Van der Walt & Fitchett, Citation2020). This aligns with the winter seasonality of influenza globally (Fuhrmann, Citation2010; Moa et al., Citation2019; Neumann & Kawaoka, Citation2022). On average across the world, the influenza season is 16 weeks (Azziz Baumgartner et al., Citation2012), which differs from the South African 19-week season by three weeks (NICD, Citation2019). This is potentially because South Africa falls within both temperate and subtropical climate regimes (Roffe et al., Citation2019), which both display the clearest influenza seasonality (Moa et al., Citation2019).
Drier air and colder temperatures are more conducive to the transmission of the influenza virus (Fuhrmann, Citation2010; Moa et al., Citation2019). Air that has a relative humidity of less than 20% can suspend influenza respiratory droplets for up to 24 hours (Fuhrmann, Citation2010). An air temperature of 5°C also yielded the highest transmission rates for influenza in laboratory tests of guinea pigs (Lowen et al., Citation2014). Moreover, asymptomatic infections can become clinical if exposed to cold air after infection (Eccles, Citation2002; Fuhrmann, Citation2010). Therefore, with most of South Africa experiencing dry winters (Roffe et al., Citation2022), the meteorological conditions for heightened transmission of influenza are all present. The smaller proportion of the country influenced by winter- and year-round-rainfall (Roffe et al., Citation2019), highlight the importance of exploring the timing of the influenza season at a more local scale (Motlogeloa et al., Citation2023).
Historical geographical research using archival newspapers has found advances in the timing of seasonal phenological and biological events including Jacaranda tree flowering (Fitchett & Raik, Citation2021) and the migration timing of brown-veined white butterflies in Johannesburg (Fitchett et al., Citation2022). This leads to the hypothesis that the influenza season may also have shifted over the past century. However, over the past century in South Africa, the influenza season has high interannual variability with no detected unimodal shift in the timing of its onset or cessation. The lack of a distinct shift in the timing of the influenza season may be in part due to the complex nature of influenza transmission, dependent on both climatic and social factors (Fuhrmann, Citation2010; Lowen et al., Citation2014; Moa et al., 201). Moreover, climate change is expected to influence a range of meteorological variables from precipitation to temperature at different rates across the world (Lee et al., Citation2023). For example, Southern Africa is projected to become hotter, receive an increase in heavy rainfall events while getting progressively drier and experiencing more droughts (Lee et al., Citation2023). A study in the United States found that warmer winters tend to exacerbate the influenza season the following year as people have lower immunity due to the previous mild influenza season (Towers et al., Citation2013). This may mean that anthropogenic climate change and the warming of Southern Africa could induce more severe and longer influenza seasons after milder winters.
A global study that included South Africa in its Southern Hemisphere calculations found that influenza epidemics were more severe in El Niño periods and less during La Niña years (Oluwole, Citation2015). We find no direct link between longer or shorter influenza seasons and El Niño. An example of this is that the longer influenza seasons falling in the years 1916 and 1923 (La Niña years), 1919 and 1940 (El Niño years), 1954 and 1961 (mean ENSO state). Two studies, one based in California and another in France, both linked colder El Niño cycles with higher mortality rates in influenza patients (Ebi et al., Citation2001; Viboud et al., Citation2004). Therefore, ENSO appears to have less impact on the seasonality of influenza and more impact on the severity of influenza infections in each season. Most studies that have examined seasonal influenza and ENSO have been done in the Northern Hemisphere, none of which have conclusively linked changes in influenza pandemics to ENSO cycles (Shaman & Lipsitch, Citation2013). While the link between ENSO and influenza is more commonly made in the intensity and severity of influenza infections rather than any seasonal shift, this is understudied in the Southern Hemisphere and South Africa (Ebi et al., Citation2001; Oluwole, Citation2015; Viboud et al., Citation2004).
Newspapers as a source of environmental data
It is important when engaging with mass media like newspapers to explore how bias and inaccuracy in reporting can have an impact on the results of a study such as this. News reporters rarely have in-depth medical knowledge and could very well be grouping influenza in with other upper respiratory illnesses. This symptom-based diagnosis of influenza is likely comparable to the Discovery Health Medical Scheme claims data used by Motlogeloa et al. (Citation2023), since most of these claims are for General Practitioner (GP) visits or medication which do not require positive influenza tests but rather diagnose patients by their symptoms. However, when exploring broader patterns of seasonality, the accuracy of every single report is not necessary to show a clear picture of seasonality.
In terms of accuracy of news reporting, influenza is not a taboo topic and thus there would be very little reason for newspapers to supress writing on it as with other more highly politicized topics as discussed by Moore (Citation2010). The likelihood of false positive reporting on influenza is low as there is little to gain by falsely reporting on people being ill with such a common ailment. However, there is a higher chance of false negative reporting specifically on influenza. There is a possibility of underreporting of cases, as there could be weeks without any newspaper reporting during which people have contracted the influenza virus. This is extremely likely as a large daily newspaper is not reporting on every single resident in South Africa and their health. Therefore, it is likely that the archival newspapers missed or did not report on every case of influenza over the study period, but a low likelihood that they falsely reported on people being ill. However, while having more accurate reporting may have strengthened this study, its aim is to more broadly to understand the historical influenza season and thus, the high probability of false negatives is not a key limitation.
Another aspect of using newspapers to gather environmental data is that there is often not a dedicated section of the newspaper for specific health or environmental topics. Additionally, influenza reporting was rarely a front page or even a large headline story within either the Rand Daily Mail or the Business Day. Additionally, influenza is not typically an illness that causes mass mortality. Therefore, concerns about attention grabbing headlines that may present misleading information do not apply to most of the newspaper reports used in this study (Fraser & Fitchett, Citation2022; Mushawemhuka et al., Citation2021). For example, in this study, the highest proportion of reports came from sports reporting. This section of the newspaper was particularly valuable as a source of influenza cases as it had new reports almost daily and reported on current cases of influenza. Moreover, with 29% of all articles coming from sports reporting, 11% coming from personal advertisements, and a further 5% coming from various political reports, there seems to be much less of an environmental based slant than other climate change topics as discussed by Boykoff and Boykoff (Citation2004) and Boykoff (Citation2008). Therefore, the likelihood of misinformation in the interest of grabbing readers’ attention and eliciting an emotional reaction is very low within reporting on influenza specifically.
Conclusion
Using a historical geography approach to explore archival newspapers, this study has found that the average influenza season across South Africa falls in the 19 weeks between the beginning of May and the end of August. However, there is considerable interannual variability in the length and timing of the season, likely because of the interplay between climatic conditions and human interactions. This has implications in terms of healthcare sector preparedness. Additionally, the newspaper reports gave insight into how people have associated influenza and climate phenomena through time. Moreover, it showed that while the epidemiological dynamics were only discovered later, cold, rain and dust were already understood to influence influenza transmission.
Disclosure statement
No potential conflict of interest was reported by the author(s).
References
- Alonso, W. J., Viboud, C., Simonsen, L., Hirano, E. W., Daufenbach, L. Z., & Miller, M. A. (2007). Seasonality of influenza in Brazil: A traveling wave from the Amazon to the subtropics. American Journal of Epidemiology, 165(12), 1434–1442. https://doi.org/10.1093/aje/kwm012
- Azziz Baumgartner, E., Dao, C. N., Nasreen, S., Bhuiyan, M. U., Mah-E-Muneer, S., Mamun, A. A., Sharker, M. A. Y., Zaman, R. U., Cheng, P.-Y., Klimov, A. I., Widdowson, M.-A., Uyeki, T. M., Luby, S. P., Mounts, A., & Bresee, J. (2012). Seasonality, timing, and climate drivers of influenza activity worldwide. The Journal of Infectious Diseases, 206(6), 838–846. https://doi.org/10.1093/infdis/jis467
- Berche, P. (2022). The Spanish flu. La Presse Médicale, 51(3), 104127. https://doi.org/10.1016/j.lpm.2022.104127
- Bingham, A. (2010). The digitization of newspaper archives: Opportunities and challenges for historians. Twentieth Century British History, 21(2), 225–231. https://doi.org/10.1093/tcbh/hwq007
- Botai, C. M., Botai, J. O., & Adeola, A. M. (2018). Spatial distribution of temporal precipitation contrasts in South Africa. South African Journal of Science, 114(7–8), 70–78. https://doi.org/10.17159/sajs.2018/20170391
- Boykoff, M. T. (2008). The cultural politics of climate change discourse in UK tabloids. Political Geography, 27(5), 549–569. https://doi.org/10.1016/j.polgeo.2008.05.002
- Boykoff, M. T., & Boykoff, J. M. (2004). Balance as bias: Global warming and the US prestige press. Global Environmental Change, 14(2), 125–136. https://doi.org/10.1016/j.gloenvcha.2003.10.001
- CDC. (2001a). Influenza- United States, 1984-1985 season. Retrieved July 26, 2023, from https://www.cdc.gov/mmwr/preview/mmwrhtml/00000580.htm#:~:text=Influenza%20type%20A%20(H3N2)%20viruses,of%20total%20deaths)%20since%201976
- CDC. (2001b). Pandemic influenza. https://www.cdc.gov/flu/pandemic-resources/index.htm
- CDC. (2019). Influenza historic timelime. Retrieved August 15, 2019, from https://www.cdc.gov/mmwr/preview/mmwrhtml/00047250.htm
- CDC. (2022). Flu season. Retrieved July 26, 2023, from https://www.cdc.gov/flu/about/season/index.html?CDCAArefVal=https%3A%2F%2Fwww.cdc.gov%2Fflu%2Fabout%2Fseason%2Fflu-season.htm
- CDC. (2023). Pandemic basics. Retrieved July 26, 2023, from https://www.cdc.gov/flu/pandemic-resources/basics/index.html
- Cheval, S., Haliuc, A., Antonescu, B., Tișcovschi, A., Dobre, M., Tătui, F., Dumitrescu, A., Manea, A., Tudorache, G., Irimescu, A., Birsan, M.-V., & Mock, C. (2021). Enriching the historical meteorological information using Romanian language newspaper reports: A database from 1880 to 1900. International Journal of Climatology, 41(S1), E548–E562. https://doi.org/10.1002/joc.6709
- Cohen, C., Kleynhans, J., Moyes, J., McMorrow, M. L., Treurnicht, F. K., Hellferscee, O., Mathunjwa, A., von Gottberg, A., Wolter, N., Martinson, N. A., Kahn, K., Lebina, L., Mothlaoleng, K., Wafawanaka, F., Gómez-Olivé, F. X., Mkhencele, T., Mathee, A., Piketh, S. … Mkhencele, T. (2021). Asymptomatic transmission and high community burden of seasonal influenza in an urban and a rural community in South Africa, 2017–18 (PHIRST): A population cohort study. The Lancet Global Health, 9(6), e863–e874. https://doi.org/10.1016/S2214-109X(21)00141-8
- Ebi, K. L., Exuzides, K. A., Lau, E., Kelsh, M., & Barnston, A. (2001). Association of normal weather periods and El nino events with hospitalization for viral pneumonia in females: California, 1983–1998. American Journal of Public Health, 91(8), 1200–1208. https://doi.org/10.2105/AJPH.91.8.1200
- Eccles, R. (2002). An explanation for the seasonality of acute upper respiratory tract viral infections. Acta oto-laryngologica, 122(2), 183–191. https://doi.org/10.1080/00016480252814207
- Fisman, D. N. (2007). Seasonality of infectious diseases. Annual Review of Public Health, 28(1), 127–143. https://doi.org/10.1146/annurev.publhealth.28.021406.144128
- Fitchett, J. M., Pandazis, A., & Pillay, S. (2022). Advance in the timing of the annual migration of the brown-veined white butterfly through Johannesburg, South Africa, over the period 1914–2020. International Journal of Biometeorology, 66(11), 2251–2258. https://doi.org/10.1007/s00484-022-02353-8
- Fitchett, J. M., & Raik, K. (2021). Phenological advance of blossoming over the past century in one of the world’s largest urban forests, Gauteng city-region, South Africa. Urban Forestry & Urban Greening, 63, 127238. https://doi.org/10.1016/j.ufug.2021.127238
- Fraaij, P. L., & Heikkinen, T. (2011). Seasonal influenza: The burden of disease in children. Vaccine, 29(43), 7524–7528. https://doi.org/10.1016/j.vaccine.2011.08.010
- Fraser, K., & Fitchett, J. M. (2022). Misinformation and instant access: Inconsistent reporting during extreme climatic events, reflecting on tropical cyclone idai. Weather, Climate, and Society, 14(1), 273–286. https://doi.org/10.1175/WCAS-D-21-0085.1
- Fuhrmann, C. (2010). The effects of weather and climate on the seasonality of influenza: What we know and what we need to know. Geography Compass, 4(7), 718–730. https://doi.org/10.1111/j.1749-8198.2010.00343.x
- Gatherer, D. (2009). The 2009 H1N1 influenza outbreak in its historical context. Journal of Clinical Virology, 45(3), 174–178. https://doi.org/10.1016/j.jcv.2009.06.004
- Gaughan, A. E., Staub, C. G., Hoell, A., Weaver, A., & Waylen, P. R. (2016). Inter‐and Intra‐annual precipitation variability and associated relationships to ENSO and the IOD in southern Africa. International Journal of Climatology, 36(4), 1643–1656. https://doi.org/10.1002/joc.4448
- Gergis, J. L., & Fowler, A. M. (2009). A history of ENSO events since AD 1525: Implications for future climate change. Climatic Change, 92(3–4), 343–387. https://doi.org/10.1007/s10584-008-9476-z
- Gillett, N. P., Kell, T. D., & Jones, P. D. (2006). Regional climate impacts of the southern annular mode. Geophysical Research Letters, 33(23). https://doi.org/10.1029/2006GL027721
- Grab, S. W., & Nash, D. J. (2010). Documentary evidence of climate variability during cold seasons in Lesotho, southern Africa, 1833–1900. Climate Dynamics, 34(4), 473–499. https://doi.org/10.1007/s00382-009-0598-4
- Harris, C. (1991). Power, modernity, and historical geography. Annals of the Association of American Geographers, 81(4), 671–683. https://doi.org/10.1111/j.1467-8306.1991.tb01714.x
- Javadi, M., & Zarea, K. (2016). Understanding thematic analysis and its pitfall. Journal of Client Care, 1(1), 33–39. https://doi.org/10.15412/J.JCC.02010107
- Jnanathapaswi, S. G. (2021). Thematic analysis & coding: An overview of the qualitative paradigm. An Introduction to Social Science Research, 1–9. https://doi.org/10.6084/m9.figshare.17159249
- Jones, N. (2020). How COVID-19 is changing the cold and flu season. Nature, 588(7838), 388–390. https://doi.org/10.1038/d41586-020-03519-3
- Jury, M. R. (2013). Climate trends in southern Africa. South African Journal of Science, 109(1), 1–11. https://doi.org/10.1590/sajs.2013/980E
- Kandeel, A., Dawson, P., Labib, M., Said, M., El-Refai, S., El-Gohari, A., Talaat, M., & Viboud, C. (2016). Morbidity, mortality, and seasonality of influenza hospitalizations in Egypt , November 2007-November 2014. PLOS ONE, 11(9), 0161301. https://doi.org/10.1371/journal.pone.0161301
- Kelso, C., & Vogel, C. (2007). The climate of Namaqualand in the nineteenth century. Climatic Change, 83(3), 357–380. https://doi.org/10.1007/s10584-007-9264-1
- Lee, H., Calvin, K., Dasgupta, D., Krinner, G., Mukherji, A., Thorne, P., Trisos, C., Romero, J., Aldunce, P., Barrett, K., & Blanco, G. (2023). Climate change 2023: Synthesis report. Contribution of working groups I, II and III to the sixth assessment report of the intergovernmental panel on climate change.
- Lennard, C. (2019). Multi-scale drivers of the South African weather and climate. In J. Knight & M. Rogerson (Eds.), The geography of South Africa: Contemporary changes and new directions (pp. 81–90). Springer International Publishing.
- Lowen, A. C., Steel, J., & Schultz-Cherry, S. (2014). Roles of humidity and temperature in shaping influenza seasonality. Journal of Virology, 88(14), 7692–7695. https://doi.org/10.1128/JVI.03544-13
- Maphumulo, W. T., & Bhengu, B. R. (2019). Challenges of quality improvement in the healthcare of South Africa post-apartheid: A critical review. Curationis, 42(1), 1–9. https://doi.org/10.4102/curationis.v42i1.1901
- Mayosi, B. M., Flisher, A. J., Lalloo, U. G., Sitas, F., Tollman, S. M., & Bradshaw, D. (2009). The burden of non-communicable diseases in South Africa. Lancet, 374(9693), 934–947. https://doi.org/10.1016/S0140-6736(09)61087-4
- Moa, A. M., Adam, D. C., & MacIntyre, C. R. (2019). Inter‐seasonality of influenza in Australia. Influenza and Other Respiratory Viruses, 13(5), 459–464. https://doi.org/10.1111/irv.12642
- Monto, A. S. (2008). Epidemiology of influenza. Vaccine, 26, 45–48. https://doi.org/10.1016/j.vaccine.2008.07.066
- Moore, F. P. (2010). Tales from the archive: Methodological and ethical issues in historical geography research. Area, 42(3), 262–270. https://doi.org/10.1111/j.1475-4762.2009.00923.x
- Motlogeloa, O., Fitchett, J. M., & Sweijd, N. (2023). Defining the South African acute respiratory infectious disease Season. International Journal of Environmental Research and Public Health, 20(2), 1074. https://doi.org/10.3390/ijerph20021074
- Mushawemhuka, W., Hoogendoorn, G., & Fitchett, J. M. (2021). Implications of misleading news reporting on tourism at the Victoria falls, Zimbabwe. Weather, Climate, and Society, 13(4), 1015–1025. https://doi.org/10.1175/WCAS-D-21-0013.1
- Nash, D. J., & Grab, S. W. (2010). “A sky of brass and burning winds”: Documentary evidence of rainfall variability in the Kingdom of Lesotho, Southern Africa, 1824–1900. Climatic Change, 101(3–4), 617–653. https://doi.org/10.1007/s10584-009-9707-y
- Nash, D. J., Klein, J., Endfield, G. H., Pribyl, K., Adamson, G. C., & Grab, S. W. (2019). Narratives of nineteenth century drought in southern Africa in different historical source types. Climatic Change, 152(3–4), 467–485. https://doi.org/10.1007/s10584-018-2352-6
- Nash, D. J., Pribyl, K., Klein, J., Endfield, G. H., Kniveton, D. R., & Adamson, G. C. (2015). Tropical cyclone activity over Madagascar during the late nineteenth century. International Journal of Climatology, 35(11), 3249–3261. https://doi.org/10.1002/joc.4204
- Neumann, G., & Kawaoka, Y. (2022). Seasonality of influenza and other respiratory viruses. EMBO Molecular Medicine, 14(4), 15352. https://doi.org/10.15252/emmm.202115352
- NICD. (2019). Flu season is around the corner … national institute for communicable diseases. Retrieved July 26, 2023, from https://www.nicd.ac.za/flu-season-is-around-the-corner/
- NICD. (2023). Influenza. National institute for communicable diseases. Retrieved July 26, 2023, from https://www.nicd.ac.za/diseases-a-z-index/influenza/
- Nicholson, B. (2013). The digital turn: Exploring the methodological possibilities of digital newspaper archives. Media History, 19(1), 59–73. https://doi.org/10.1080/13688804.2012.752963
- Oluwole, O. S. A. (2015). Seasonal influenza epidemics and El Ninos. Frontiers in Public Health, 3, 250. https://doi.org/10.3389/fpubh.2015.00250
- Pillay van Wyk, V., Msemburi, W., Laubscher, R., Dorrington, R. E., Groenewald, P., Glass, T., Nojilana, B., Joubert, J. D., Matzopoulos, R., Prinsloo, M., Nannan, N., Gwebushe, N., Vos, T., Somdyala, N., Sithole, N., Neethling, I., Nicol, E., Rossouw, A., & Bradshaw, D. (2016). Mortality trends and differentials in South Africa from 1997 to 2012: Second national burden of disease study. The Lancet Global Health, 4(9), 642–653. https://doi.org/10.1016/S2214-109X(16)30113-9
- Roffe, S. J., Fitchett, J. M., & Curtis, C. J. (2019). Classifying and mapping rainfall seasonality in South Africa: A review. South African Geographical Journal, 101(2), 158–174. https://doi.org/10.1080/03736245.2019.1573151
- Roffe, S. J., Steinkopf, J., & Fitchett, J. M. (2022). South African winter rainfall zone shifts: A comparison of seasonality metrics for Cape Town from 1841–1899 and 1933–2020. Theoretical and Applied Climatology, 147(3–4), 1229–1247. https://doi.org/10.1007/s00704-021-03911-7
- Roffe, S. J., & van der Walt, A. J. (2023). Representation and evaluation of southern Africa’s seasonal mean and extreme temperatures in the ERA5-based reanalysis products. Atmospheric Research, 284, 106591. https://doi.org/10.1016/j.atmosres.2022.106591
- Shaman, J., & Lipsitch, M. (2013). The El Niño–southern oscillation (ENSO)–pandemic influenza connection: Coincident or causal? In Proceedings of the National Academy of Sciences, Washington DC, USA (Vol. 110. pp. 3689–3691).
- Snyman, P. L., & Fitchett, J. M. (2022). Phenological advance in the South African namaqualand daisy first and peak bloom: 1935–2018. International Journal of Biometeorology, 66(4), 699–717. https://doi.org/10.1007/s00484-021-02229-3
- South African Government. (2023). Geography and climate, the South African government. Retrieved July 26, 2023, from https://www.gov.za/about-sa/geography-and-climate
- Tavares, A. O., Barros, J. L., Freire, P., Santos, P. P., Perdiz, L., & Fortunato, A. B. (2021). A coastal flooding database from 1980 to 2018 for the continental Portuguese coastal zone. Applied Geography, 135, 102534. https://doi.org/10.1016/j.apgeog.2021.102534
- Towers, S., Chowell, G., Hameed, R., Jastrebski, M., Khan, M., Meeks, J., Mubayi, A., & Harris, G. (2013). Climate change and influenza: The likelihood of early and severe influenza seasons following warmer than average winters. PLOS ONE, 5. https://doi.org/10.1371/currents.flu.3679b56a3a5313dc7c043fb944c6f138
- Van der Walt, A. J., & Fitchett, J. M. (2020). Statistical classification of South African seasonal divisions on the basis of daily temperature data. South African Journal of Science, 116(9–10), 1–15. https://doi.org/10.17159/sajs.2020/7614
- Vega, T., Lozano, J. E., Meerhoff, T., Snacken, R., Beauté, J., Jorgensen, P., Ortiz de Lejarazu, R., Domegan, L., Mossong, J., Nielsen, J., Born, R., Larrauri, A., & Brown, C. (2015). Influenza surveillance in Europe: Comparing intensity levels calculated using the moving epidemic method. Influenza and Other Respiratory Viruses, 9(5), 234–246. https://doi.org/10.1111/irv.12330
- Viboud, C., Pakdaman, K., Boelle, P. Y., Wilson, M. L., Myers, M. F., Valleron, A. J., & Flahault, A. (2004). Association of influenza epidemics with global climate variability. European Journal of Epidemiology, 19(11), 1055–1059. https://doi.org/10.1007/s10654-004-2450-9
- Vogel, C. H. (1989). A documentary-derived climatic chronology for South Africa, 1820–1900. Climatic Change, 14(3), 291–307. https://doi.org/10.1007/BF00134967
- World Meteorological Organization. (2017). WMO guidelines on the calculation of climate normals (WMO-No. 1203). United Nations.