
ABSTRACT
Introduction. Sphagnum L. forms much of the ground cover in northern peatlands. Different species show affinities for bioclimatic regions in Europe (oceanic/continental; northern/southern) and species-specific tolerance of winter conditions can be a factor explaining their distribution.
Methods. We focussed on low temperature in a series of experiments and tested (1) the innate ability of a selection of Sphagnum species to tolerate low temperature in relation to their micro-topographic (wetness) and geographical (climate) distribution; (2) the rate of cold tolerance acquisition; and (3) the ability of species to survive a range of low temperature once cold hardened.
Key results. Our experiments showed that maximal PSII efficiency (Fv/Fm, chlorophyll fluorescence), growth rates and survival were all negatively affected by sub-zero temperatures. Environmental conditions associated with the onset of winter (colder nights and shorter days) triggered the acquisition of cold tolerance in Sphagnum.
Conclusions. The results were not unequivocal, but species associated with colder climates were generally more tolerant of sub-zero conditions. Species associated with the wettest and driest ends of the wetness gradient were more consistent in their responses than those in between, with wetter-dwelling species being less sensitive to sub-zero temperature than species found in drier microhabitats. Overall, our results suggest that adaptation to winter conditions contribute to the current distribution patterns of Sphagnum species.
Introduction
Sphagnum L. forms much of the ground cover of boreal and temperate mires (Wieder and Vitt Citation2006; Rydin and Jeglum Citation2013). It is a keystone genus, pivotal for the continued presence of many of those ecosystems (Van Breemen Citation1995; Rochefort Citation2000; Rydin and Jeglum Citation2013). Whilst local scale niche partitioning of Sphagnum species is well understood (Rydin and Jeglum Citation2013), the physiological basis of their geographical distribution patterns remains less clear.
There are species distribution patterns associated with latitudinal and oceanic-continental clines within Sphagnum (Daniels and Eddy Citation1990; Gignac and Vitt Citation1990; Gignac et al. Citation1991; Hill and Preston Citation1998; Flatberg Citation2013). As high spore densities are found far from source populations (Sundberg Citation2013), dispersal limitation is unlikely to be the main cause. Furthermore, Kyrkjeeide et al. (Citation2016a, Citation2016b) found evidence for frequent long-distance gene flow, but also detected barriers in the form of wind direction, mountains and oceans. This matches patterns observed in other bryophyte genera where local environmental filtering of regional spore rain dictates the assemblage, rather than the species composition of local sources (Hassel and Söderström Citation2005; Hylander Citation2009). For a landmass without large topographical barriers it is likely that climate is most important in determining the distributions of abundant, fertile Sphagnum species. Dahl and Birks (Citation1998) suggested that the mean temperature of the coldest month and the amount of heat received in summer govern the distribution patterns of plants in Europe. For several plant species there is evidence that low temperature is more likely to limit distribution than high temperature (Woodward Citation1990; Rochefort et al. Citation1994; Vetaas Citation2002; Woodward et al. Citation2004).
Studies on bryophytes have focussed on responses to high temperature (Furness and Grime Citation1982; Gunnarsson et al. Citation2004; Breeuwer et al. Citation2009; Gerdol and Vicentini Citation2011; Haraguchi and Yamada Citation2011), but few studies have examined the effects of low temperature on Sphagnum (Balagurova et al. Citation1996; Buchner and Neuner Citation2010; Segreto et al. Citation2010). Results have been variable, both in comparison with other genera (Segreto et al. Citation2010), and within the genus (Balagurova et al. Citation1996). Comparative studies suggest that Sphagnum is not very cold tolerant (Segreto et al. Citation2010) and that the degree of cold tolerance varies between species and with the history of the plant material studied (Balagurova et al. Citation1996). Such tests have been conducted at very low temperature (−80°C; Segreto et al. Citation2010) or have examined the responses of cells (Balagurova et al. Citation1996) rather than with whole plants at realistic temperatures (including a recovery period). To gain an ecological understanding, it may be of greater interest to determine the effects of freezing before winter, when the plants are still growing, than to consider the potential effects of the temperature of the coldest month of the year (Sakai and Larcher Citation1987; Kawamura and Uemura Citation2014).
Plants survive sub-zero temperatures through mechanisms that reduce the effects of dehydration and mechanical stresses caused by extracellular ice formation (Kawamura and Uemura Citation2014). Bryophytes are more tolerant of extreme temperatures in a dehydrated state (Proctor Citation2008). Although many studies have examined this effect at high temperature, few have quantified it at low temperature. Lenné et al. (Citation2010) showed that Ceratodon purpueus (Hedw.) Brid. is typically desiccated during freezing. However, by increasing the water content from 5% to 30% of plant mass, they found that heat was released (indicative of the phase change of water) at −12°C. Moffett (Citation2015) found that many bryophytes actively promote ice formation on their surfaces, and suggest that such a trait is adaptive for water harvesting. However, inter-cellular ice also has the effect of dehydrating plant cells, promoting freezing point depression, and this may be the mechanism bryophytes use to survive low temperature (Dilks and Proctor Citation1975; Longton Citation1988). In addition, as Sphagnum species are moist and active at the onset of winter, freezing may increase the risk of photoinhibition (Lovelock et al. Citation1995). Sphagnum species are therefore subject to two interacting environmental gradients; temperature and wetness. These gradients vary at both the macro-scale (>103 km) (Dahl and Birks Citation1998) and micro-scale (dm) (Clymo and Hayward Citation1982; Rydin Citation1986; Van der Molen and Wijmstra Citation1994), but there are few studies measuring near-surface winter temperature in mires (Van der Molen and Wijmstra Citation1994).
Our aim was to examine whether differences in simulated winter conditions (low temperature, shorter days, and low light) can explain Sphagnum distribution patterns, with the primary focus on sub-zero temperature. In order to quantify the winter environment, we measured temperature in Sphagnum microhabitats over a year and conducted a series of experiments to test low-temperature responses across several Sphagnum species typical of ombrotrophic mires.
We tested photosynthetic, growth, and survival responses, and rates of acclimation in species with different macro- (southern-northern; oceanic-continental) and micro-distributions (hummock-hollow, i.e. wet and dry habitats, respectively). We tested the following hypotheses: (1) species growing in the hollows will be more tolerant to freezing, as they often freeze when they have a higher water content than species growing toward the tops of the hummocks; (2) species of boreal and continental regions are more tolerant of low temperature than those of temperate and oceanic regions as they are more often exposed to severe freezing.
Materials and methods
Study species and localities
Nine species of Sphagnum were collected from four different mires. The sites were a Sphagnum-dominated fen in Berkshire UK, Wildmoor heath (51°21'N; 0°47'W), and three raised bogs in south-east Sweden, Ryggmossen (60°2'N; 17°19'E), Kulflyten (59°54'N, 15°50'E) and Römossen (60°0'N; 17°21'E). Species were selected to cover the mire micro-topographical gradient (hummock-hollow gradient), and to represent different biogeographic and continental-oceanic affinities ().
Table 1. Summaries of biogeographic element, continental-oceanic affinity (Hill et al. Citation2007) and centre of microtopographic position (Flatberg Citation2013) for Sphagnum species used in the experiments. Which experiment it is used in and the materials origin is also given: Kulflyten (K), Ryggmossen (Ry), Römossen (Rö) and Wildmoor (W).
Temperature variation in the field
We monitored the temperature in the upper moss layer at Ryggmossen and Kulflyten July 2014 to September 2015 (monthly mean temperature 1984–2014 at Kulflyten: January −3.8°C; July 16.7°C; Ryggmossen: January −3.5°C; July 17.0°C; based on 4 × 4 km grid data downloaded from www.luftwebb.smhi.se).
At each site, 22 temperature loggers (Thermochron iButtons SL52 T; Signatrol UK) were inserted 30 mm below the moss surface in patches of pure stands of Sphagnum species representative of the hummock-hollow gradient. These loggers made hourly recordings. For each logger, the mean height above the water table (HWT) was calculated from six recordings taken between June and October.
Experimental responses
We measured the maximum photosynthetic efficiency of photosystem II (PSII), growth and survival to evaluate the effects of the hardening treatment on Sphagnum. PSII efficiency, given by Fv/Fm, was recorded after 20 min of dark adaptation with a Walz MINI-PAM (Walz, Effeltrich, Germany). Dark adaptation was performed 24 h after removal from the hardening treatment, as PSII efficiency may be affected by rapid changes in environment (Murchie and Lawson Citation2013). For bryophytes, Lovelock et al. (Citation1995) showed that such effects disappear after 12 h. Low Fv/Fm values (<0.7–0.8) indicate impairment or down-regulation of PSII.
Average growth rate was calculated as the height increment in mm divided by number of days above 0oC. Survival of a capitulum was scored as either living (1) or dead (0) and was assessed primarily visually (Figure S1). Individuals of uncertain status were pressed with a finger. Large losses of branches and leaves were treated as a sign of death.
Light levels experimental and recovery
In all experiments light levels were ∼180 µmol m−2 s−1 PPFD in the growth chambers (Philips TL5 HO 54W 840 (MASTER); GE Lighting 63613 Halogen Lamps 42W) and ∼150 µmol m−2 s−1 PPFD in the greenhouse (Philips CDM-T MW eco 360W). These levels are high for winter at 60°N but are common during the onset of winter prior to snowfall. Summaries of the hardening and winter treatments used in the experiments are presented in .
Table 2. Summary of the experimental design. Hardening treatments are designed to test different ways in which freezing tolerance can be induced. Winter treatments are different winter conditions.
Experiment 1: unhardened plants
The experiment was designed to test the innate ability of species to withstand a range of temperatures for different durations of time (). S. magellanicum Brid., S. papillosum Lindb. and S. rubellum Wilson were collected on 28th October 2013 from the UK site. The Swedish samples were collected on 4th November when S. balticum (Russow) C.E.O.Jensen, S. cuspidatum Ehrh. ex Hoffm., and S. fuscum (Schimp.) H.Klinggr. were collected from Ryggmossen, and S. lindbergii Schimp. from Römossen. Shoots were kept in an unheated greenhouse during preparation where the top 2.5 cm was taken from 64 shoots of each of the 7 species. These shoots were kept perpendicular to the water table by inserting one shoot from each species into a section of a plastic plug tray. These were kept in a greenhouse at 20°C for one week in de-ionised water, so that the shoot tips were held 1 cm above the water table. When the water was liquid for the duration of the experiment, it was maintained at this level. Four trays, each containing four replicate shoots of each species, were put into each of four growth chambers that were maintained at 20, 5, −5 and −10°C, respectively. The chambers had a 12 h light, 12 h dark regime. After 1, 7, 14 and 26 d, a tray was removed from each growth chamber. These trays were then returned to the greenhouse (20°C; 12 h light, 12 h dark).
After 24 h the maximal PSII efficiency (Fv/Fm) was determined for each shoot. Shoots were then grown at the same water level for 62 d and growth was measured. In the case of −10°C and −5°C, the growth increment was divided by 62. For 5°C and 20°C, it was divided by 62 plus the number of days they had been in the chambers (1–26 d).
Experiment 2: acclimation experiment
The second experiment was designed to examine whether, and at what rate, frost tolerance is induced by low night temperature in the nine species (). Five samples of each species were collected from Kulflyten on 30th October 2014. Each contained a large number of shoots collected from a patch of the mire, at least 5 m from a conspecific sample. These were kept in a greenhouse at 20°C with a 12 h light, 12 h dark regime for 1 month. Shoots were cut to a 15 mm length and kept with ample de-ionised water in plastic trays with a layer of filter paper on the base. Trays were then sealed with cling film and placed in a growth chamber with 12 h day and 12 h night at a constant 5°C for two days. An initial reference point was taken for Fv/Fm per species at this point.
To start the hardening treatment, the night temperature was then reduced to −1°C. A shoot from each sample was removed every day (for 30 d) and placed in its own 5 ml Falcon tube, so that it could be treated as an independent experimental unit. All tubes were then placed in a growth chamber, where they were frozen to −5°C with no light for 48 h. After freezing, each shoot was placed in a Petri dish with ample water and kept at 20°C for 24 h, after which Fv/Fm was assessed.
Experiments 3–5: winter conditions experiments
Experiments 3–5 underwent shared hardening treatments that were designed to test whether variation in day length and night temperature can induce tolerance to winter conditions. Winter treatments were as follows (): Experiment 3 covered freezing to different temperatures, Experiment 4 included testing the simultaneous effect of freezing and submergence, and in Experiment 5 the shoots were kept in the dark at 0°C (to simulate winter under snow).
Six species were used in these experiments (). Five bulk samples were collected (at least 10 m apart) of each species at Kulflyten on 10th July 2015. These samples were kept in a common garden with ample water for one week prior to the beginning of the experiment.
The capitula (top 20 mm of shoot) were cut from 96 shoots of each species. A capitulum from each species was placed in a Petri dish with filter paper and the dish was filled to ∼1 mm depth with de-ionised water. Each Petri dish represented an experimental unit assigned to one of the full factorial hardening treatments of day length (6 or 12 h) and night temperature (−1°C or 5°C), set up in four growth chambers. After 30 d, 20 experimental units were assigned to one of six freezing treatments: 48 h at 5, −5, −10 or −18°C (Experiment 3), 48 h at −5°C with additional water filling the Petri dish (submerged: Experiment 4), and 1 month at 0°C (Experiment 5). All treatments were in the dark.
The responses measured for each shoot were Fv/Fm, growth rate and survival. Fv/Fm was measured for a subset of five capitula from each treatment combination. The samples were kept in a greenhouse with the temperature maintained at 20°C for 28 d (12 h light). Survival was assessed after 1, 7, 14, 21 and 28 d. Growth was assessed by measuring all stems 28 d after removal from the winter treatment. As Sphagnum growth effectively stops at 5°C (Gerdol et al. Citation1998), the environment after the winter treatment determines growth.
Data analysis
All data analyses were performed in R ver. 3.4.3 (R Development Core Team Citation2017). Field temperature measurements were analysed with mixed effects models (lme4 package) using site and month as fixed factors and the mean height above water table as a fixed continuous variable. The logger was included as a random effect. Response variables were the daily maximum and the daily minimum temperatures. Model reduction was carried out to more easily pinpoint when extreme temperature occurred at the different sites and height above the water table, respectively.
For Experiments 1, 3, 4 and 5, the parameter Fv/Fm and growth rate responses were modelled using linear models with species and all treatments as factors. To facilitate interpretation of the complex experimental designs, we carried out model reduction from the full model for Experiment 1 and only used pairwise interactions for Experiments 3–5. A generalised linear model with binomial errors was fitted to the survival data from Experiments 3–5. An additional period of time since winter treatment was included as a continuous variable. In this time series analysis, the stem’s prior state (dead, 0 or alive, 1) for each time step was included as a covariate. All pairwise interactions were analysed with an analysis of deviance. We calculated 95% Clopper–Pearson binomial confidence intervals from the proportions of survival of each species in each hardening and winter treatment.
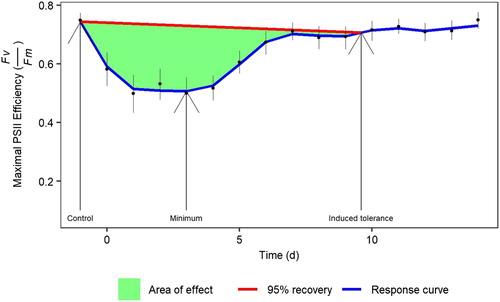
In Experiment 2, locally weighted regression smoothing (LOESS) was used to model each species’ response, which was then parameterised with four variables: the control (initial unfrozen Fv/Fm value), the minimum (day of the minimum Fv/Fm value), induced tolerance (day where the modelled Fv/Fm was equal to 95% of the control value), and ‘area of effect’ (the definite integral of the LOESS line and a line drawn from the control to the return). These are shown graphically in .
Figure 1. Experiment 2: Maximal PSII efficiency (Fv/Fm) during the acquisition of frost tolerance in Sphagnum. Points are means with standard errors of Fv/Fm from the results of all species.
Results
Temperature variation in the field
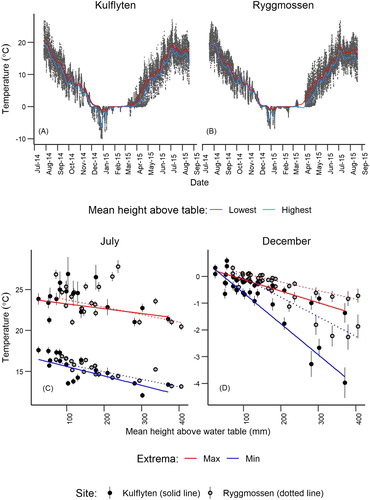
Of the 44 loggers, seven failed or produced obviously anomalous results over the time period and were removed from the analysis. The highest temperature was recorded in July (maximum 31.1°C at Ryggmossen), and the lowest in December (−9.9°C at Kulflyten) ( A, B; Table S1). Winter is characterised at both sites by long periods of ∼0°C, with occasional short periods of extreme cold early in the winter. The lowest minimum (winter) and maximum (summer) temperature were recorded on hummocks ( C, D). Daily minima differed between sites and between months (Site × Month: df = 1, χ2 = 12.65, p < 0.001) and with HWT (Site × HWT: df = 1, χ2 = 12.83, p < 0.001). The maxima differed between the months with HWT (Month × HWT: df = 1, χ2 = 27.82, p < 0.001) (Table S2).
Figure 2. Hourly temperature readings of the loggers at the highest and lowest mean heights above the water table at Kulflyten (A) and Ryggmossen (B). Daily temperature extrema, means and standard errors for July (C) and December (D) at Kulflyten and Ryggmossen per logger.
Experiment 1: unhardened plants
This experiment tested the responses of unhardened plants to low temperature.
Maximal PSII efficiency
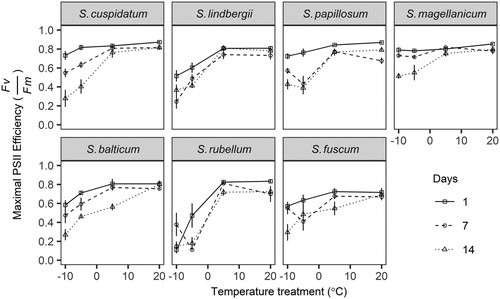
Results after 26 d proved unreliable due to extreme variation in Fv/Fm and were removed from further analysis. The main effects of species, days and temperature were significant, and so were their two- and three-way interactions (Table S3). Values of Fv/Fm for above 0°C (5 and 20°C) did not indicate PSII impairment and did not generally change with the duration of treatment (). All species were negatively affected by sub-zero temperature, with Fv/Fm decreasing with decreasing temperature. Large reductions in Fv/Fm after 1 d can be seen in S. balticum, S. fuscum, S. lindbergii, and S. rubellum, while appreciable reductions in Fv/Fm occurred in S. cuspidatum and S. papillosum after 7 d and S. magellanicum after 14 d.
Figure 3. Experiment 1: Effect of duration and degree of freezing on the maximal PSII efficiency (Fv/Fm) of unhardened shoots of Sphagnum. Points are means with standard errors.
Growth rates
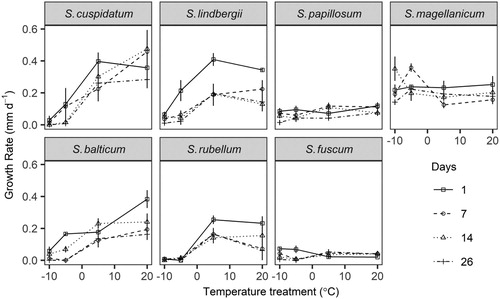
Growth rate was affected negatively by temperature and its duration, but the response was species dependent (species showed significant two- and three-way interactions with days and temperature; Table S3). Growth rates above 0°C depend upon the microtopographic position of the species (). Species that grow close to the water table (e.g. S. cuspidatum) have a higher growth rate than those that grow further away (e.g. S. rubellum, S. fuscum). Growth rates of four species were clearly affected by sub-zero treatments: S. rubellum was the most affected; its mean growth rate was strongly reduced after one day at −5 or −10°C. S. balticum, S. cuspidatum and S. lindbergii all had a significantly lower growth rate after 1 d at −10°C, and after 7 d at −5°C. S. magellanicum had an intermediate growth rate in all treatments and was little affected. The growth rates of S. fuscum and S. papillosum were very low following all temperature treatments.
Figure 4. Experiment 1: Effect of duration and degree of freezing on the growth rate (mm d−1) of unhardened shoots of Sphagnum. Points are means with standard errors.
Experiment 2: acclimation experiment
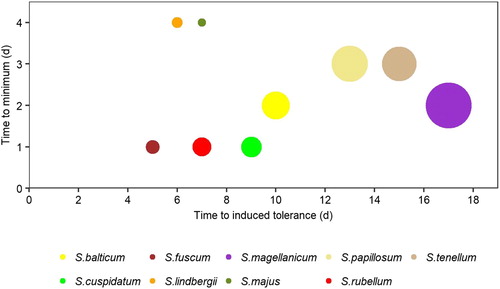
The acclimation response of species varied according to their geographical distribution and wetness gradient niche (). For each niche, boreal species were less affected and/or more rapid in acclimation than temperate species (S. fuscum vs S. rubellum, S. lindbergii and S. majus vs S. cuspidatum, S. balticum vs S. tenellum). Hummock and pool species took less time to acclimatise and were less affected (smaller area of effect) than those of the lawn/carpet. The response of the temperate pool species S. cuspidatum was most similar to the hummock species, separating it from the more boreal pool species S. lindbergii and S. majus. The widespread species S. magellanicum took the longest to acclimate and had the largest area of effect.
Figure 5. Experiment 2: Acquisition of frost tolerance in Sphagnum by low night temperature. Radius of the circle is proportional to the area of effect, which is an integrated measure of effect and time to quantify a samples ability to return to 95% of the pre-treatment Fv/Fm value (cf. ).
Experiment 3: winter temperature experiment
This experiment tested responses (Fv/Fm, growth rate, survival) in six species to four temperature treatments: 5, −5, −10 and −18°C after various pre-winter conditions (long vs short days and night frost vs 5°C).
Maximal PSII efficiency
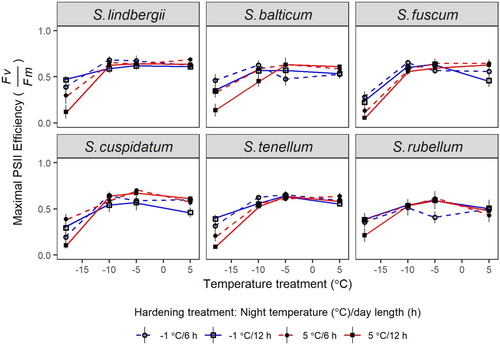
In all species, Fv/Fm was not affected after two days at + 5, −5 and −10°C in material given any hardening treatment (Fv/Fm ≈ 0.6; ). Results were similar across species and hardening treatments after two days However, all species had reduced values of Fv/Fm after freezing at −18°C, and then the values from plants with hardening treatment 12 h/+5°C (least pre-winter like) were consistently lower than other hardening treatments (). There was no interaction of species and hardening treatment (Table S4).
Figure 6. Experiment 3: Effects of hardening and winter treatments on the maximal PSII efficiency (Fv/Fm) in Sphagnum. The hardening treatments were factorial combinations of day length (6 or 12 h) and night temperature (−1 or 5°C). Winter temperature treatments comprised 5, −5, −10 and −18°C. Sphagnum treatment temperatures were maintained for 48 h. Points are means with standard errors.
Growth rates
Growth rates were reduced after freezing, but the effect varied between species (Species × Temperature; F15,1896 = 33.85, p < 0.001). In contrast to Fv/Fm, there was no observable effect of hardening treatments (Table S4, Figure S2). Growth rate after two days at 5°C and −5°C were similar, and were related to micro-topographic position. The fastest growth rates were from the hollow-inhabiting S. cuspidatum, S. balticum and S. lindbergii.
In comparison with the values for 5°C and −5°C, growth rates were reduced at −10°C and −18°C and S. cuspidatum was most affected. After treatment at −10°C the order of growth rate was S. lindbergii > S. cuspidatum > S. rubellum > S. balticum > S. fuscum > S. tenellum. This order was similar after treatment at −18°C except for S. balticum, which then had the lowest growth rate.
Survival
The proportion of surviving capitula differed between species, hardening treatment and winter treatment (Table S5). In we illustrate this for the treatments at 5°C and −18°C (the results for −5°C and −10°C were rather intermediary; see Figure S3). Survival was high after treatment at 5°C for all species after all hardening treatments, though mortality increased in S. fuscum and S. rubellum towards the end of the experiment ().
Figure 7. Experiment 3: Effects of hardening and winter treatments on Sphagnum survival. The hardening treatments were factorial combinations of day length (6 or 12 h) and night temperature (−1 or 5°C). Winter temperature treatments shown are for 5 and −18°C. Individual stems were assessed for death at 1, 7, 14, 21 and 28 d after treatment. Points are the proportion of living shoots, error bars are 95% confidence interval.
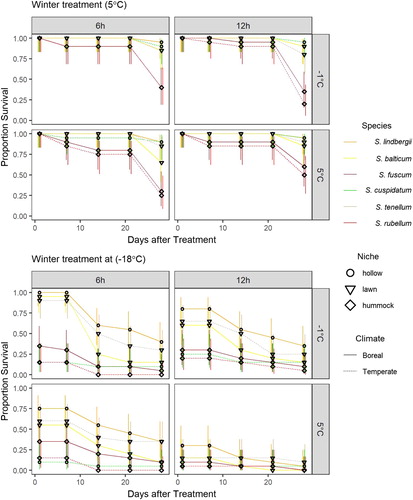
Directly after treatment at −18°C, the hummock species, S. fuscum and S. rubellum, and the temperate pool species S. cuspidatum all had low survival (≤ 35%), and S. lindbergii consistently had the highest survival. All species suffered a dramatic drop in survival after two weeks. (). Survival was lowest after the 12 h/5°C hardening treatment and highest after 6 h/−1°C.
Experiment 4: winter submergence experiment
This experiment tested differences in the Fv/Fm, growth rate and survival of six species that were frozen to −5°C whilst being submerged or non-submerged.
Maximal PSII efficiency
Regardless of species, the submerged capitula had lower Fv/Fm values than non-submerged ones, and there were no differences among species in submerged or in non-submerged plants. There were no interactive effects of species or any of the treatments (Table S6; Figure S4). The hardening treatments had small, but significant effects: a night-time temperature of 5°C led to higher values of Fv/Fm than −1°C, and 12 h day length led to higher values than 6 h (Table S6; Figure S4).
Growth rates
Submergence during freezing increased the growth rate in the hollow species S. cuspidatum, and to a lesser extent in S. balticum and S. lindbergii (Species × Submergence interaction; F5,948 = 2.27, p < 0.001; Table S6). In contrast, the growth rate was very low with submergence having negligible effects in S. tenellum and the hummock species S. rubellum and S. fuscum (Figure S5).
Survival
Hardening treatments and submergence had no impact on survival. Survival was around 85% in all species. It decreased over time at different rates in different species (Species × Days was significant df = 5, χ2 = 35.71, p < 0.001; Table S7).
Experiment 5: length of winter experiment
This experiment tested the effects of long periods in dark conditions at 0°C. Maximal PSII efficiency after the dark period at 0°C varied between 0.4 and 0.6 (data not shown), i.e. in the same range as the non-freezing treatment in the winter temperature experiment () but did not differ among species. The PSII efficiency was higher after long days in the hardening treatments (F5,96 = 10.30, p = 0.002; data not shown). Growth rates were higher in S. cuspidatum (>0.2 mm d-1) than in any other species (< 0.1 mm d−1; F5,456 = 104.3, p < 0.001; data not shown) regardless of hardening treatment.
Discussion
Stresses during winter are complex and include pre-winter hardening and the need to endure combinations of stressors throughout the winter. Our focus has been on the effects of temperature changes at the onset of winter, typically October to November in the northern hemisphere temperate and boreal zones. At lower temperatures, the photo-inhibitory effects of light may occur at lower values of PAR than normally reported for Sphagnum (>300–500 µmol m−2 s−1; Murray et al. Citation1993). Daily light loads in our experiments (180 µmol m−2 s−1, 8–12 h) were relatively high for winter conditions at high latitude (>60°N). Consequently, the negative effects of low temperature on growth and photosynthesis observed in our study are the result of combined damage caused by low temperature and photo-inhibition. Without dark controls we cannot separate these two mechanisms. We discuss our results from the perspective of tolerance to low temperature, whilst acknowledging that low temperature can exacerbate photo-inhibition.
The importance of autumn and winter temperature
Climatic and micro-topographic gradients affect peat surface temperature, both extreme values and long-term averages. Near-surface temperature ranges are a consequence of heat capacity, thermal conductivity and thermal diffusivity, which vary with water content (Van der Molen and Wijmstra Citation1994). At the mire surface this means that hummocks warm quickly but lose heat rapidly. This explains why maximum near-surface temperature readings at Kulflyten and Ryggmossen () were not only similar to moist Sphagnum temperatures recorded previously at Ryggmossen (Rydin Citation1984), but also similar to those recorded at mire surfaces in Ireland (Van der Molen and Wijmstra1994), England (Clymo and Hayward Citation1982) and Siberia (Dyukarev et al. Citation2009). At both sites the highest temperature was recorded in the hollows. It is likely that these occurred during dry summer periods when the hollows lost continuity with the water table, preventing the surface from meeting the evaporative demand, with a resulting rise in temperature. Provided mire surfaces remain wet, temperature at the surface will not exceed those suitable for Sphagnum growth and survival (Rydin Citation1984).
In contrast to the temperature maxima, minima showed variation between sites and micro-topographical position () and are potentially a stronger selection agent for Sphagnum. The distance between the two Swedish sites (∼80 km) is small on a continental scale, yet they show differences in their temperature regime. At both sites the lowest temperature was recorded in December, and the highest in July (). Air temperature in most climatic zones in the northern hemisphere is typically highest during July, but the coldest months are usually January and February (Dahl and Birks Citation1998). As snow insulates the surface (Sonesson Citation1969), most Sphagnum capitula will remain at ∼0°C for much of the winter (Sonesson Citation1969; Granberg et al. Citation1999; Dyukarev et al. Citation2009). The extent of this effect depends on the amount of snow, mid-winter thawing and wind drift (Sonesson Citation1969; Eurola Citation1975). Thus, the lowest temperature that Sphagnum is subjected to appears earlier than expected from air temperature. Freezing in autumn when the plants are physiologically active is more of a risk to Sphagnum than extreme winter temperatures. Subnivean conditions are cold and dark (Bosiö et al. Citation2013), but according to our experiment with a dark period this should present little threat to the survival of Sphagnum.
Hardening and responses to winter conditions in relation to micro- and macro-distribution
Tolerance to freezing involves avoiding the damage caused by extra-cellular ice formation (Kawamura and Uemura Citation2014). Lenné et al. (Citation2010) showed that some desiccation-tolerant bryophytes may avoid the formation of ice by rapid dehydration. They showed that for Ceratodon purpureus increasing water content resulted in internal ice formation, though if there was any damage it was not quantified. We found that high water content in the submergence experiment (Figure S4) had a negative impact on the maximal PSII efficiency. Somewhat contradictory, growth was higher in some species after freezing with submergence than with non-submergence (Figure S5), indicating that the effect of water content on recovery after freezing may be different from its effect during freezing.
Hardening occurred more quickly in hummock and pool species than in those growing in intermediate microhabitats (). Fast acclimation of hummock species to cold temperature () could be an adaptation to the low temperatures these species face during late autumn and early winter. Hollow-dwelling species irregularly dry out during summer (Rydin and Jeglum Citation2013) and are therefore adapted to rapidly acquiring drought tolerance (Hájek and Vicherová Citation2014). Some freezing damage is caused by dehydration of plant tissue (as an effect of extra-cellular ice formation; Sakai and Larcher Citation1987), so it is unsurprising that hollow species can also rapidly acclimate to desiccation caused by winter conditions. In the field, the lawn niche falls between the extremes of winter and summer stress and a slower response to drought or cold may be expected.
We found some support for our hypothesis that species growing in the hollows are more tolerant to freezing than species growing farther away from the water table. Species of the pool and hummock niches gave contrasting results in most experiments. Shoots from pool species typically had a higher Fv/Fm and growth rate after freezing than those of the hummock species ( and ). Survival was typically higher in pool species than in hummock species, when comparing representatives of the same biogeographic region (). The high tissue water content throughout the experiments may have affected the growth and survival of some of the species, since photosynthesis is dependent on CO2 diffusion through the surface film of water (Clymo and Hayward Citation1982; Schipperges and Rydin Citation1998). The high water content could have benefited the pool species when compared with the hummock species. Therefore, growth of the hummock species in the hollows may be limited not only by competition (Rydin Citation1986), but also high water content combined with freezing.
We found stronger support for our second hypothesis, that species from boreal and continental regions are more tolerant of low temperatures than those of temperate and oceanic regions. Within their respective microhabitat, boreal species acclimated more rapidly (; boreal: S. fuscum, S. balticum, S. lindbergii; corresponding temperate: S. rubellum, S. tenellum, S. cuspidatum), and were less affected by freezing than temperate species ().
In the case of S. magellanicum, responses to freezing were inconsistent; it was among the most tolerant when unhardened ( and ) but least tolerant if hardened (). This is somewhat surprising, considering the fact that the unhardened samples of S. magellanicum were from the temperate UK, and the hardened from boreal Sweden. That there is such variety in response both between and within species is interesting in itself. Previous comparative work on Sphagnum (Balagurova et al. Citation1996) showed S. magellanicum to be the least frost tolerant of five tested species. In recent years it has emerged that S. magellanicum comprises two spatially separated and distinct genetic clusters (Kyrkjeeide et al. Citation2016b) with evidence of cryptic speciation (Yousefi et al. Citation2017). It has been suggested that these clusters have separate ecological niches (Schwarzer and Joshi Citation2017), and so we cannot rule out the possibility that the differences in response between the experiments are due to the sampling of two different genetic clusters.
The effect of day length and night temperature on induced frost tolerance
Detection of, and reaction to, variation in day length and night temperature are important for plants to survive cold climates (Sakai and Larcher Citation1987; Li and Glime Citation1991; Steindal et al. Citation2015). Our winter temperature experiment showed that both day length and night temperature before the onset of freezing have an effect on the freezing tolerance in Sphagnum (). Compared with other hardening combinations, short days and low night temperature resulted in fewer deleterious effects on photosynthetic efficiency () and survival () after freezing at −10 or −18°C. Similar to vascular plants at high latitude, Sphagnum can detect and respond to changes in day length and temperature. Seasonal variation in desiccation tolerance in Sphagnum has been observed (Hájek and Vicherová Citation2014) and may be of importance for its tolerance to winter stresses.
Conclusion
We found some, but not unequivocal support for our hypothesis that hollow species are more tolerant to low temperature than hummock species. We also found that species of boreal and continental regions are more tolerant to winter stress, but that the strength of this relationship varies with microhabitat. Within a given biogeographic region, species growing in wetter microhabitats (at the bottom of hollows) responded differently to hummock species. Species in the middle of this gradient were more variable in their responses both between and within species.
Supplemental Material
Download MS Word (2.5 MB)Acknowledgements
We thank Geert Hengsens and Fei Mengei for their laboratory assistance; Douglas Scolfield for analytical advice; Gustaf Granath and Sebastian Sundberg and Sarah Silva for useful comments on the manuscript. Financial support was obtained from the Swedish Research Council (contract 2015–05174 to HR), with additional funds from the Stiftelsen Extensus (to CC).
Notes on contributors
Håkan Rydin is a recently retired professor in plant ecology with research focus on peatlands, including community structure, competition, niche relations, ecophysiology and Sphagnum biology.
Charles Campbell is a doctoral student of plant ecology. His research interests include bryophyte ecology, eco-physiology, community ecology, niche relations and species distribution modelling.
ORCID
Charles Campbell http://orcid.org/0000-0002-4642-4066
Håkan Rydin http://orcid.org/0000-0002-7582-3998
Additional information
Funding
Related Research Data
References
- Balagurova N, Drozdov S, Grabovik S. 1996. Cold and heat resistance of five species of Sphagnum. Annales Botanici Fennici. 33(1):33–37.
- Bosiö J, Johansson M, Njuabe H, Christensen TR. 2013. Increased photosynthesis compensates for shorter growing season in subarctic tundra - seven years of snow accumulation manipulations (Vol. 15). Presented at the EGU General Assembly Conference Abstracts.
- Breeuwer A, Heijmans MMPD, Gleichman M, Robroek BJM, Berendse F. 2009. Response of Sphagnum species mixtures to increased temperature and nitrogen availability. Plant Ecology. 204(1):97–111. doi: 10.1007/s11258-009-9571-x
- Buchner O, Neuner G. 2010. Freezing cytorrhysis and critical temperature thresholds for photosystem II in the peat moss Sphagnum capillifolium. Protoplasma. 243(1–4):63–71. doi: 10.1007/s00709-009-0053-8
- Clymo RS, Hayward PM. 1982. The ecology of Sphagnum. In: Smith AJE, editor. Bryophyte ecology. Springer; p. 229–289.
- Dahl E, Birks J. 1998. The phytogeography of Northern Europe: British Isles, Fennoscandia and adjacent areas. Cambridge: Cambridge University Press.
- Daniels RE, Eddy A. 1990. Handbook of European Sphagna. London: HMSO.
- Dilks TJK, Proctor MCF. 1975. Comparative experiments on temperature responses of bryophytes: assimilation, respiration and freezing damage. Journal of Bryology. 8(3):317–336. doi: 10.1179/jbr.1975.8.3.317
- Dyukarev EA, Golovatskaya EA, Duchkov AD, Kazantsev SA. 2009. Temperature monitoring in Bakchar bog (West Siberia). Russian Geology and Geophysics. 50(6):579–586. doi: 10.1016/j.rgg.2008.08.010
- Eurola S. 1975. Snow and ground frost conditions of some Finnish mire types. Annales Botanici Fennici. 12(1):1–16.
- Flatberg K. 2013. Norges torvmoser. Oslo, Norway: Akademika Forlag.
- Furness SB, Grime JP. 1982. Growth rate and temperature responses in bryophytes: II. A comparative study of species of contrasted ecology. The Journal of Ecology. 70(2):525–536. doi: 10.2307/2259920
- Gerdol R, Bonora A, Marchesini R, Gualandri R, Pancaldi S. 1998. Growth response of Sphagnum capillifolium to night-time temperature and nutrient level: mechanisms and implications for global change. Arctic and Alpine Research. 30(4):388. doi: 10.2307/1552011
- Gerdol R, Vicentini R. 2011. Response to heat stress of populations of two Sphagnum species from alpine bogs at different altitudes. Environmental and Experimental Botany. 74:22–30. doi: 10.1016/j.envexpbot.2011.04.010
- Gignac LD, Vitt DH. 1990. Habitat limitations of Sphagnum along climatic, chemical, and physical gradients in mires of western Canada. The Bryologist. 93(1):7–22. doi: 10.2307/3243541
- Gignac LD, Vitt DH, Zoltai SC, Bayley SE. 1991. Bryophyte response surfaces along climatic, chemical, and physical gradients in peatlands of western Canada. Nova Hedwigia. 53(1–2):27–71.
- Granberg G, Grip H, Löfvenius MO, Sundh I, Svensson BH, Nilsson M. 1999. A simple model for simulation of water content, soil frost, and soil temperatures in boreal mixed mires. Water Resources Research. 35(12):3771–3782. doi: 10.1029/1999WR900216
- Gunnarsson U, Granberg G, Nilsson M. 2004. Growth, production and interspecific competition in Sphagnum: effects of temperature, nitrogen and sulphur treatments on a boreal mire. New Phytologist. 163(2):349–359. doi: 10.1111/j.1469-8137.2004.01108.x
- Hájek T, Vicherová E. 2014. Desiccation tolerance of Sphagnum revisited: a puzzle resolved. Plant Biology. 16(4):765–773. doi: 10.1111/plb.12126
- Haraguchi A, Yamada N. 2011. Temperature dependency of photosynthesis of Sphagnum spp. distributed in the warm-temperate and the cool-temperate mires of Japan. American Journal of Plant Sciences. 2(5):716–725. doi: 10.4236/ajps.2011.25086
- Hassel K, Söderström L. 2005. The expansion of the alien mosses Orthodontium lineare and Campylopus introflexus in Britain and continental Europe. Journal of the Hattori Botanical Laboratory. 97:183–194.
- Hill MO, Preston CD. 1998. The geographical relationships of British and Irish bryophytes. Journal of Bryology. 20(1):127–226. doi: 10.1179/jbr.1998.20.1.127
- Hill MO, Preston CD, Bosanquet SDS, Roy DB. 2007. BRYOATT: attributes of British and Irish mosses, liverworts and hornworts. Huntingdon: Centre for Ecology and Hydrology.
- Hylander K. 2009. No increase in colonization rate of boreal bryophytes close to propagule sources. Ecology. 90(1):160–169. doi: 10.1890/08-0042.1
- Kawamura Y, Uemura M. 2014. Plant low-temperature tolerance and its cellular mechanisms. In: Jenks MA, Hasegawa PM, editors. Plant abiotic stress. 2nd ed. p. 109–132.
- Kyrkjeeide MO, Hassel K, Flatberg KI, Shaw AJ, Brochmann C, Stenøien HK. 2016a. Long-distance dispersal and barriers shape genetic structure of peatmosses (Sphagnum) across the northern hemisphere. Journal of Biogeography. 43(6):1215–1226. doi: 10.1111/jbi.12716
- Kyrkjeeide MO, Hassel K, Flatberg KI, Shaw AJ, Yousefi N, Stenøien HK. 2016b. Spatial genetic structure of the abundant and widespread peatmoss Sphagnum magellanicum Brid. PloS One [online], (11 February 2016) [accessed 2017 March 29]. https://journals.plos.org/plosone/article?id=10.1371/journal.pone.0148447.
- Lenné T, Bryant G, Hocart CH, Huang CX, Ball MC. 2010. Freeze avoidance: a dehydrating moss gathers no ice. Plant, Cell and Environment. 33(10):1731–1741. doi: 10.1111/j.1365-3040.2010.02178.x
- Li Y, Glime JM. 1991. Growth response of two Sphagnum species to photoperiod. Canadian Journal of Botany. 69(12):2643–2646. doi: 10.1139/b91-331
- Longton RE. 1988. Adaptations and strategies of polar bryophytes. Botanical Journal of the Linnean Society. 98(3):253–268. doi: 10.1111/j.1095-8339.1988.tb02429.x
- Lovelock CE, Osmond CB, Seppelt RD. 1995. Photoinhibition in the Antarctic moss Grimmia antarctici Card when exposed to cycles of freezing and thawing. Plant, Cell and Environment. 18(12):1395–1402. doi: 10.1111/j.1365-3040.1995.tb00200.x
- Moffett BF. 2015. Ice nucleation in mosses and liverworts. Lindbergia. 38:14–16. doi: 10.25227/linbg.01035
- Murchie EH, Lawson T. 2013. Chlorophyll fluorescence analysis: a guide to good practice and understanding some new applications. Journal of Experimental Botany. 64(13):3983–3998. doi: 10.1093/jxb/ert208
- Murray KJ, Tenhunen JD, Nowak RS. 1993. Photoinhibition as a control on photosynthesis and production of Sphagnum mosses. Oecologia. 96(2):200–207. doi: 10.1007/BF00317733
- Proctor MCF. 2008. Physiological ecology. In: Goffinet B, Shaw AJ, editors. Bryophyte biology. 2nd ed. Cambridge: Cambridge University Press; p. 237–268.
- R Development Core Team. 2017. R: a language and environment for statistical computing. Vienna, Austria: R Foundation for Statistical Computing. 2016.
- Rochefort L. 2000. Sphagnum: a keystone genus in habitat restoration. The Bryologist. 103(3):503–508. doi: 10.1639/0007-2745(2000)103[0503:SAKGIH]2.0.CO;2
- Rochefort RM, Little RL, Woodward A, Peterson DL. 1994. Changes in sub-alpine tree distribution in western North America: a review of climatic and other causal factors. The Holocene. 4(1):89–100. doi: 10.1177/095968369400400112
- Rydin H. 1984. Some factors affecting temperature in Sphagnum vegetation: an experimental analysis. Cryptogamie, Bryologie, Lichénologie. 5(4):361–372.
- Rydin H. 1986. Competition and niche separation in Sphagnum. Canadian Journal of Botany. 64(8):1817–1824. doi: 10.1139/b86-240
- Rydin H, Jeglum JK. 2013. The biology of peatlands. 2nd ed. Oxford: Oxford University Press.
- Sakai A, Larcher W. 1987. Frost survival of plants. Ecological Studies. 62 Berlin, Heidelberg, New York: Springer. doi: 10.1007/978-3-642-71745-1
- Schipperges B, Rydin H. 1998. Response of photosynthesis of Sphagnum species from contrasting microhabitats to tissue water content and repeated desiccation. New Phytologist. 140(4):677–684. doi: 10.1046/j.1469-8137.1998.00311.x
- Schwarzer C, Joshi J. 2017. Parallel adaptive responses to abiotic but not biotic conditions after cryptic speciation in European peat moss Sphagnum magellanicum Brid. Perspectives in Plant Ecology, Evolution and Systematics. 26:14–27. doi: 10.1016/j.ppees.2017.03.001
- Segreto R, Hassel K, Bardal R, Stenøien HK. 2010. Desiccation tolerance and natural cold acclimation allow cryopreservation of bryophytes without pretreatment or use of cryoprotectants. The Bryologist. 113(4):760–769. doi: 10.1639/0007-2745-113.4.760
- Sonesson M. 1969. Studies on mire vegetation in the Torne träsk area, northern Sweden. II. Winter conditions of the poor mires. Botaniska Notiser. 122:481–511.
- Steindal ALH, Rødven R, Hansen E, Mølmann J. 2015. Effects of photoperiod, growth temperature and cold acclimatisation on glucosinolates, sugars and fatty acids in kale. Food Chemistry. 174(1):44–51. doi: 10.1016/j.foodchem.2014.10.129
- Sundberg S. 2013. Spore rain in relation to regional sources and beyond. Ecography. 36(3):364–373. doi: 10.1111/j.1600-0587.2012.07664.x
- Van Breemen N. 1995. How Sphagnum bogs down other plants. Trends in Ecology and Evolution. 10(7):270–275. doi: 10.1016/0169-5347(95)90007-1
- Van der Molen PC, Wijmstra TA. 1994. The thermal regime of hummock-hollow complexes on Clara bog, Co. Offaly. In: Biology and Environment: Proceedings of the Royal Irish Academy (Vol. 94B).
- Vetaas OR. 2002. Realized and potential climate niches: a comparison of four Rhododendron tree species. Journal of Biogeography. 29(4):545–554. doi: 10.1046/j.1365-2699.2002.00694.x
- Wieder RK, Vitt DH, editors. 2006. Boreal peatland ecosystems. Berlin: Springer.
- Woodward FI. 1990. The impact of low temperatures in controlling the geographical distribution of plants. Philosophical Transactions of the Royal Society B: Biological Sciences. 326(1237):585–593. doi: 10.1098/rstb.1990.0033
- Woodward FI, Lomas MR, Kelly CK. 2004. Global climate and the distribution of plant biomes. Philosophical Transactions of the Royal Society B: Biological Sciences. 359(1450):1465–1476. doi: 10.1098/rstb.2004.1525
- Yousefi N, Hassel K, Flatberg KI, Kemppainen P, Trucchi E, Shaw A, Kyrkjeeide MO, Szövényi P, Stenøien HK. 2017. Divergent evolution and niche differentiation within the common peatmoss Sphagnum magellanicum. American Journal of Botany. 104(7):1060–1072. doi: 10.3732/ajb.1700163