Abstract
The article examines changes in income and activity diversification in Zimbabwe before and after macroeconomic policy changes and the droughts of the early 1990s. Data from two comparable national surveys straddling a period of economic volatility show that the percentage of households earning income from private and informal sources grew considerably, while income from government and formal sources declined. In general, rural households tend to have a more diversified portfolio of income than urban households, and the degree of income diversification decreases with the level of urbanisation. Following the shocks, there was a marked reduction in income diversification, notably among the poor. The findings thus strengthen the need for public provision of well-designed safety nets.
1. Introduction
In the early 1990s, Zimbabweans suffered two major economic shocks. First, there were two droughts in the early 1990s. The 1991/92 drought was one of the most severe in the country's history, and affected all of southern Africa (Scoones et al., Citation1996). The drought of 1994/95 was itself less severe, but coming on the heels of the earlier drought it made conditions worse for the poor and vulnerable. On top of the weather shock, the fiscal austerity and openness to global market forces that followed the implementation of the Economic and Structural Adjustment Programme (ESAP) in 1991 had led to financial volatility and economic downturns for many households (Marquette, Citation1997; Alwang et al., Citation1999). As a result, indicators of wellbeing, both income and non-income, fell dramatically in the 1990s (Alwang et al., Citation2001). The impact of these shocks on the households' own risk management strategies, however, is largely unknown.
A number of studies that have explored risk management strategies in developing countries show that households which anticipate or face conditions of adversity engage in a variety of their own risk management strategies – some which endeavour to reduce risk, and others which are simply coping devices to protect consumption once a shock has taken place (Deaton, Citation1991; Udry, Citation1994, Citation1995; Paxson, Citation1992; Zimmerman & Carter, Citation1996). Such strategies typically involve maintaining a diversified portfolio of livelihood activities and social support capabilities to shelter oneself from, or cope with, shocks. Using time–series rainfall data and the national income, consumption and expenditure surveys (ICES) in 1990/91 and 1995/96, this article examines various income diversification activities to which Zimbabweans resorted, in order to redress the unfavourable impacts of the policy changes and the weather shocks. The study compares income diversification in rural and urban areas by introducing new measures of income diversification suitable for such comparisons.
The article is organised as follows. Section 2 presents a brief survey of pertinent literature on income diversification. Section 3 describes the data and the measures of income diversification. Section 4 describes income-generating activities in the urban and rural areas of Zimbabwe, using the ICES data. Section 5 employs non-parametric regression to analyse the relationship between income diversification and wealth. A multivariate analysis of the determinants of income and activity diversification is in section 6. Finally, section 7 concludes the article.
2. Income diversification as a risk management and coping strategy
In most developing countries, income diversification is one of the most common components of the risk management and coping strategies which are undertaken to sustain a livelihood (Ellis, Citation1998). Several studies show that only a few households derive the bulk of their income from a single source (Reardon, Citation1997; Bryceson, Citation1999; Ellis, Citation1998, Citation2000; Toulmin et al., Citation2000). There are, in fact, several factors responsible for the income diversification observed in developing countries. These may include:
| • | self-insurance against risk in the context of missing insurance markets (e.g. Kinsey et al., Citation1998) | ||||
| • | ex-post coping strategy (e.g. Reardon et al., Citation1992), with extra individuals and extra jobs taken on to mitigate the declines in income | ||||
| • | inability to specialise due to incomplete input markets | ||||
| • | exploitation of strategic complementarities and positive interactions between activities (e.g. Barrett et al., Citation2001). | ||||
Therefore, the motives for income diversification could be due to survival needs as well as a matter of choice and opportunity.
On income diversification, the most relevant studies for Zimbabwe are those by Piesse et al. (Citation1998) and Kinsey et al. (Citation1998). Piesse et al. (Citation1998) found that non-farm income sources increased income inequality in remote areas but decreased income inequality in areas better connected to the large urban market of Harare. They suggested that in rural areas that were less well connected to urban centres, the agrarian power structures allowed those with higher farm incomes to exploit non-farm incomes more effectively; while in areas with better access to urban markets, opportunities for non-farm employment were less dependent on the power structures and therefore tended towards greater equality of income. Kinsey et al. (Citation1998) examined 400 resettled households in rural Zimbabwe over a 13-year period and found that income diversification was a coping strategy used during times of drought, but that the income sources that could be tapped were likely to be low-return activities such as agricultural piecework.
Most previous studies of income diversification have focused on rural areas (see, for instance, Reardon et al., Citation1992; Bryceson, Citation1999; Toulmin et al., Citation2000; Barrett et al., Citation2001; Lanjouw et al., Citation2001). Many such studies find a positive association between non-farm diversification and household welfare. These findings have provided the basis for recommendations to promote off-farm employment in rural areas as a policy tool and have gained widespread support from development agencies, including the World Bank and non-governmental organisations (Delgado & Siamwalla, Citation1999). Urban households, particularly poor households, share some of the same risks that their rural counterparts face, such as varying returns to labour, market failure, droughts and the risk of macroeconomic policy changes. More often than not, the changes in economic, climatic and social circumstances that lead to a reduction in earned income or its variability also increase poverty and vulnerability. As their income sources tend to be unstable, the urban poor are forced to seek strategies for risk management and coping with adversity. Income diversification would probably be one of the options. However, we expect some differences between rural and urban households on how and why they diversify their sources of income as livelihood strategies, opportunities and access to income generating activities are considerably different in urban and rural areas. The development literature on income diversification has concentrated on rural households and has not paid much attention to urban households.
3. Data and measures of income diversification
3.1 Data
We use comparable cross-sectional data from national Income, Consumption and Expenditure Surveys (ICES) in 1990/91 and 1995/96, and a time–series rainfall data (1951–1996). From 113 representative weather stations located throughout Zimbabwe. The Central Statistical Office of Zimbabwe administered the two surveys in 1990/91 and again in 1995/96, employing nearly identical questionnaires. Zimbabwean ICES were based on representative samples comprising both urban and rural sectors of the country. The surveys contained data on socio-demographic characteristics, income from various sources, consumption and other expenditures on a weekly basis, and for some durable and semi-durable items on a monthly or yearly basis. Each selected household was monitored for a complete month, during which household consumption expenditures were recorded in a daily record book. In the 1990/91 round, the survey comprised over 16 000 households, from which close to 14 000 usable observations were recovered after data cleaning. In 1995/96, the survey enumerated 21 000 households in a total of 395 enumeration areas. Following data processing, over 17 000 usable observations were obtained.
The rainfall data used in this study come from time series rainfall information during 1951–1996. Region-specific rainfall variables were created using rainfall data from 113 representative weather stations distributed throughout Zimbabwe. Three basic rainfall variables representing different cropping seasons were used. RP measures the total rain during September–October and covers the planting season; RW measures rainfall during November–January and runs through the weeding and growing season; and RH measures rainfall during February–April and covers the harvest.Footnote2 Transitory rainfall variables are measured as the difference between actual rainfall in region j at time t and mean rainfall in region j.
3.2 Measures of income diversification
Attempts to quantify income diversification, up to now available mainly for rural areas, focus on estimating the share of non-farm income in the total household income portfolio (see, for instance, Block & Webb, Citation2001; Barrett et al., Citation2001; Lanjouw et al., Citation2001). The assumption in these studies is that a higher share of non-farm income amounts to higher diversification and less vulnerability to weather-related shocks, which are the main risk factor in the rural environment, where agriculture is the mainstay of livelihood. However, there are some important difficulties associated with using the share of non-farm income as a measure of income diversification. For instance, the share of non-farm income as the proxy indicator for income diversification gives equal risk–mitigation weight to households that derive a given percentage of non-farm income from one source, and to households that derive the same proportion from three different non-farm sources. Non-farm income shares are difficult to measure, because they require accurate accounting of incomes from farm and non-farm sources. The share of non-farm income in total income, as a measure of income diversification, also has less relevance in urban areas, since most of the urban income are based on non-farm activities.
In order to improve the comparability between urban and rural areas, this article proposes two relatively easy-to-measure diversification indices: the number of income sources (NYS) and the number of income earners (NYE). Using the number of income sources and the number of income earners could be attractive for many reasons. Access to more than one income source will likely reduce income risk emanating from macroeconomic policies that result in job losses as public sector employment shrinks. The number of income sources (NYS) also has several advantages over the share of non-farm income. It is relatively easy to measure, while calculating the non-farm income share involves accounting for actual household incomes from various sources. The number of income sources allows income diversification behaviour in urban areas to be studied, thus facilitating urban–rural comparisons.
The number of income-generating household members is also examined as a possible strategy of livelihood diversification. In any given household it is common to observe more than one household member engaging in income-generating activities for a variety of reasons, including the desire to diversify and manage risk. The number of income earners might depend on the household size and age structure, employment opportunities, and time-allocation decisions within the household on employment and other household activities.
The use of the number of income sources as a measure of diversification may be criticised on many grounds. In particular, it may be argued that the number of income sources is an arbitrary measure of income diversification, in that a different classification of income sources might lead to the enumeration of a different number of income sources. In practice there could be infinite gradations and variations in income sources and in their classification. depicts just one of many possible classifications. Tests of robustness and sensitivity tests were undertaken by comparing the results under alternative income categorisations.Footnote3
Table 1: Percentage distribution of households in different income-generating activities1
4. Income-generating activities in Zimbabwe
Fourteen income sources can be gleaned from the Zimbabwe ICES data, which distinguish three mutually exclusive categories: income from wage employment, income from self-employment and non-labour income. Wage employment income itself is derived from six different sources: employment in private formal, private informal,Footnote4 government, parastatal, agriculture and other sectors. A household could be self-employed in agriculture or in its own business enterprise. Income from self-employment in own business enterprise is taken as one category. For agricultural households, income from farming is subject to a great deal of variability and can be derived from the cultivation of one crop, many different crops, livestock or from a mix of crops and livestock, which may have different implications for diversification. Income from self-employment in agriculture is grouped into five categories which are based on broad commodity groupings: grain crops, industrial crops, fruit and vegetables, livestock, and other agricultural income.Footnote5 Along with property income in the form of rent and interest, and remittances, which together complete the non-labour category, these constitute the fourteen different income sources considered in this article (see ).
This section looks at the various income-generating activities and the level of household participation in those activities. presents the proportion of households receiving incomes from 14 different income-generating activities by location (urban or rural), and disaggregates urban households into residents of Harare, of Bulawayo and of all the other secondary cities.
Before examining how livelihood strategies and income-generating activities have changed in Zimbabwe during the 1990s the differences between rural and urban households, and the differences between secondary cities and the larger metropolitan areas must first be noted. The proportion of households that derive income from wage and salary employment is significantly lower in rural areas than in urban areas, which is not surprising as rural labour markets are poorly developed. Overall, more than half of the Zimbabwe households reported receiving income from remittances and transfers. Receipt of transfers and remittances, in both cash and kind, is more significant in rural areas (see ), while urban households more frequently provide these remittances and transfers. As urbanisation increases, households tend to provide more remittances and transfers in cash, but decreasing amounts in kind. It is plausible that in the urban–rural continuum with its reciprocal linkages, cash resources flow from urban to rural areas while resources in kind take the reverse path.
Table 2: Percentage contributions of different income-generating activities to total income
and indicate a considerable proportion of urban households are engaged in agricultural production, mainly for their own consumption. Nearly half of the urban households are engaged in one or more agricultural activities for their own consumption (about 40 per cent in 1990/91 and 41 per cent in 1995/96). The main agricultural activity pursued by the majority of urban households is growing fruit and vegetables for their own consumption. Many development practitioners have observed the importance of urban agriculture in Africa. Maxwell Citation(1995) documented that in Kampala, the capital of Uganda, urban agriculture provided a subsistence livelihood for a sizeable number of households, particularly for women. This article adds further evidence on the importance of urban agriculture; Zimbabwean urban households find it important to add agricultural activities to their arsenal of livelihood strategies, in their quest for food security. In Zimbabwe, the degree of involvement in urban agriculture falls with urbanisation; nearly half of the households in the secondary cities engaged in agriculture in 1995/96, compared with only about 20 per cent for Harare.
Table 3: Own consumption from agriculture, and remittances in cash and kind
Following the shocks, the proportion of households in major urban areas who engaged in agriculture increased, as did consumption of their own agricultural produce as a proportion of total monthly income (see and ). Following the shocks, participation rates in agricultural activities by Bulawayo households jumped from only 32 per cent in 1990/91 to 42 per cent in 1995/96 (a statistically significant increase). In Harare, participation rates increased from 17 per cent in 1990/91 to 22 per cent in 1995/96. The observed increase in participation in urban agriculture following the shocks is in accordance with the findings of many researchers (such as Egziabher et al., Citation1994; Freeman, Citation1991; Maxwell & Zziwa, 1992) that a common response to economic crisis in African urban areas has been an increased level of household-based agricultural activities within cities.
Important changes in other income sources took place following the shocks. The percentage of households earning income from formal and government employment decreased in urban areas. The greatest reduction was observed in Harare, followed by Bulawayo, and the smallest reduction was in the secondary cities. This is attributable to the high level of retrenchments and the reduction in size, or closing down, of government and parastatal establishments after implementation of the structural adjustment programme (Marquette, Citation1997; CSO, Citation1998a, Citation1998b). The number of households engaged in informal activities significantly increased in both urban and rural areas, with urban households showing higher rates of participation in such activities. Reduction in total per capita consumption expenditures was also higher in urban areas.
presents percentage contributions of different income sources to overall income of the households. The share of income from informal sources grew substantially in the later period. The informal sector became a critical source of income in urban areas and the proportion of urban households engaged in the informal sector increased significantly, from 8 per cent in 1990/91 to about 15 per cent in 1995/96 (see ). The percentage contributions from the public and formal sectors decreased and those of private and informal sectors increased.
The descriptive results in also show a marked reduction in the percentage of households receiving cash remittances and transfers in both urban and rural areas. A similar trend holds for those households receiving transfers and remittances in kind, with the greatest reduction among the rural households. Similarly, in both rural and urban areas the percentage of households providing cash remittances and transfers fell, with the greatest reduction being among Harare households. Also, a smaller proportion of rural households (about 8 per cent) gave remittances and transfers in kind in 1995/96 than in 1990/91, when over 16 per cent of households gave. The flow of remittances in both directions between urban and rural areas was seriously affected by the economic shocks.
4.1 Distribution of number of income sources and income earners
The livelihood strategy of dependence on multiple income sources and income earners may be explained by the need to increase the income pool available to the household, as well as the desire to avoid the risks associated with relying on a sole income generator or income source in an environment prone to uncertainty. displays the distribution of households according to the number of income sources using classification in , where there are 14 possible income sources. presents the corresponding results for the number of income earners (NYE).
Table 4: Percentage distribution of households by number of income sources (NYS)
Table 5: Percentage distribution of households by number of income earners (NYE)
According to , over 80 per cent of households depended on multiple income sources in 1990/91 and 70 per cent did so in 1995/96. In both urban and rural areas the degree of income diversification decreased following the shocks, and overall dependence on a single income source increased. However, households in Harare and Bulawayo appear to have had more diversified incomes in 1995/96 than in 1990/91. indicates that overall dependence on one single income-earner decreased. The decrease is more pronounced in Bulawayo and Harare. The overall urban measure appears to mask this change, thus emphasising the importance of classifying the urban areas by degree of urbanisation. The increased participation in income-generating activities may have come from drawing mothers and children into the labour force following the economic crisis, although it may not be inferred directly from the data.
5. Wealth and income diversification – non-parametric analysis
The literature suggests that income diversification may not have a linear relationship with income. At low levels of income and development diversification opportunities may be weak owing to insufficient assets, while higher incomes may be compatible with a higher degree of diversification. However, once a certain threshold is passed, larger incomes may be the result of exploiting the advantages of division of labour and specialisation more fully. For instance, Deininger & Olinto Citation(2001) found a U-shaped pattern in the association between income diversification and income. To allow the data to dictate the relationship, a non-parametric regression for examining the relationship between diversification and wealth was chosen. and present kernel regression lines of the number of income sources (NYS) vs log per capita consumption expenditure (log(PCE)) for rural and urban areas, respectively.
Figure 1 Number of income sources plotted against log per capita consumption before and after shocks, rural areas
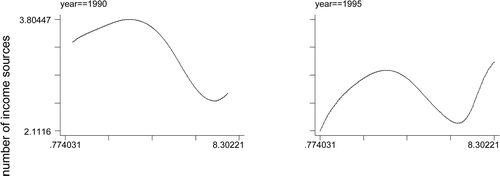
Figure 2 Number of income sources plotted against log per capita consumption before and after shocks, urban areas
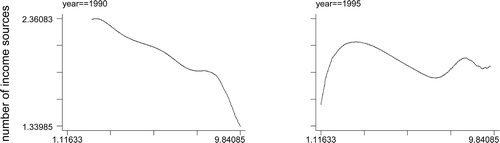
The urban results indicate that wealth had a generally negative association with the diversity of income sources before the shocks. This is not surprising, given that the urban poor commonly engage in temporary, seasonal and informal sector jobs. As a result, their income sources are riskier, which in turn makes the poor more vulnerable to shocks. Income diversification may thus be a way of survival for the urban poor. However, following the structural and weather shocks, the urban rich had a much higher rate of income diversification than previously. In general, while the poor in urban areas commonly pursue multiple income sources, the rich also engage in diversification when facing shocks. Similar trends are observed in rural areas, although diversification levels are generally higher there for any given level of wealth than in rural areas. In addition to highlighting the importance of income diversification as a risk management and coping strategy, this shows that the poor are particularly vulnerable to shocks as their livelihood base is less diversified.
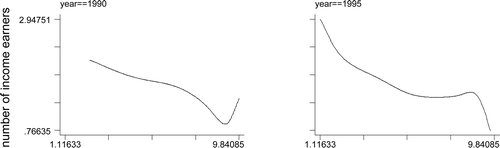
and show that very poor households in both urban and rural areas try to mitigate their vulnerability by relying on other members of the household to supplement income generated by those who previously generated income. In general, the results suggest different motives for diversification in urban and rural areas. While in urban areas diversification is driven more by survival than wealth accumulation motives, in rural areas the motives could be both shock protection and wealth accumulation.
Figure 3 Number of income earners plotted against log per capita consumption before and after shocks, rural areas
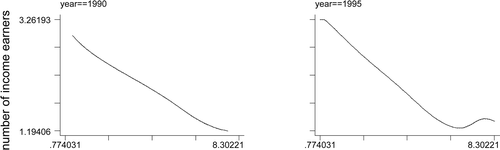
Figure 4 Number of income earners plotted against log per capita consumption before and after shocks, urban areas
6. Determinants of income diversification – multivariate analysis
The foregoing descriptive analysis showed that most households have more than one income source. Rural incomes and incomes in secondary cities are more diversified than those in larger urban areas. The descriptive and non-parametric results portrayed the association of income diversification with geographic and socio-economic variables in a univariate framework. These and other factors could simultaneously affect the level of income diversification and the changes that followed the economic shocks. The level and the type of income diversification strategy may depend on the accessibility to and availability of different income sources, which may in turn depend on a household's geographic location, access to factor markets, human and social capital and recurring policy changes. In this section, the various determinants of income diversification such as household and demographic characteristics variables are empirically analysed. In order to examine the contribution of a significantly wider range of explanatory variables, a multivariate analysis framework is employed.
The previous section put forward two possible ways of measuring income diversification: (a) the number of income earners (NYE) and (b) the number of different income sources (NYS). These are discrete ordered variables that indicate how many income-generating members (NYE) and income sources (NYS) a given household had access to, as possible measures of income diversification. Therefore, NYE takes the value 1 if a given household i living in region j (rural, urban) has only one income earner, 2 if a given household has two income earners and 3 if a given household has three income earners and so on, at time period t (1990/91, 1995/96). Similarly NYS takes the value 1 if a given household i living in region j (rural, urban) has only one income source, 2 if a given household has two income sources, and 3 if a given household has three income sources and so on, at time period t (1990/91, 1995/96). An ordered probit model is used to analyse factors affecting NYE and NYS.
An ordered probit model is based on the following specification:
Table 6: Descriptive statistics
The independent variables ( X i ) include:
| • | household demographic variables such as headship, head education and age, and other household members in age/sex/education groups | ||||
| • | household asset ownership variable to capture the wealth effect | ||||
| • | regional variables such as provincial indicators for the rural sub-sample and the level of urbanisation (Harare, Bulawayo, secondary cities) for the urban sub-sample | ||||
| • | a measure of rainfall variability to capture household response to income risk originating in weather shocks.Footnote6 It is expected that rainfall variability will have a positive association with income diversification. | ||||
presents the descriptive statistics of the dependent and explanatory variables. The descriptive statistics do not indicate significant changes in demographic and educational variables before and after the shocks, although educational attainments are generally higher for urban areas. Household size showed a slight downward growth. Overall, household monthly consumption expenditures and asset ownership took a strong downward hit and the reduction was highest among the urban households. The average number of income sources exhibited some declines in both urban and rural areas, while the average number of income earners increased in rural areas following the shocks.
The ordered probit results for NYS are presented in and for rural and urban areas, respectively.Footnote7 The results show that before the shocks the number of income sources in rural areas is directly related to the number of adult female members as a proportion of total household members. In rural areas household asset ownership is positively associated with the number of income sources, while in urban areas this relationship is either negative or insignificant. This finding supports the non-parametric result that it is easier for the asset-rich to diversify in rural areas, and that it is the poor who pursue multiple incomes sources in urban areas. The urban rich tend to have more stable jobs or businesses compared to the poor. The urban poor, whose income sources are less stable and temporary, engage in the pursuit of multiple income sources to maintain their subsistence consumption level. On the other hand, the rich in the rural areas have greater access to a diversified portfolio, while the rural poor might be expected to face entry barriers or lack the necessary resources or credits to pursue multiple income sources. The number of income sources is positively associated with rainfall variability before the economic shocks. The correlation is generally negative or non-significant following the shocks. This outcome may be indicative of adverse effects of the macroeconomic and weather shocks on household risk management and coping strategies.
Table 7: Ordered probit estimates of number of income sources (NYS)
Table 8: Ordered probit estimates of number of income earners (NYE)
On the other hand, the number of income earners is directly associated with male headship, the ratio of boys to girls in the household, and the number of adult household members (see ). Having more than one income earner may help mitigate economic downturns, especially for relatively poor households, as the non-parametric results indicated in the last section. Higher rainfall variability leads to more diversification in terms of the number of income earners in rural areas, both before and after the economic shocks. Positive association between rainfall variability and income diversification may imply that diversification may have been used as a risk management strategy. Finally, in agreement with the descriptive part, highly significant secondary city dummy and observed higher number of income sources in rural areas show that income diversification decreases with the degree of urbanisation.
7. Conclusion
There is growing evidence that economic and financial crises affect the poor most because they often lack the means to protect themselves from adverse income and employment shocks. By taking advantage of access to two comparable national income, consumption and expenditure surveys (ICES) of Zimbabwe spanning a period of economic adjustment and drought, this article examined how household income-generating strategies change in response to shocks. Specifically, while taking into account the urban–rural divide, the study looked at income diversification at the household level as a means of reducing vulnerability and stabilising consumption.
There are marked differences in the extent of diversification between rural and urban areas and within urban areas depending on the degree of urbanisation. Rural households tend to have a more diversified portfolio of income compared to their urban counterparts and the degree of income diversification decreases with the level of urbanisation. One of the ways urban households diversify their income is to engage in urban agriculture, with an important proportion of urban households engaging in agricultural production, mainly in the production of fruit and vegetables for their own consumption. The degree of involvement in urban agriculture falls with increases in urbanisation.
Both non-parametric and multivariate results suggest that wealth is negatively associated with income source diversification in urban areas before the shocks. However, following the structural and weather shocks, the urban rich had a higher rate of diversification than they did before. Income source diversification is positively correlated with wealth in rural areas, particularly following the shocks. This, in addition to highlighting the importance of income diversification as a risk coping strategy, shows that the poor are vulnerable to shocks as their livelihood base is less diversified. The findings thus strengthen the need for the public provision of well-designed safety nets as a risk-reducing and coping strategy in risk prone areas.
Additional information
Notes on contributors
Lire Ersado
World Bank. I would like to thank James Garrett and John Hoddinott for helpful comments on earlier drafts of this article. All remaining errors are my own. The findings, interpretations and conclusions expressed in this article are entirely those of the author and do not necessarily represent the views of the World Bank, its Executive Directors, or the countries they represent.Notes
2The cropping seasons are approximate; planting can take place as late as November and harvesting can come late in May. The information on seasons was obtained from crop calendars of the Food and Agriculture Organisation and from personal communications with agricultural officers in Zimbabwe.
3Results based on alternative categorisation of income sources are available from the author upon request.
4It is difficult to make a clear distinction between formal and informal activities in developing countries. For the purpose of this article, formal refers to economic activities that are registered and licensed by the government while informal ones do not possess one or both of these characteristics.
5Other sources of agricultural income may include fodder crops, fishery, forestry and others.
6In Africa, where most of the poor reside in rural areas and rely, at least partially, on agricultural activities for their livelihoods, climatic conditions can have a major impact on economic wellbeing and production decisions.
7Results based on alternative categorisations of income sources are not reported to save space and are available upon request. The results and conclusions drawn in this study are robust to income source classification.
References
- Alwang , J , Ersado , L and Taruvinga , N . 2001 . Changes in poverty in Zimbabwe between 1990 and 1996: worsening outcomes under adverse conditions . Development Southern Africa , 18 ( 5 ) : 553 – 79 .
- Alwang , J , Mills , B and Taruvinga , N . 1999 . Changes in wellbeing in Zimbabwe: non-parametric evidence , Washington : The World Bank [mimeo.] . World Bank Poverty Reduction and Social Development Africa Region
- Barrett , C B , Reardon , T and Webb , P . 2001 . Nonfarm income diversification and household livelihood strategies in rural Africa: concepts, dynamics, and policy implications . Food Policy , 26 ( 4 ) : 315 – 32 .
- Block , S and Webb , P . 2001 . The dynamics of livelihood diversification in post-famine Ethiopia . Food Policy , 26 ( 4 ) : 333 – 50 .
- Bryceson , D . 1999 . African rural labour, income diversification and livelihood approaches: a long-term development perspective . Review of African Political Economy , 26 ( 80 ) : 171 – 89 .
- Central Statistical Office (CSO) . 1998a . Report on the ICES , Harare : Government Printing Office .
- Central Statistical Office (CSO) . 1998b . Poverty in Zimbabwe , Harare : Government Printing Office .
- Deaton , A . 1991 . Saving and liquidity constraints . Econometrica , 59 ( 5 ) : 1221 – 48 .
- Deininger , K and Olinto , P . 2001 . Rural nonfarm employment and income diversification in Colombia . World Development , 29 ( 3 ) : 455 – 65 .
- Delgado , C and Siamwalla , L . 1999 . “ Rural economy and farm diversification in developing countries ” . In Food security, diversification and resource management: refocusing the role of agriculture? , Edited by: Peters , GH , Von , Braun and J . Aldershot : Ashgate . International Association of Agricultural Economists
- Egziabher , A G , Lee-Smith , D , Maxwell , D , Memon , P A , Mougeot , L J and Sawio , C J . 1994 . Cities feeding people: an examination of urban agriculture in East Africa , Ottawa : International Development Research Centre .
- Ellis , F . 1998 . Household strategies and rural livelihood diversification . Journal of Development Studies , 35 ( 1 ) : 1 – 38 .
- Ellis , F . 2000 . Rural livelihood and diversity in developing countries , Oxford : Oxford University Press .
- Freeman , D B . 1991 . A city of farmers: informal urban agriculture in the open spaces of Nairobi, Kenya , Montreal : McGill-Queen's University Press .
- Kinsey , B , Burger , K and Gunning , J W . 1998 . Coping with drought in Zimbabwe. Survey evidence on responses of rural households to risk . World Development , 26 ( 1 ) : 89 – 110 .
- Lanjouw , P , Quizon , J and Sparrow , R . 2001 . Non-agricultural earnings in peri-urban areas of Tanzania: evidence from household survey data . Food Policy , 26 ( 4 ) : 385 – 403 .
- Marquette , C M . 1997 . Current poverty, structural adjustment and drought in Zimbabwe . World Development , 25 ( 7 ) : 1141 – 50 .
- Maxwell , D . 1995 . Alternative food security strategy: a household analysis of urban agriculture in Kampala . World Development , 23 ( 10 ) : 1669 – 81 .
- Maxwell , D and Zziwa , S . 1993 . Urban agriculture in Kampala . Ecology of Food and Nutrition , 29 ( 2 ) : 91 – 109 .
- Paxson , C H . 1992 . Using weather variability to estimate the response of savings to transitory income in Thailand . American Economic Review , 82 ( 1 ) : 15 – 33 .
- Piesse , J , Simister , J and Thirtle , C . 1998 . Modernisation, multiple income sources and equity: a Gini decomposition for the communal lands in Zimbabwe , London : Clore Management Centre, Birkbeck College, University of London .
- Reardon , T . 1997 . Using evidence of household income diversification to inform study of the rural non-farm labour market in Africa . World Development , 25 ( 5 ) : 735 – 48 .
- Reardon , T , Delgado , C and Malton , P . 1992 . Determinants and effects of income diversification amongst farm households in Burkina Faso . Journal of Development Studies , 28 ( 1 ) : 264 – 96 .
- Rosenzweig , M and Wolpin , K . 1993 . Credit market constraints, consumption smoothing, and the accumulation of durable production assets in low-income countries: investments in bullocks in India . Journal of Political Economy , 101 : 223 – 45 .
- Scoones , I , Chibudu , C Chikura , S . 1996 . Hazards and opportunities, farming livelihoods in dryland Africa: lessons from Zimbabwe , London : Zed Books .
- Toulmin , C , Leonard , R , Brock , K , Coulibaly , N , Carswell , G and Dea , D . 2000 . Diversification of livelihoods, evidence from Mali and Ethiopia , Brighton : Sussex University . Research Report 47, Institute of Development Studies
- Udry , C . 1994 . Risk and insurance in a rural credit market: an empirical investigation in northern Nigeria . Review of Economic Studies , 61 ( 3 ) : 495 – 526 .
- Udry , C . 1995 . Risk and saving in northern Nigeria . American Economic Review , 85 ( 5 ) : 1287 – 300 .
- Zimmerman , F and Carter , M R . 1996 . Dynamic portfolio management under risk and subsistence constraints in developing countries , Madison : University of Wisconsin . Agricultural and Applied Economics Staff Paper Series