Abstract
The adoption of the 1996 Constitution mainstreamed women's issues in South Africa, but, despite the commendable progress in this sphere over the past ten years, success is only discernible if it translates into the betterment of women's lives. This paper aims to ascertain whether the development status of women improved or worsened between 1996 and 2001 by employing a gender-adjusted human development index (HDI). To offset the limitations of an aggregate measure, while compensating for the potentially distorting effects of HIV/AIDS on an aggregate human development indicator, a framework of supporting measures of well-being is also analysed to augment and validate the findings of the gender-specific HDI. The study finds that between 1996 and 2001 the development status of women in South Africa regressed, in both absolute and (especially) relative terms.
1Respectively, Researcher, Department of Economics, University of the Free State; Distinguished Professor of Economics and Vice-Chancellor, University of the Free State; and Professor in Development Studies and Director of the Centre for Development Support, University of the Free State.
1. INTRODUCTION
Gender imbalances have been an integral part of South Africa's history, with women being subjected to a variety of patriarchies dating back to the pre-colonial era. It is difficult to pinpoint the origin of the struggle for gender equality, specifically because it was historically intertwined with a racial and class struggle (Walker, Citation1990). Over the years women nevertheless emerged as an independent opposition force with their own aspirations for equality, ultimately culminating in the Women's National Coalition and the subsequent drafting of the 1994 Women's Charter to ensure a prominent place for women's rights in the emerging new political structures.
The new 1996 Constitution for South Africa acknowledged that women's rights are human rights. With one-third of legislative seats reserved for women, and policies and strategies in place at all levels of government to protect women's interests, South Africa is ostensibly a model country in terms of mainstreaming women's issues. Given this, plus expanded opportunities and a growing economy, one would expect the development status of South African women to have improved over time (in absolute terms and/or relative to men). This paper presents empirical evidence on this question.
Measuring human development on a gender basis is a complex issue. Development, and the inclusion of women within that concept, has been at issue since World War II. The need for multi-dimensional, non-monetary measures to capture the various dimensions of well-being and replace the mechanical gross domestic product (GDP) and gross national product (GNP) measures led to the creation of, among other things, the human development index (HDI). However, as an average measure the HDI discloses nothing about possible differences in the rate of development between men and women.
Having observed that men and women – despite sharing and collaborating in many ubiquitous and complex ways – differed markedly in respect of their rewards and deprivations, Anand & Sen (Citation1995: 1) designed a framework for gender-equity-sensitive indicators. The United Nations Development Programme (UNDP) Citation(1995) based its Gender Development Index (GDI), which corrects the HDI for gender inequality, on this framework. South Africa, for example, has a GDI of 0.678 (UNDP, Citation2003a: 312) compared with an HDI of 0.6871 for 2001 (UNDP, Citation2003b: 282), indicating a lower level of overall achievement for women because of gender inequalities. The UNDP Citation(1995) also introduced the Gender Empowerment Measure (GEM) to reflect the relative levels of political and economic empowerment within a society, yet this has no obvious correlation to the HDI or the GDI (Kabeer, Citation2003: 4–5).
Although the GDI and the GEM aim to address the HDI's lack of a gender dimension, they still indicate average achievement, albeit adjusted for gender inequalities. In this sense, the GDI and the GEM both incorporate gender disparities as an indiscernible element of the level of achievement. Dijkstra & Hanmer Citation(2000) also concluded that the GDI provides only limited new information because of its close correlation to the HDI and, in turn, to per capita GDP. They developed a measure, the relative status of women (RSW) that is independent of the GDP and provides an unencumbered measure of gender inequality.
The point of interest of this paper is gender inequality in the pace of human development. While the RSW is a valuable aid, it is only a relative measure with no reference to an absolute level of well-being, which renders it vulnerable to multiple interpretations – an issue its creators acknowledged (Dijkstra & Hanmer, Citation2000: 55). This drawback furthermore makes longitudinal comparisons particularly tenuous. Therefore, among the existing development measures there is no indicator actually highlighting gender differences in the pace of human development, a fact corroborated by the United Nations Population Fund (UNFPA, Citation2000: 5.10).
Attempts to investigate gender inequality in South Africa include the women's budget initiative (WBI), a noteworthy gender milestone of the past decade. This initiative aims to analyse the gender impact of the national budget (Budlender, Citation1996: 8), focusing on the role of the public sector in perpetuating and/or exacerbating gender differences (Mullagee & Nyman, Citation2000; Budlender, Citation2004; Parenzee, Citation2004; Poggenpoel & Olivier, Citation2004).
The government's ratification of the Convention on the Elimination of All Forms of Discrimination against Women (CEDAW) and the 1995 Beijing Conference on the status of women instigated two direct comparisons of women and men in South Africa, based on demographic and socio-economic trends. These were done by Central Statistics Citation(1998) and its successor, Statistics South Africa Citation(2002). The 2002 survey also included information from the first ever time-use study conducted in South Africa (StatsSA, Citation2001).
A myriad of studies has reviewed the impact of ten years of democracy on the women of South Africa. Research topics include the effect of the Poverty Relief Funds on women (Parenzee, Citation2003), women's increased participation in the labour market and its effect on their position relative to men (Casale & Posel, Citation2002; Casale, Citation2004), the feminisation of poverty (Bentley, Citation2004a), the impact of land reform on the economic, social and political status of women (Weideman, Citation2004), the impact of changes in the taxation policies for women (Smith, Citation2000), the effect of various local government revenue sources on women (Coopoo, Citation2000), the impact of the housing policy on women (Marais, Citation2002; Pillay et al., Citation2002), the effect of customs and excise tariffs on women (Goldman, Citation2000), the gender effect of migration policy (Dodson, Citation2001) and women as a political force (Bentley, Citation2004b, Citation2004c). The gender aspect of HIV/AIDS has been a further topic of research receiving much attention (Shisana, Citation2002; CADRE, Citation2003; Du Plessis, Citation2003; Kistner, Citation2003; Black Sash & Education Training Unit, Citation2004: Ch. 5).
Whereas the above all focused on the institutional impacts on women, only one study (Oranje, Citation2003) investigated the general well-being of South Africans, aiming to ascertain whether vulnerable groups (including women) have gained anything between the latest two census years. This study neither gives much statistical interpretation, nor depicts clearly the relative position of women and the impact of gender disparities. Another inadequacy is the exclusion of life expectancy and health statistics in the analysis, obviously ignoring the impact of HIV/AIDS on progress.
Our research aims to determine empirically whether women have indeed made progress over the past decade. The latest two census years are used to establish how the new democracy and related development policies and initiatives, based on a constitution espousing gender equality, have affected the development status of women in South Africa. We further attempt to bridge the above-mentioned measurement gap by adjusting the HDI to highlight the gender gap and showing how it affects the measurement of the development status of women.
2. AGGREGATE TRENDS: A GENDER-SPECIFIC HUMAN DEVELOPMENT INDEX
The HDI comprises three aspects regarded as essential for human development, namely the possibility of living a long and healthy life, of living this life with knowledge, not ignorance, and of having the means to acquire a decent standard of living (UNDP, Citation1995: 131). The HDI uses life expectancy at birth, literacy, the combined primary, secondary and tertiary gross enrolment ratio and GDP per capita (PPP $US) as proxies for these dimensions of human development.
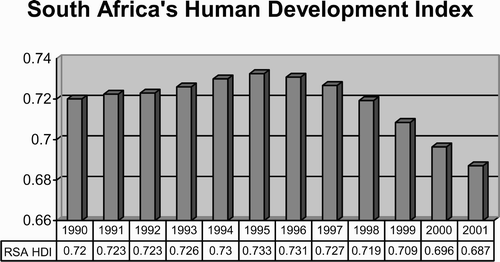
In international terms South Africa is regarded as a medium developed country. The HDI for South Africa moved into the 0.7 category in the late 1980s, after maintaining a 0.6 level during the 1970s and the early 1980s (UNDP, Citation2003a: 243). Human development as measured by the HDI peaked in 1995, with an index figure of 0.7326 (). However, it has been on a significant downward trend since then, almost certainly because of the effect of HIV/AIDS. It is worth noting that the analyses reported in this paper were done within the environment of a pronounced HDI decline and could differ from a similar study during an upward trend.
Figure 1: South Africa's human development index 1990–2001. Source: UNDP Citation(2003b)
Measuring human development without gender disaggregation is neither conducive to accurate assessment nor to gender-sensitive and gender-appropriate development policies. To capture gender differentials in development status, we use part of the basic premise of the GDI and apply it to the standard HDI calculation to create a gender-specific HDI for each gender group. This separates the average achievements of women and men.
The calculation of the gender-specific HDI differs from the standard calculation of the HDI in a number of respects.
-
The index parameters for life expectancy at birth were adjusted to reflect the longer life expectancy of women instead of using a single scale for both sexes.
-
Owing to the unavailability of reliable gender-disaggregated figures for South Africa, for 1996, the combined gross enrolment figures include primary and secondary school enrolment, but exclude tertiary levels.
-
The estimated earned income was adjusted to take into account both the lower economic activity rates of women and the difference in the wage rates between men and women.
Both the gender-specific HDI and the standard HDI are ultimately based on aggregates and are therefore, per definition, relatively crude measures. Interpretation of these measures must consequently be done with circumspection. To allow for comparison, a standard methodology HDI, being an average, gender-aggregated measure, was calculated (), using the same data on which the gender-specific HDIs were calculated.Footnote 3
Table 1: Standard methodology HDI for South Africa
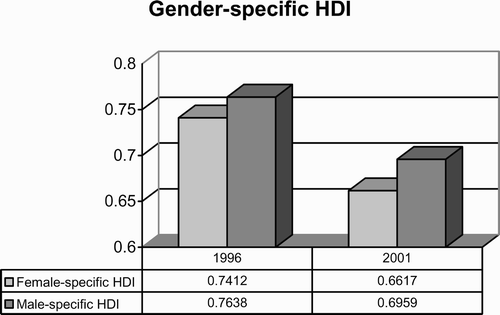
The results for the gender-specific HDI are shown in ; reflecting the distinct difference in the level and pace of human development between the genders, as measured by the gender-specific HDI:
-
The development level of men was higher than that of women in both 1996 and 2001.
-
Although the absolute level of development of both men and women declined between the two years, the decline of women was more pronounced.
-
The development level of women relative to men decreased from 0.9704 in 1996 to 0.9509 in 2001.
3. GENDER-SPECIFIC DISAGGREGATED ANALYSIS
Disaggregating the HDI and reviewing its key components individually adds value to the analysis by offering information on trends that might be obscured through aggregation.
The magnitude of the HIV/AIDS epidemic in South Africa and its influence on life expectancy and other aspects of development have the potential to distort, and even dominate, any HDI measure. Calculating an HIV-free HDI is theoretically possible, yet its value is questionable. To also ensure that we do not base our conclusions entirely on an aggregate measure that changed primarily owing to a single variable, the analyses are augmented by scrutinising components constituting, or closely related to, the gender-specific HDI. This is in keeping with the current trend of using a framework of indicators rather than a single composite measure in measuring development. This disaggregation could furthermore allay doubt about the randomness of changes by highlighting salient patterns among the components.
Although seven individual indicators were used to calculate the gender-specific HDI, eight indicators are examined in the component analyses. Unemployment was added to the analyses because of its influence on income (measured in terms of household income rather than GDP). Enrolment figures were evaluated, individually and in combination, thus adding three areas to the list. Non-agricultural wage rates were not examined, this information being unavailable in a gender-specific format for the years under consideration.
All the individual HDI components, except life expectancy, are analysed from four different perspectives.
-
(a) The actual headcount of people affected in the specific area of development. This measure, reflecting the absolute level of, for example, illiterate females in a given year, is referred to as the incidence.
-
(b) The percentage share women hold within the combined incidence group is termed the share, for example what portion of the unemployed are women.
-
(c) The size of the incidence group in relation to the total gender-specific part of the population is called the predominance, e.g. the portion of the female population that can be considered economically active. It aims to capture within-gender incidence.
-
(d) The size of the female incidence group relative to its male counterpart is termed the gender parity ratio. This refers to the ratio of girls to boys in, for example, primary school enrolment.
-
(a) incidence = xn and yn
-
(b) share = {[x n /(x n + y n )] × 100} and {[y n /(x n + y n )] × 100}
-
(c) predominance = {[x n /(x n + (1 − x n ))] × 100} and {[y n /(y n + (1 − y n ))] × 100}
-
(d) gender parity ratio = xn /yn .
4. LIFE EXPECTANCY
South Africans' life expectancy appears to have come full circle (). The improvement in life expectancy since the 1960s has virtually been reversed: in 2001, both sexes could expect to live almost the same number of years as in 1965.
Table 2: Life expectancy in South Africa
The life expectancy of women peaked in 1996, but dropped by twenty per cent during the following five years. Male life expectancy, historically about seven years shorter than that of women, similarly peaked in 1996, but dropped by 21.7 per cent towards 2001.
With one-quarter of all deaths in South Africa being attributed to HIV/AIDS in 2001 (UNDP, Citation2003b: 26), the influence of this disease on life expectancy cannot be denied. Homing in on gender differences in this area, the Actuarial Society of South Africa (ASSA) calculated the prevalence of HIV/AIDS to be 1.32 women to every man in 1995, 1.23 in 1998 and 1.22 in 2001. This narrowing in the infection ratio did not, however, last: the ratios increased to 1.25 in 2003 and 1.28 in 2005 (ASSA, Citation2002), indicating that women are increasingly more afflicted with the disease than men. In terms of life expectancy, the development status of both men and women clearly declined between 1996 and 2001. Although men lost marginally more ground than women in terms of percentage change, women lost more life-years in absolute terms.
5. ATTAINMENT OF KNOWLEDGE
The HDI's three principal components are seen to contribute equally to the well-being of any human being, as reflected by the equal weights assigned to them. The measure reflecting the attainment of knowledge is itself a composite of two indicators with unequal weights, namely literacy (two-thirds weight) and the combined primary school, secondary school and tertiary education gross enrolment ratio (GER)Footnote 4 (one-third weight). These same areas (bar the tertiary education GER) are reviewed within a South African context, again concentrating on 1996 and 2001.
5.1 IlliteracyFootnote5
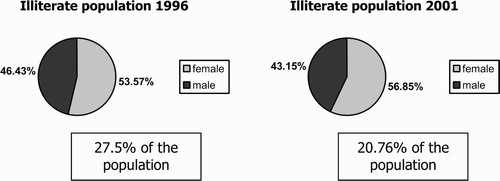
Almost 28 per cent of South Africa's population was illiterateFootnote 6 in 1996. Although strides were made in reducing illiteracy by 2001, 20.76 per cent of the population was still left illiterate ().
Although the absolute position of women, in terms of illiteracy, improved between 1996 and 2001, their relative position worsened () in that
-
the rate of reduction in the absolute number of illiterate females was half as rapid as that of males;
-
women constituted an even larger proportion of the illiterate population in 2001 than in 1996;
-
the reduction in the female illiteracy rate was almost one-third slower than the reduction in the male illiteracy rate; and
-
there were more illiterate females relative to men in 2001 than in 1996.
Table 3: Illiteracy
5.2 Education
5.2.1 Primary schoolFootnote7
Just over eight million children were enrolled in primary school in 1996. By 2001, this figure had fallen by 8.9 per cent to about 7.5 million (; ). The statistics reflect that by 2001 there were fewer girls in primary school than there were in 1996, both in absolute terms and relative to boys, given that
-
the drop in enrolment of girls exceeded that of boys;
-
girls represented a smaller share of total primary school enrolments in 2001 than in 1996;
-
the decrease in GER of girls exceeded that of boys;Footnote 8 and
-
primary school gender parity deteriorated during this time.
Table 4: Primary school education
When considering a demographic reason for the gender inequality, there were more girls than boys in the primary school age group for both years – 1.0095 girls for each boy aged 7–13 years in 1996, and 1.0054 for 2001. This rules out population trends as an explanation for why fewer girls were enrolling in primary school than boys.
The most obvious benchmark for testing the suggestion of girls' superior primary school performance would be an examination pass rate. The only obtainable gender-segregated indicator in this regard is Senior Certificate statistics. The 2001 Senior Certificate results reflect an average pass rate of 60.1 per cent for females, as opposed to 63.3 per cent for males (DoE, Citation2003: 22). Hence it would appear that girls do not have a marked propensity for higher pass rates than boys. Granted that these figures reflect only the results of a single year and only for secondary school, the superior performance of girls nevertheless seems somewhat untenable as a major explanation for the widening gender gap in primary school enrolment.
We can therefore conclude that girls were indeed falling behind boys in primary school education. One could speculate that, owing to worsening economic pressures and the increase in female-headed households (see Section 6.2), more mothers are forced to leave their homes to engage in productive activities. This usually means that girls (rather than boys) are kept away from school to look after younger siblings and perform household duties in the absence of the mother. This is, however, conjecture.
Also, the effect of HIV/AIDS should not be disregarded. In the event of a parent falling ill, it is more likely that a girl would be withdrawn from school to become the caregiver. The death of a parent would further exacerbate household needs, thus increasing the urgency for a child to leave school (Richter, Citation2004). HIV/AIDS also directly affects young girls because of the myth of the ‘virgin cure’ for HIV/AIDS (Van Niekerk, Citation2003), predisposing them to sexual violence (Speak Out, Citation2006) and therefore to contracting the virus at a very young age. The likelihood of contracting HIV/AIDS is for various reasons much higher for young women than for young men (Pettifor et al., Citation2005). These factors could all conceivably contribute to the gender disparities in primary school enrolment.
5.2.2 Secondary schoolFootnote9
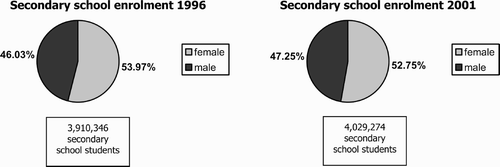
Slightly fewer than four million students enrolled in secondary school in 1996, compared with just over four million in 2001 (; ). Between 1996 and 2001 girls gained in absolute terms, but lost ground relative to boys in the area of secondary school enrolment, in that
-
the increase in the enrolment numbers of boys outstripped that of girls;
-
girls comprised a smaller portion of total enrolments in 2001 than before;
-
the drop in the GER of girls exceeded that of boys; and
-
the ‘gender gap’ narrowed during this period, leaving fewer girls, relative to boys, enrolled than before and thus eroding the previously advantageous relative position of girls.
Table 5: Secondary school education
Despite the surge in male enrolments towards 2001, one would nevertheless have expected much larger enrolments given the increases in the population aged 14–18, of 15 per cent for girls and 16 per cent boys between 1996 and 2001. This raises the question as to why approximately 320 000 girls and 240 000 boys aged 14–18 did not enrol in secondary school between 1996 and 2001.
Given the primary school ‘gender gap’ in favour of boys, the high degree of gender parity at secondary school level is somewhat enigmatic. It is highly unlikely that more girls suddenly started attending secondary school after an absence from primary school. A more probable explanation would perhaps be that large numbers of boys left the school system upon completion of primary school. One might speculate that up to 1996 the political turbulence of the late 1980s and early 1990s created a negative enrolment culture that influenced secondary school girls less than it did boys.
Combining primary and secondary school enrolments is of value as it gives an indication of the possible ultimate impact enrolments could have on adult literacy rates. In order to track the progress of children throughout their school career, one would need enrolment figures for at least 12 years. In the absence of such data, the ratio of primary school to secondary school enrolment could reflect the probability of school continuance if one assumes that continuance ratios were stable over time, ceteris paribus. The continuance ratios, calculated as the average of the provincial ratios, are shown in .
Table 6: Continuance of education – enrolment ratios of secondary to primary school
Based on this calculation, almost 54 per cent of girls were likely to continue from primary school to secondary school in 1996, as opposed to just over 45 per cent of boys. By 2001, the continuance rates for both girls and boys increased, with almost six of every ten girls who started primary school progressing to secondary school, compared with five boys. By combining primary and secondary school enrolment gender parities with these crude school continuance estimates,Footnote 10 it is found that if 100 girls were ready to start school in a particular year, 57 would have a secondary school education and 39 a primary school education only, while four would have no education 12 years later. Conversely, if 100 boys were ready to start school in the same particular year, 51 would have a secondary school education and 49 would have primary school education only, 12 years later. There would be no boys without any education.
Even though there will hypothetically be more girls than boys with secondary school education after 12 years, this situation is marred by the fact that of 100 girls, 39 (compared with 49 boys) would ultimately finish primary school only, while four will start their adult life as illiterates. It would thus seem that the primary school gender parity ratio is crucial in determining a country's ultimate literacy level. This is not to say that secondary school gender parity is valueless; on the contrary, it is crucially important in determining earning potential and long-term economic stability. For example, a one per cent increase in female secondary school education can potentially increase GDP by 0.3 per cent (UNFPA, Citation2000: 5.5&6). The primary school gender parity ratio is none the less the linchpin in determining who receives education and who does not.
This places somewhat of a damper on the ostensibly encouraging secondary school enrolment of girls. In view of this, it seems that the combined education status of girls was not only lagging behind that of boys, but had indeed fallen further behind by 2001.
6 INCOME
The gender-specific HDI adjusts the GDP (PPP$) per capita by taking demographics, economic activity and wage rates into account to arrive at a measure of income. Since a standardised, gendered wage rate was used for South Africa, the only GDP component to be analysed in this section is economic activity. Household income per gender of heads of households and unemployment will also be considered as indicators of people's material well-being.
6.1 Economically active populationFootnote11
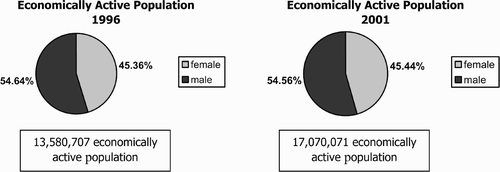
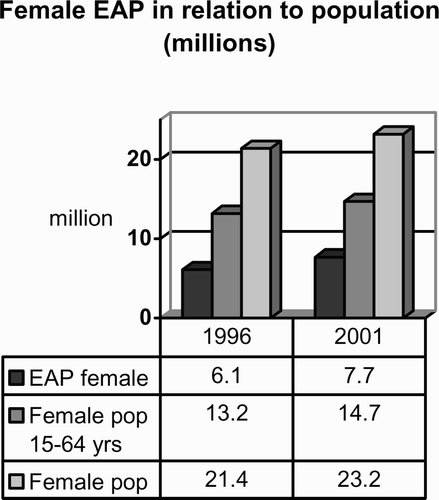
In 1996, 32.2 per cent of the South African population was considered economically active. About 3.5 million joined them by 2001, significantly increasing the economically active population (EAP) percentage to 37.5 per cent (; ). The increase in female and male EAP by far outstripped the population changes occurring between 1996 and 2001.Footnote 12 Since demographics can only partially explain the increase in EAP during this period, it would appear as though a large number of the previously economically inactive population was lured (forced?) into the marketplace during this time. This is particularly true of men. Gender differences in the changes occurring between 1996 and 2001 were furthermore far less pronounced in this area than in the other HDI areas under review.
Table 7: Income – economically active population (EAP)
Women gained both on an absolute and a relative level between 1996 and 2001, judging by the following:
-
The pace at which women joined the EAP marginally exceeded that of men.
-
Women constituted a somewhat larger proportion of the EAP by 2001 than before.
-
The portion of the female population considered to be economically active increased, although the increase was smaller than the corresponding increase in the male population.
-
Although the change was hardly discernible, the ratio of economically active females to males was inching towards parity.
The narrowing in the EAP ‘gender gap’ was so small it implies that the gender parity status quo in this area was maintained between 1996 and 2001. Women were therefore trailing behind men to just about the same degree as they had been doing five years earlier, with population trends offering no insight into the EAP gender parity ratios: for every male aged 15–64 years, 1.026 corresponding women for 1996 and 1.043 in 2001.
The dependency ratioFootnote 14 is worth considering when trying to understand this skewed EAP distribution. South Africa's dependency ratio of 61.38 per cent in 1996 and 58.33 per cent in 2001 is comparable to other countries within the same HDI league. However, the dependency ratio rises to a staggering 118 per cent in 1996 and 98 per cent in 2001, if the size of the dependent population is compared with that of the (actual) EAP. Since the reproductive role (raising the young and caring for the old and the infirm) has traditionally been allotted to women, the dependency ratio could offer one explanation for the continued relatively low female (formal) economic activity.
In absolute terms, women thus gained in economic activity status, but in relative terms there was virtually no change and women still lagged behind men.
6.2 Household incomeFootnote15
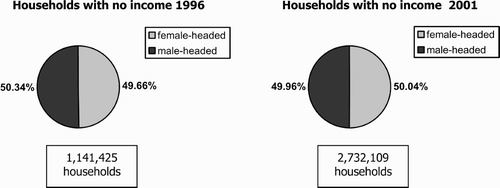
The 1996 Census found that 14.28 per cent of all households in South Africa had no income. Within five years, this figure jumped dramatically to 23.21 per cent (; ). In addition to the absolute decline in the income status of female heads of households between 1996 and 2001, women also lost ground relative to men on various levels. To wit,
-
the rate at which female-households joined the zero income group exceeded that of male-headed households;
-
female-headed households became the majority in the zero income group by 2001;
-
although the poverty rate amongst female-headed households increased more slowly than that of male-headed households, the rate amongst female-headed households still exceeded that of male-headed households; and
-
more female-headed households, relative to male-headed households, had no income in 2001 than in 1996.
Table 8: Household income
In seeking the factors that contribute to the increase in the absolute number of female-headed households living in poverty, we once again turn to population trends. If we assume a constant probability for a household to succumb to poverty, ceteris paribus, we would have expected an 11.02 per cent increase in the absolute number of female-headed households with zero income. The increase was nevertheless a soaring 141.17 per cent. We would similarly have expected an increase of 4.6 per cent in the male counterparts, yet the increase was 137.57 per cent, It is therefore clear that there is very little, if any, correlation between the increase in the number of households with zero income and demographic changes occurring between the two years.
The substantial increase in the number of female-headed households, from 0.63 per male-headed household to 0.72 in 2001, certainly exacerbates the already alarming trend in household income. South Africa is no exception when it comes to female-headed households featuring disproportionately high among the poor – giving rise to the term ‘the feminisation of poverty’ (Kabeer, Citation2003).
When it comes to the development status of women in South Africa, no aspect of household income is encouraging. Although both male- and female-headed households lost ground during these five years, by all accounts female-headed households have lost more ground in this regard.
6.3 UnemploymentFootnote16
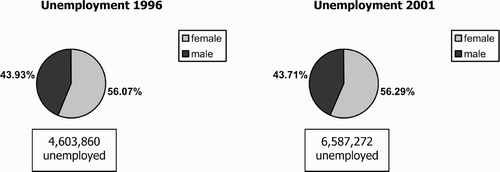
A total of 4.6 million people were deemed unemployed in 1996, with almost 2 million more joining their ranks by 2001 (; ). Not only were there more unemployed women in absolute terms by 2001, but the relative position of women also suffered, judged from the following:
-
The rate of increase in the absolute number of female unemployed surpassed that of men.
-
Within the unemployed group women were increasing their majority.
-
Although men's unemployment rate increased at a slightly faster pace than that of women, the female unemployment rate surpassed that of men by an increasing margin.
-
More women than men were unemployed by 2001 than in 1996.
Table 9: Unemployment
7 CONCLUSIONS
The gender-specific HDI indicates that the level of human development for women was lower than for men in 1996 and 2001, and that both the absolute and relative development status of women declined during these years (). Analyses of the individual development areas on which the HDI is based revealed the following:
-
Life expectancy: Women lost ground in absolute terms. Despite a marginal improvement in their relative status, their higher HIV/AIDS infection rate does not bode well for long-term retention of this relative status.
-
Literacy: Women's absolute status improved, but worsened in relative terms.
-
Primary school enrolment: Both the absolute and the relative status of women worsened between 1996 and 2001.
-
Secondary school enrolment: Women gained in absolute terms, but lost their previously advantageous position in relative terms.
-
Combined primary and secondary enrolments: The absolute status declined, while the relative status of females lagged further behind that of males.
-
Economically active population: The absolute development status of women improved, yet their relative status was virtually unchanged.
-
Household income: Female-headed households lost ground in both absolute and relative terms, while more households were female-headed in 2001 than in 1996.
-
Unemployment: The absolute and the relative status of women declined.
Table 10: Changes in the development status of women in South Africa between 1996 and 2001
Trends in these areas of human development in South Africa therefore support the initial finding that the development status of women undeniably regressed between 1996 and 2001, despite overwhelming expectations to the contrary. This does not, however, mean that no development progress whatsoever was made during this time. It only implies that the decline in development status in some areas overshadowed the progress made in other areas.
What is significant, though, is the fact that the development status of women has, on average, worsened compared with that of men. Women lost most ground relative to men in the area of literacy, while the area of EAP showed the least change in women's relative development status.Footnote 17 This has compelling implications for policy makers and urges a re-evaluation of the effectiveness of current gender-sensitive policies and political structures in raising the development status of all of South Africa's citizens.
The regressive development trend of women is obviously closely linked to the development status of women in the different provinces, the details of which could provide a clue to the decline. Poverty relief and development initiatives implemented in South Africa, particularly in the areas of social grants and land reform, are further areas of interest when considering whether changes in the development status of women, in particular, can be ascribed to policy. The disappointing relapse in the development status of women clearly raises a number of pertinent questions for future research.
Notes
1Respectively, Researcher, Department of Economics, University of the Free State; Distinguished Professor of Economics and Vice-Chancellor, University of the Free State; and Professor in Development Studies and Director of the Centre for Development Support, University of the Free State.
2The calculation of the gender-disaggregated and the standard HDI for South Africa is available from the authors upon request.
3Given the different data sources and the omission of tertiary gross enrolment figures from our calculations, it is to be expected that they will differ somewhat from the UNDP HDI figures.
4GER is defined as the number of learners, regardless of age, enrolled in a specific school phase as a percentage of the total appropriate school-age population. It is used to show the level of participation in education (DoE, Citation2003: 11).
6The illiteracy rate used in this analysis is defined as the percentage of the population older than fifteen years of age with no schooling. This excludes children aged below five.
5This section has Statistics South Africa (1998, 2003), and Global Insight SA (2004a) as its data sources.
7The sources used in this section are Strauss et al. Citation(1996), StatsSA (Citation1998, Citation2001) and DoE Citation(2003).
8At first glance, the overall decline in primary school enrolment is disconcerting, yet the decline may be seen as an improvement if the oversubscription is due to a high level of repetition. Primary school furthermore offers an affordable childcare option for working mothers. A stricter enforcement of the minimum school-going age could therefore also have contributed to the general decline in GER.
9The sources used in this section are Strauss et al. Citation(1996), StatsSA (Citation1998, Citation2001) and DoE Citation(2003).
10Since the 1996 enrolments were seemingly influenced by exogenous factors, we shall focus only on the 2001 ratio.
121996–2001 – female population: 8.44% increase and female population (15–64 years) 10.74% increase; male population: 7.05% increase and male population (15–64 years) 8.9% increase.
11This section uses data provided by Global Insight Citation(2004a).
13It is notoriously difficult to capture accurately the extent of informal sector activity (Bhorat et al., Citation2001: 86; Muller, Citation2003), making the availability of accurate gender-stratified informal sector data even less tenable. Although this paper acknowledges the significant role of the informal sector in sustaining a large part of the female population of South Africa, the inclusion of this sector in our analysis was not deemed feasible. This clearly constitutes a statistical constraint to be borne in mind when interpreting the results of this paper.
14The dependency ratio is the size of the dependent population, being those aged below five and those aged over 64 years, as a percentage of the working age population, aged 15–64 years (UNDP, Citation2000: 277).
15Sources for this section are StatsSA (Citation1998, Citation2001).
16This section uses data provided by Global Insight 2004a. Unemployment, in this section, follows the expanded definition, including both persons unemployed and looking for work and persons unemployed and not actively looking for work, but who would accept work if offered to them (Global Insight, Citation2004b: 32).
17This includes the technical narrowing in the ‘gender gap’ of households with zero income.
REFERENCES
- Anand , S and Sen , A . 1995 . Gender inequality in human development: Theories and measurement , New York : UNDP (United Nations Development Program) . Human Development Report Office Occasional Paper 19
- ASSA (Actuarial Society Of South Africa) . 2002 . Aids Model. http://www.assa.org.za Accessed 6 June 2006
- Bentley , K . 2004a . Women's human rights and the feminisation of poverty in South Africa . The Review of African Political Economy , 31 ( 100 ) : 247 – 61 .
- Bentley , K . 2004b . Women voters: More muscle than power? . Amalungelo: SA 10 years of herstory , : 17 – 18 .
- Bentley , K . 2004c . Who will woo her on 14 April? Targeting the female electorate . Election Synopsis , 1 ( 2 ) : 12 – 16 .
- Bhorat , H , Leibbrandt , M , Maziya , M , Van Der Berg , S and Woolard , I . 2001 . Fighting poverty: Labour markets and inequality in South Africa , Cape Town : UCT Press .
- Black Sash Education Training Unit . 2004 . HIV/AIDS and the Law. Paralegal advice website. www.paralegaladvice.org.za/docs/chap12.html Accessed 14 June 2005
- Budlender , D . 1996 . The women's budget , Edited by: Budlender , D . Cape Town : Idasa (Institute for Democracy in South Africa) .
- Budlender , D . 2004 . Investigating the implications of ten years of democracy for women: The role of the Department of Labour , Edited by: Budlender , D . Cape Town : Idasa (Institute for Democracy in South Africa) . www.idasa.org.za Accessed 5 May 2005
- CADRE (Centre for Aids Development Research Evaluation) . 2003 . Gender-based violence and HIV/AIDS in South Africa, A bibliography , Johannesburg : CADRE . www.cadre.org.za/pdf/Womens%20biblio.pdf Accessed 6 June 2005
- Casale , D . 2004 . What has the feminisation of the labour market ‘bought’ women in South Africa? Trends in labour force participation, employment and earnings, 1995–2001 , Durban : School of Economics, University of KwaZulu-Natal . Working Paper 04/84, Development Policy Research Unit
- Casale , D and Posel , D . 2002 . The continued feminisation of the labour force in South Africa: An analysis of recent data and trends . South African Journal of Economics , 70 ( 1 ) : 156 – 84 .
- Central Statistics . 1998 . Women and men in South Africa , Pretoria : Central Statistics .
- Coopoo , S . 2000 . Women and local government revenue , Cape Town : Idasa (Institute for Democracy in South Africa) . www.idasa.org.za Accessed 5 May 2005
- Dijkstra , AG and Hanmer , LC . 2000 . Measuring socio-economic gender inequality: Toward an alternative to the UNDP gender related development index . Feminist Economics , 6 ( 2 ) : 41 – 75 .
- Dodson , B . 2001 . Gender concerns in South African migration policy , Cape Town : Idasa (Institute for Democracy in South Africa) . Migration Policy Brief, No. 4, www.idasa.org.za Accessed 14 May 2005
- DOE (Department Of Education) . 2003 . Education statistics in South Africa at a glance in 2001 , Pretoria : DoE .
- Du Plessis , G . 2003 . “ HIV and fertility in South Africa: Some theoretical and methodological considerations ” . In Fertility, current South African issues of poverty, HIV/AIDS and youth. Seminar proceedings , Pretoria : Department of Social Development & HSRC .
- Global Insight Southern Africa . 2004a . Regional economic focus data , Pretoria : Global Insight . REF version 1.5o (0172)
- Global Insight Southern Africa . 2004b . Regional economic focus , Pretoria : Global Insight . Methodology version 5.4.04
- Goldman , T . 2000 . Customs and excise and how they affect women , Cape Town : Idasa (Institute for Democracy in South Africa) . www.idasa.org.za Accessed 19 May 2006
- Kabeer , N . 2003 . Gender mainstreaming in poverty eradication and millennium development goals , Commonwealth Secretariat, IDRC/CIDA (International Development Research Centre/Le Centre de recherches pour le développement international) http://www.idrc.ca Accessed 6 June 2005
- Kistner , U . 2003 . Gender-based violence and HIV/AIDS in South Africa: A literature Review , Johannesburg : CADRE . www.cadre.org.za/pdf/Womens%20lit20review.pdf Accessed 20 May 2006
- Marais , L . 2002 . Gender issues in housing delivery in the Free State since 1994 . Acta Academica Supplementum , 2002 ( 1 ) : 147 – 66 .
- Mullagee , F and Nyman , R . 2000 . Developmental social welfare: Who benefits and who bears the costs? , Cape Town : Idasa (Institute for Democracy in South Africa) . www.idasa.org.za Accessed 3 June 2005
- Muller , C . 2003 . Measuring South Africa's informal sector: An analysis of national household surveys , Durban : Development Policy Research Unit, University of Natal . Working Paper 03/71. http://datafirst.cssr.uct.ac.za/resource/papers/muller_0371.pdf Accessed 20 May 2006
- Oranje , M . 2003 . “ A comparative analysis of 1996 and 2001 census data on vulnerable and special target groups. Prepared for the Presidency and the Department of Social Development ” . Pretoria www.population.pwv.gov.za/ResearchReports/TenYearReview.html Accessed 12 June 2005
- Parenzee , P . 2003 . A gendered look at poverty relief funds , Cape Town : Idasa (Institute for Democracy in South Africa) . Budget Brief No. 129, Budget Information Services, www.idasa.org.za/bis Accessed 6 June 2005
- Parenzee , P . 2004 . “ Investigating the implications of ten years of democracy for women: The role of the Department of Justice and Constitutional Development ” . Cape Town : Idasa (Institute for Democracy in South Africa) . www.idasa.org.za Accessed 3 June 2006
- Pettifor , AE , Rees , HV , Kleinschmidt , I , Steffenson , AE , Macphail , C , Hlongwa-Madikizela , L , Vermaak , K and Padian , NS . 2005 . Young people's sexual health in South Africa: HIV prevalence and sexual behaviours from a nationally representative household survey , Johannesburg : Lovelife . http://www.lovelife.org.za/corporate/research/pettifor_final.pdf Accessed 21 May 2006
- Pillay , K , Manjoo , R and Paulus , E . 2002 . Rights, roles and resources: An analysis of women's housing rights – Implications of the Grootboom case , Cape Town: : Idasa (Institute for Democracy in South Africa) . Budget Brief 111, Women's Budget Initiative. www.idasa.org.za/bis Accessed 5 June 2005
- Poggenpoel , S and Olivier , L . 2004 . Investigating the implications of ten years of democracy for women: The role of the Department of Social Development , Cape Town : Idasa (Institute for Democracy in South Africa) . www.idasa.org.za Accessed 3 June 2005
- Richter , L . 2004 . The impact of HIV/AIDS on the development of children , Pretoria : Institute for Security Studies . Monograph No. 109. http://www.iss.co.za/pubs/Monographs/No109/Chap2.pdf Accessed 20 May 2006
- Shisana , O . 2002 . Nelson Mandela/HSRC Study of HIV/AIDS , Pretoria : Household survey HSRC .
- Smith , T . 2000 . Women and tax in South Africa , Cape Town : Idasa (Institute for Democracy in South Africa) . www.idasa.org.za Accessed 18 June 2005
- Speak Out . 2006 . Child rape & abuse: Sexual violence in South African society Johannesburg http://www.speakout.org.za/about/child/child_sexual_violence.html Accessed 21 May 2006
- STATSSA (Statistics Sa) . 1998 . Census 1996 , Pretoria : StatsSA .
- STATSSA (Statistics Sa) . 2001 . A Survey of time use: How South African women and men spend their time , Pretoria : StatsSA .
- STATSSA (Statistics Sa) . 2002 . Women and men in South Africa: Five years on , Pretoria : StatsSA .
- STATSSA (Statistics Sa) . 2003 . Census 2001 , Pretoria : StatsSA .
- Straus , JP , Van Der Linde , HJ , Plekker , SJ and Strauss , JWW . 1996 . Education and manpower development , Bloemfontein : University of the Free State, Research Institute for Educational Planning .
- UNDP (United Nations Development Program) . 1995 . Human Development Report 1995 , New York : Oxford University Press .
- UNDP (United Nations Development Program) . 1997 . Human Development Report 1997 , New York : Oxford University Press .
- UNDP (United Nations Development Program) . 2000 . Human Development Report 2000 , New York : Oxford University Press .
- UNDP (United Nations Development Program) . 2003a . Human Development Report 2003 , New York : Oxford University Press .
- UNDP (United Nations Development Program) . 2003b . South Africa Human Development Report , Cape Town : Oxford University Press .
- UNFPA (United Nations Population FUND) . 2000 . State of world population 2000 , New York : United Nations Population Fund . http://www.unfpa.org/swp/2000/english/index.html Accessed 19 May 2005
- Van Niekerk , J . 2003 . Helping children cope with HIV and AIDS: The experiences and role of Childline , South Africa : Childline . http://www.hivan.org.za/edit_essays/November%202003.asp Accessed 20 May 2006
- Walker , C . 1990 . Women and Gender in Southern Africa to 1945 , Edited by: Walker , C . Claremont, , South Africa : David Phillips .
- Weideman , M . 2004 . Women and land reform in South Africa: Gender and women's studies for Africa's transformation (GWS) , African Gender Institute, University of Cape Town . www.gwsafrica.org/knowledge/land%20sa.htm Accessed 20 May 2005
- World Bank . 1991 . World Development Report 1991 , New York : Oxford University Press .
