Abstract
This paper explores scenarios for employment creation, with an emphasis on services. It considers whether the government's current policies for the formal services sector will achieve its 2014 target of halving unemployment. New employment has mainly been found in the formal and non-formal services, and future employment will probably come from such sectors as business services, trade, finance and tourism. As at 2004, about 480 000 new jobs were needed annually to halve unemployment from 26.2 per cent to 13 per cent by 2014. This would require at least twice the average annual job creation since 1994. Two scenarios are considered: the first under current conditions with similar rates of growth; the second with substantial improvements in policy, especially the promotion of trade in services. The first scenario leaves the economy with the same rate of unemployment in 2014. The second sees a reduction in unemployment of 20 per cent.
1Executive Director, Employment, Growth & Development Initiative, HSRC (Human Sciences Research Council).
1. INTRODUCTION
More than a quarter of the South African labour force was unemployed by 2004 (StatsSA, Citation2004). This is certainly one of the top socio-economic concerns in South Africa. Between 1995 and 2004, the economy generated an annual average of 300 000 net new jobs, as compared to an annual labour force growth of about 550 000 (Altman, Citation2004; StatsSA, Citation2004).
Will the government's current policy priorities and plans for the formal services sector guide the economy towards its 2014 target of halving unemployment? Net new employment has been found mainly in the formal and non-formal services. Given the structure of the South African economy, it is most probable that future employment will be sourced from such sectors as business services, trade, finance and tourism. This paper explores possible scenarios for employment creation, with a special emphasis on services.
2. EXPLANATIONS OF SLOW EMPLOYMENT GROWTH AND HIGH UNEMPLOYMENT
Rising unemployment and slow employment growth have been explained by a range of factors, some of which are reviewed below.
2.1 Rapid labour market entry
It has been argued that employment has grown, but not as fast as the labour market. (Bhorat & Cassim, Citation2004). This is an important explanation of rising unemployment, but does not explain why the economy is unable to generate sufficient employment for its workforce. While labour force participation rates (LFPR) rose in the 1990s, they have been relatively stable since 2000. Therefore rising LFPRs cannot explain why unemployment has expanded in the 2000s.
2.2 Rising wages
Rising wages have been blamed for slow employment growth. The trade union movement was successful in substantially raising wages in select industries through the 1980s, particularly in mining and manufacturing (Fallon & Pereira de Silva, Citation1994; Fallon & Lucas, Citation1998). The public sector unions became more prominent in the late 1990s. However, recent work shows that wages for low- and semi-skilled workers stagnated or fell from at least 1997 forward (Woolard & Woolard, Citation2006). Rising wages for lower-skilled workers would therefore not be the main explanation for rising unemployment in the 1990s.
2.3 Insufficient formal sector demand
Employment in the traditional resource-based industries, namely mining and agriculture, has been shrinking since the 1980s. There has not been sufficient employment take-up in the more advanced industrial sectors, as would be expected in a process of structural change and development. This has resulted in an observed skills and capital intensification in the South African economy. The main growth sectors have been ones that are energy and capital using (Bhorat & Hodge, Citation1999; Altman, Citation2001a, Citation2001b; Edwards, Citation2001a, Citation2001b; Bhorat & Cassim, Citation2004).
Employment in the major primary resource-based industries has fallen, primarily due to commodity price trends, technical conditions, domestic market deregulation and fear of potential land tenure claims and labour rights in agriculture. The slow pace of land reform and the protectionist stance of the USA and the European Union further limit the expansion of new agricultural activity (Altman, Citation2001a, Citation2001b).
The dramatic fall in primary resource-based employment in the 1990s was not compensated for in other industries. Gross fixed capital formation fell by an average of 1.5 per cent per year between 1990 and 1994, and subsequently grew by an average of only 4.7 per cent per year between 1995 and 1999. This latter growth was primarily driven by investment in public sector corporations. Growth rates of private capital formation fell over the 1990s, particularly with the decline in the construction and mining sectors: gross fixed capital formation as a percentage of GDP was below 17 per cent throughout the 1990s, as compared to rates of around 27 per cent in 1983 (SARB, Citation2000). To offer some perspective, in 1998 gross domestic investment as a percentage of GDP in South Africa was about half that of Malaysia or Thailand (Mazumdar & Basu, Citation1997). Most economies that have sustained real growth rates of three per cent or more have had investment and savings levels in excess of 20 per cent of GDP (Berry, Citation1996; Muqtada & Basu, Citation1997; Berry et al., Citation1997). Growth has been positive, but not sufficient at an average ranging from two to four per cent between 1999 and 2004. Investment as a proportion of GDP was 15 per cent in 2000, as compared to countries such as Brazil, Chile, Malaysia or Thailand that have investment to GDP ratios exceeding 20 per cent (Bhorat & Cassim, Citation2004: 11).
The main investments prior to 1984 were largely directed to capital-intensive resource-based projects in basic chemicals and metals. Minerals revenues enabled the spending on defence and on capital-intensive projects that marked the inward focus of the former regime. For example, basic chemicals and basic metals accounted for 66.7 per cent of investment made between 1972 and 1990; by 1990, the basic chemicals and metals sectors accounted for over half of South Africa's capital stock. The politically driven synthetic fuels projects, Mossgas and Sasol, alone accounted for more than half the growth in manufacturing investment over this period (Altman, Citation2001a, Citation2001b).
Employment growth depends on human and physical capital formation, the latter ideally applied to labour-absorbing investments. While labour-intensive industries, such as clothing, have been promoted in South Africa since the 1920s, this was done within a context that severely limited its growth: a closed economy with constrained domestic demand due to apartheid. So between 1972 and 1990 the capital stock in the clothing sector fell by 19 per cent. Similarly, there was only marginal investment in the four most labour-intensive industries over this 18-year period (Kaplinsky, Citation1995). Between 1984 and 1990, the manufacturing capital stock actually diminished.
In the 1990s, the substantial restructuring that took place in manufacturing in response to globalisation leaned towards an ever more capital-using base. Manufactured exports rose from 5 to 20 per cent of total exports between 1988 and 1996. Yet the majority of manufactured exports are still material-intensive products, such as beneficiated iron and steel, processed chemicals, processed foods, paper and paper products, and non-ferrous metals, which by 1996 constituted 62 per cent of manufactured exports. For example, in 2000 merchandise exports increased by ten per cent (and imports by nine per cent), but most of this growth can be explained by the R2 billion in capital exports by South African contractors during the construction of the Mozal smelter in Mozambique (Government of South Africa, Citation2001).
Since the mid-1990s, there has been substantial growth in exports of mechanical machinery, motor vehicles, electrical machinery, transport equipment and wine, although increasing from a small base and primarily destined for African markets (Black & Kahn, Citation2002). Opening up to the rest of Africa has been important, since this is the destination of two-thirds of manufactured exports. The share of exports destined for Western Europe, excluding gold, fell from 50 to 41 per cent, while Africa's share grew from nine to 18 per cent between 1998 and 1996. The restructuring and export expansion has not resulted in net employment gains.
Altman (Citation2001a, Citation2001b) argued that South Africa has had difficulty casting off its historical minerals economy orientation. South Africa displays many characteristics that are common to minerals-exporting economies. These countries have a tendency to leapfrog from the resource base- to capital-intensive industry, missing the period of development involving labour absorption in low-cost exportables. They do this because they earn capital from exports of high value minerals. Moreover, these same high value minerals exports have the effect of overvaluing the currency and therefore render low cost value-added exports less competitive. In contrast, low income, non-resource-rich countries rely on their low-cost labour to promote development. This is one reason why minerals economies are often more unequal, as there is greater economic exclusion (Auty, Citation1993, Citation1994; Ostensson & Uwizeye-Mapendano, Citation2000). They also tend to grow more slowly. This development path can be altered, but requires substantial policy initiatives to shift economic incentives towards labour-absorbing exportable sectors.
2.4 Small non-formal economy
Most developing economies have very large non-formal economies. In contrast, the non-formal economy in South Africa is relatively small. The non-formal economy is here defined as the informal sector plus domestic work, subsistence agriculture and unpaid family labour.
The small size of the non-formal economy is not so surprising when one considers the way the apartheid regime largely destroyed the artisanal and black entrepreneurial base. For example, it was illegal for Africans to own a business in a ‘white’ area and the number of permitted activities was severely circumscribed (Southall, Citation1980; Nattrass & Nattrass, Citation1988; Altman, Citation1997). For example, in 1963, a circular was issued to local authorities by the Department of Bantu Administration and Development saying that Africans could only trade in day-to-day necessities involving the following businesses: grocer, butcher, fish fryer, greengrocer, eating house, dairy, and wood and coal dealer. An African could not legally establish an industrial concern (Nattrass & Nattrass, Citation1988). In this way, the culture of entrepreneurship was broken down.
3. EMPLOYMENT NEEDED TO HALVE UNEMPLOYMENT
In identifying employment scenarios, the author takes the government's stated objective of halving unemployment by 2014 as a starting point. The rate of unemployment will depend on both labour force considerations and employment growth. This article relies solely on linear modelling to pose initial ‘what if’ questions. Future growth depends on past experience, plus potential changes in business conditions and the policy environment. The estimates in this paper focus on previous employment trends as available through the October Household Surveys and the Labour Force Surveys (StatsSA, Citation1997–2004). Further insights as to potential employment are considered based on other available studies and sector projections. Policy announcements to the end of 2004 are considered, so as to reflect on how their intention matches the stated employment target.
The first task is to ascertain how fast the labour force might grow. The more rapidly it grows, the more pressure there is on job creation. There is also a backlog of people who are already unemployed. In the South African context, both considerations are important in dramatically reducing the unemployment rate. On the other hand, the expected pace of employment growth also needs to be assessed. This depends on the demand for labour and the availability of the categories of labour required to meet that demand.
There are two main ways to define the ‘halving of unemployment’ (Meth, Citation2004). The first is halving the number of unemployed, and the second is halving the unemployment rate. For the purpose of this paper, the second definition is used. In 2004, there were about 11.64 million people working and 4.14 million unemployed, by the official definition (StatsSA, Citation2004).
The labour force appeared to be growing annually by up to two per cent, reaching 15.8 million people in 2004, by the strict definition. The population estimates were revised a number of times over the period 2002–4. Previously it had been thought that the labour force might even shrink as a result of HIV/AIDS. A population survey by the HSRC found that the population was growing more rapidly than had previously been thought (Shisana & Simbayi, Citation2002). In early 2004, Statistics SA released updated mortality figures that again question whether the population is growing more slowly.
Meth Citation(2004) discussed participation rates and the growth of the labour force. He suggested that the labour force might grow by between one and 2.5 per cent between 2004 and 2014. He put forward the opinion that participation rates are likely to stay stable or fall. He did not take into account the possibility that employment growth could cause rising labour force participation rates. South Africa's participation rates are still at the low end of average, and could potentially rise: the average for middle-income countries varies from 50 to 68 per cent, as compared with 54 per cent in South Africa (Altman, Citation2004; StatsSA, Citation2004).
Hence, there is much uncertainty. For the purpose of this paper, it is assumed that the labour force grows by 1.8 per cent annually. This translates into a labour force with 18.9 million participants by 2014. While the population may grow more slowly, it is anticipated that any success in employment promotion will generate a signal, encouraging greater entry into the labour force and active searching for work.
The unemployment rate in 2004 was 26.2 per cent. If the labour force has 18.9 million participants in 2014, then to achieve an unemployment rate of 13 per cent, 16.4 million people should be working. To halve unemployment, approximately 4.76 million net new jobs would have to be generated in the ten-year period between 2004 and 2014.
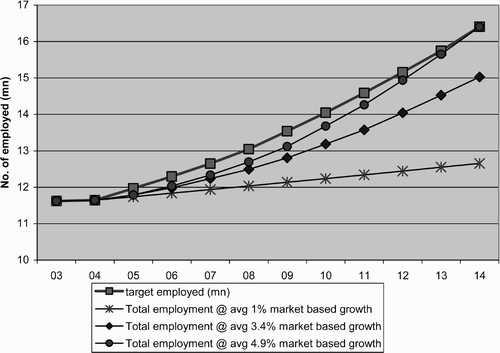
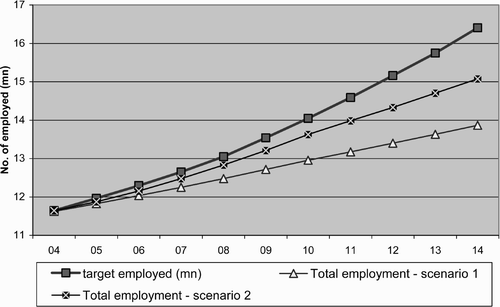
presents the number of jobs that would be needed to reach the government's 2014 employment target. It then puts forward the number of ‘market-based’ jobs that would be needed to expand to meet that target on its own. ‘Market-based’ employment refers to formal and non-formal employment, excluding direct government employment, special employment programmes and public procured construction. (Special employment programmes are government-led and procured services in non-construction activities such as home care, early child development, and agricultural and environmental projects.) ‘Market-based’ employment would have to grow by an average 4.9 per cent per annum, to raise total employment from 11.64 million to 16.41 million on its own.
This is a very rapid rate of employment growth, requiring even higher economic growth rates. Therefore, the combination of sector policy options are considered, including market-based sectors, government employment and special employment programmes.
4. POSSIBLE SOURCES OF JOB CREATION
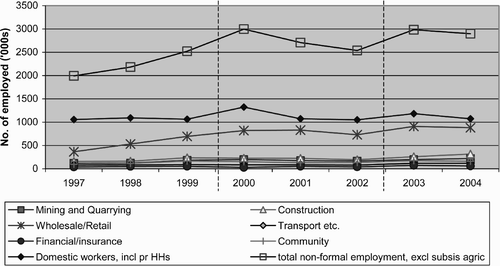
Historical rates of employment growth may give a sense of potential sources. and offer an overview of employment growth between 1997 and 2004 by major economic sectors. The vast majority of employment created in the 1990s was sourced from the services sectors, whether formal or non-formal. For example, it is estimated that only 124 000 net new manufacturing jobs were created between 1997 and 2004. This can be compared to an estimated 400 000 net new jobs in the finance, insurance, real estate, computer and other business services. Of course, this could also mean that substantially more emphasis should be placed on locating employment drivers in manufacturing.
Figure 2: Formal employment by sector. Source: StatsSA (1997–2004). Note: there are two breaks in this Statistics SA series. The first lies between 1999 and 2000 with the shift over from the OHS to the LFS. The second lies between 2002 and 2003 as the 2003 and 2004 LFS is weighted to the 2001 census, while the figures for 2000–2002 are weighted to the 1996 census, based on revised population estimates. Statistics SA will release revised figures, but had not done so in time for publication.
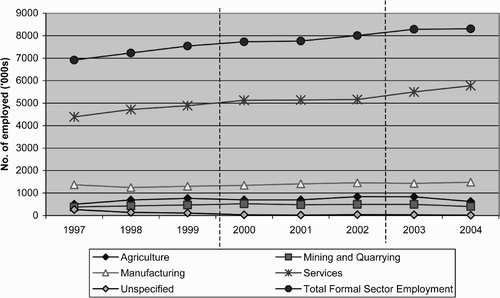
Figure 3: Non-formal employment by sector. Source: StatsSA (1997–2004). Note: non-formal employment here includes the informal sector, domestic labour, private households and unpaid family labour. Subsistence agriculture is excluded as it distorts the picture unnecessarily. It is estimated to contain between 300 000 and 400 000 participants. As in , note the breaks in the series in 2000 and in 2003.
In the following sections, certain market and non-market sectors are considered briefly to explore their possible contribution to employment creation. They have been identified on the basis of their recent contribution to employment or, alternatively, on the basis of government attention to them.
4.1 Market-based employment growth
If the government does not create more employment directly or indirectly, the formal and non-formal private sectors (here denoted as ‘market-based’) would need to generate about 4.76 million net new jobs by 2014, or 476 000 jobs per annum. To achieve this, the private sector would need to create an average 4.9 per cent annual employment growth. Compare this to the average rate of job creation of about 300 000 per annum between 1997 and 2002 (Altman, Citation2004; StatsSA, Citation2004).
Four sectors are considered briefly below: manufacturing, business services, tourism and non-formal activity. Manufacturing and tourism currently receive the most state attention, with the latter identified as an important potential contributor to job creation. Business services have been an important source of growth over the 1990s and 2000s. The non-formal economy was an important contributor to job creation in the 1990s and attention has grown in respect of how to stimulate it further.
4.1.1 Manufacturing
Manufacturing is generally taken to be the driver of growth in developing economies. While the experience over the 1990s and 2000s has been mixed, manufacturing has certainly not been an overall job creator. Over the past two decades, manufacturing employment has hovered around 23 per cent of GDP, or about 1.3 and 1.5 million jobs (Altman et al., Citation2005b). Perhaps it could expand past this threshold. However, in the context of rising capital intensity, it might not be a main contributor to employment growth.
In comparison with previous experience, an employment growth rate of two to three per cent annually to 2014 might seem ambitious. This would result in the creation of 362 000 to 736 000 new jobs, to add to the present 1.5 million working in manufacturing. This could happen only if meaningful policy changes were implemented in such a way that the price incentives encouraged more labour-intensive, rather than capital-intensive, investments. A number of factors will influence this, namely increased competitiveness, growing expansion into global markets, a shift toward more labour-absorbing sectors, and deepening linkages into the domestic economy.
Even in a positive scenario, it does not appear that manufacturing, mining or agriculture will generate sufficient employment to contribute to halving unemployment. Both agriculture and mining have been in decline for many years and most experts think it is unlikely that employment in them will grow (Altman et al., Citation2005b).
4.1.2 Services
The largest and fastest growing segments of the South African economy are now found in the services sector, from finance and business to community services. Some developed economies that have overcome high unemployment have relied substantially on the expansion of high-value market services, such as business and professional services, and low-value social and personal services, such as health, education and child care. Ireland and Finland are two good examples (Government of Finland, Citation1996; O'Connell, Citation1999). Previously, services had relied on the growth of other sectors. However, through increasing segmentation and niching, services have become a driver of growth, with their own product market dynamics. The linkages can now move in either direction, where manufacturing can stimulate the demand for services (as in transport), or services can stimulate the demand for manufacturing (as in retail trade for fast-moving consumer goods) (Altman, Citation2005).
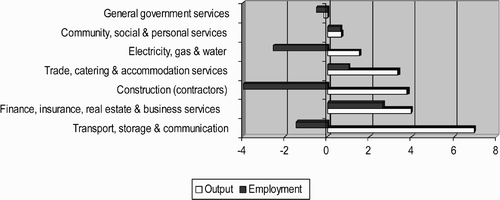
The services sector appears to be an important location for future job creation. Approximately 70 per cent of South African employment is found in this sector (Mayer, Citation2005). The public sector, related social services and personal services account for the majority of this employment, as shown in . Trade, catering and accommodation, and financial and business services are extremely important contributors to private sector employment. While not all necessarily contribute substantially to output growth, shows that these sectors are important sources of employment growth. This section therefore considers the employment prospects of business services and tourism.
Figure 4: The distribution of employment in the South African services sector, 2003. Source: Mayer Citation (2005) , calculated from Quantec database.
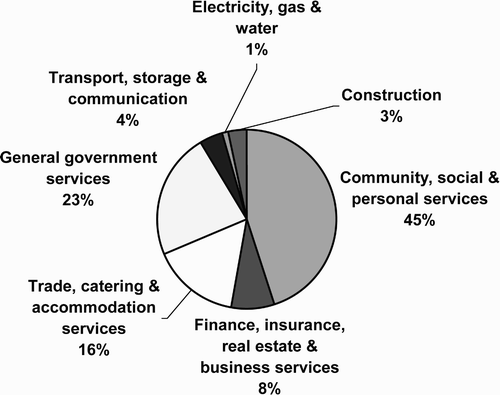
Figure 5: Output and employment growth in the services sector, 1999–2003 (percentage annual growth) Source: Mayer (2005), calculated from Quantec database.
Business services
The finance, insurance, real estate, computer and other business services employ approximately 2.1 million people. In 2003, 357 000 people worked in finance, insurance, computer and related industries. A further 1.77 million people work in business services and wholesale and retail trade (StatsSA, 2003). According to the LFS (labour force surveys), these sectors have been growing at three to five per cent per annum. If the industry keeps growing at this pace, then about 870 000 to 958 000 new jobs will be created. The financial sector itself does not appear to be creating jobs: in contrast, it shed about ten per cent of its employment between 1998 and 2002 (Ledger, Citation2004b). This appears to be the result of consolidation in the sector, with firms merging functions at the lower level in particular. Technology change has also driven job losses (Ledger, Citation2004b).
A recent DTI (Department of Trade and Industry) study on business process outsourcing (BPO) shows that South Africa could create 76 000 new outsourced data processing jobs by 2008 (up from approximately 6000) if it puts in place some substantial changes in respect of telecoms and marketing to start capturing global investment (McKinsey, Citation2005). To reach this target, operating costs would need to be reduced by at least 12 per cent. If growth continues, it is possible that 244 000 jobs could be created by 2014. In addition, BPO (call centres) already employs about 80 000, with an estimated growth of 14 per cent per annum in recent years. As global competition intensifies, it is assumed that it might grow by an average of ten per cent per annum. This would lead to an increase of about 148 000 jobs by 2014. However, this will be possible only if South Africa is able to attract global investment: it is currently estimated that approximately 15 per cent of call centre income is derived from international business and is expected to grow to about 50 per cent (Ledger, Citation2004a).
Tourism
Industry analysts look at the contribution of tourism to the economy to gain a full understanding of its breadth. This can sometimes lead to seemingly contradictory estimates of this contribution.
The World Travel and Tourism Council estimates that 539 017 people work directly in tourism, with an estimated growth of 4.9 per cent per annum (WTTC, Citation2004). It further estimates that tourism contributes R37.7 billion, or about three per cent of GDP. According to the WTTC Citation(2004), the ‘tourism economy’, which includes both direct and indirect activity, generates employment for 1.2 million people and contributes R93.6 billion to the GDP. The South African Tourism authority (SATOUR) uses the WTTC figures as a guide: it calculates the number employed on the basis of the number of jobs created per tourist arrival. SATOUR therefore estimates that every 12 visitors create one job and that there were 6.5 million tourists in 2003 (SATOUR, Citation2003).
The official data tell a different story. According to the South African Reserve Bank, tourism, here defined as all travel-related activity, generates about 2.5 per cent of GDP or about R32 billion. According to these figures, the sector is growing by about 2.5 per cent per annum. About 60 per cent of these receipts are sourced from domestic travellers (HSRC, Citation2001).
The September 2003 Labour Force Survey estimates that accommodation and catering, which is a subset of tourism, employs about 240 000 workers (StatsSA, 2003). This was about three per cent of formal employment, growing on average by 3.2 per cent per annum. A study by Grant Thornton for the Tourism, Hospitality and Sport Education and Training Authority (THETA, Citation2004) found a similar figure, with about 300 000 formal workers in the tourism sector, including all possible categories of activity.
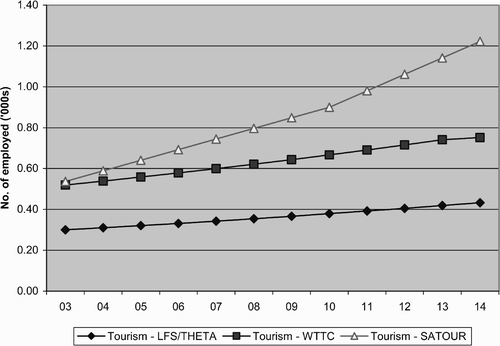
shows three scenarios for tourism employment from 2003 to 2014. The low scenario uses the LFS employment estimate of 240 000 for catering and accommodation as a base figure. It assumes that there are no policy improvements and that the sector continues to grow at three per cent, which is the recent average growth rate in the LFS. In this scenario, direct tourism employment would grow by 150 000 opportunities by 2014.
The mid-range scenario uses the WTTC figure of 539 017 direct tourism jobs as its base figure. It assumes no further policy improvements and that employment expands by 4.9 per cent: this is the WTTC's estimate of recent growth rates.
The most optimistic scenario also uses the WTTC figure of 539 017 direct tourism jobs as its base figure. The projection is calculated to estimate how many jobs would be created if SATOUR's stated policy objectives were realised. SATOUR seeks to increase the annual number of tourists from five million in 2003 to nine million by 2010 and 11 million by 2014. It also seeks to strengthen the domestic linkages and reduce leakage of expenditure by foreign tourists. Its goal is to generate more jobs per tourist. This is generally stated as the inverse, with reference to the number of tourists per job: the lower the figure, the greater the impact of tourism on job creation. SATOUR estimates that 12 tourists generate one job, and it seeks to improve this ratio to nine tourists per job. In summary, the optimistic scenario uses the WTTC employment base of 539 017 and assumes that the policy objective of increasing the number of tourists from 6.5 million to nine million is achieved, and that the intensity of job creation per tourist increases so that the ratio of tourists to job created falls from 12 to nine (SATOUR, Citation2003).
If SATOUR's policy objectives are realised, and if sufficient inducements are put in place, tourism employment will increase to 1.2 million opportunities, creating about 500 000 to 600 000 new jobs by 2014.
4.1.3 Non-formal economy
Approximately 3.3 million people worked in the non-formal economy in 2004, accounting for 28.6 per cent of total employment (StatsSA, Citation2004). This includes the informal sector, domestic workers and subsistence agriculturalists. Between 1995 and 2004, the informal sector grew by an average of seven per cent per annum. However, there is such a difference between the trends seen in the period 1995–9 and those in 2000–4 that it is difficult to say which presents the more accurate picture. While non-formal activity may have grown in the 1990s, shows that there does not appear to have been any substantial growth between 2000 and 2004.
The scenarios outlined in Section 5 estimate that non-formal employment might expand by two to three per cent per annum (equal to 626 000 to 760 000 opportunities). Relative to the experience between 2000 and 2004, this seems fairly ambitious. However, it does seem improbable that the economy could grow at a rate of three to four per cent per annum without any growth in the informal sector. This growth merely offers the reader a sense of what would happen if the informal sector grew at this rate, but does not claim to know whether it would or not.
4.2 The government sectorFootnote2
4.2.1 Infrastructure, construction and social welfare programmes
Large unemployment problems are generally met with proposals for expanded public works and special employment programmes, to make up for shortfalls in market-based employment. These are easier to create since government can simply make the decision to spend more on them, and they can be closed easily once the market picks up. In such situations, the programmes are implemented as active labour market policies.
In some countries, public works programmes have taken on an ambitious role in employment creation, functioning as a social safety net by directly increasing unskilled labour demand and making direct wage transfers to participants (see McCord, Citation2002). For example, during the Great Depression, public works schemes in the USA absorbed up to 30 per cent of the unemployed (Reynolds, Citation1984). In Tunisia and Mauritius similar programmes accounted for between 20 and 40 per cent of the unemployed during the early 1970s. The Maharashtra Employment Guarantee Scheme in India absorbed up to 75 per cent of available person days in rural Maharashtra State (Reynolds, Citation1984). The Minimum Employment Plan in Chile absorbed 8.5 per cent of the labour force in public works programmes (Nattrass, Citation2004). In South Africa, however, these programmes have been designed against the perceived need, as opposed to being an active labour market intervention. Job creation through construction and social welfare programmes is therefore still relatively limited in South Africa.
There is some interest in intensifying job creation through these programmes, through two means: by expanding expenditure and labour intensity in infrastructure projects; and by expanding expenditure and capacity in developmental social welfare programmes. Spending on infrastructure was constrained in the 1990s, but has been dramatically expanded since 2003. A programme to intensify labour use in civil works was also introduced in 2003. While spending on care programmes expanded in 2003/4 by 24 per cent in real terms, it was off a small base reaching only R2.47 billion in that year (Streak & Poggenpoel, Citation2004: 36).
In 2004/5, about 415 000 people may have been employed as a result of government expenditure on infrastructure and building, as shown in . Over time, this employment could grow to about 520 000, should government expenditure be realised and labour-intensive methods introduced into at least 30 per cent of infrastructure projects, as stated in the 2004/5 Medium Term Expenditure Report (Government of South Africa, Citation2004b). This estimate assumes that the large real increase in infrastructure spending announced in 2003/4 is merely sustained and that there are no further leaps in expenditure. It is more probable that spending will continue to grow, given the government's commitment to reducing backlogs, as evidenced by growing budget commitments and policy statements (see Mbeki, Citation2004, Citation2005).
Table 1: Expenditure and estimated employment arising from government spending on infrastructure and construction
Du Toit Citation(2005) showed that approximately 86 200 people worked in early child development (ECD) and home community-based care (HCBC) in 2003/4. These figures are sourced from estimates by the Departments of Education, Social Development and Health, as stated in their Social Sector Plan (DoE, DoSD & DoH, 2004). The government spent about R381 million on these programmes in 2003/4 (Social Sector Plan, Citation2004). Not all of this employment is created by government expenditure, as some is paid for by non-profit organisations and other contributions. There is further employment in adult basic education and training (ABET) and other developmental social welfare programmes aimed at other vulnerable groups, such as the disabled, young offenders and those in drug rehabilitation.
Du Toit Citation(2005) estimated that employment in ECD and HCBC could be increased dramatically if services were intensified to meet basic needs. The number of jobs created would depend on the delivery model chosen. For example, if a home-based model were implemented, up to 84 300 new jobs would be created (and therefore about 170 500 working in ECD and HCBC). If a ‘centre-based’ model were adopted, up to 440 000 new jobs might be created (and about 526 200 working in these sectors in total). A home-based model might be designed in recognition of capacity and budget constraints; this model would require an additional R1.4 billion annually by 2011. The centre-based option would cost an additional R10 billion annually by 2011. ‘Centre-based’ does not mean institutionalised care; it means community-based centres where care can be offered, such as in crèches. Home-based care means relatives providing care, trained and supported by a small core of social workers and other professionals. ECD for children from birth to five years offers the largest employment opportunity, since this is where the largest service gap lies.
Nattrass Citation(2004) raised concerns that a large portion of spending on public works programmes, in the region of 40 to 50 per cent, accrues to administration. This seems high, and more research would be needed to establish the accuracy of this claim, and to decide how to reduce this burden should this percentage be correct. More jobs would be created and infrastructure delivery take place if such administration costs were reduced. Much less is spent on social programme administration. The average administration slice from social welfare programmes was about 18 per cent in 2003/4 (Streak & Poggenpoel, Citation2004: 36). In some provinces, such as Gauteng, very little was spent on administration (approximately two per cent of programme value) (Streak & Poggenpoel, Citation2004: 62).
In summary, it appears that employment from government programmes could rise from about 500 000 in infrastructure, building, ECD and HCBC in 2003/4 to over one million by 2011 if ambitious and labour-using models are implemented. Alternatively, employment would grow to 690 000 if less ambitious programmes are implemented. Hence, potentially half a million jobs could be created, contributing to about ten per cent of the number needed to reach the target of halving unemployment. It is worth remembering that these are programmes aimed primarily at intensifying services and relieving backlogs, and not at creating jobs per se. Yet, the expansion of these jobs is made even more imperative when it is unclear where else large numbers of jobs might be sourced in the short and medium term: these opportunities could form an important bridge, enabling lower-skilled workers to enter the labour market.
4.2.2 Public sector
Public sector employment fell by about 265 000 jobs between 1995 and 2000 in all spheres of government (Altman et al., Citation2005b). There are no policy statements that would indicate that the government intends to dramatically expand direct state employment, except perhaps at the professional levels. In addition, there are sectors with high vacancy rates, as in the health sector (Health Systems Trust, Citation2005). This situation, coupled with population growth that might now encourage some need for public sector expansion, could potentially result in some growth. In 2002 there were about 1.2 million public sector workers (Altman et al., Citation2005b). A very conservative projection might put public service growth at one per cent per annum, which is less than the rate of population growth. If this did happen, there would be an additional 159 000 people working in the public service by 2014.
5. MEETING EMPLOYMENT TARGETS
5.1 Two possible scenarios
Below, two scenarios are compared. The first is based on a status quo, with employment growth proceeding in a similar fashion to the 1997–2003 period. The second is based on a more optimistic view, where employment is primarily driven by private sector growth, especially in the services sector. In this second scenario, developmental social welfare is also expanded quite considerably. These scenarios are summarised in .
Table 2: Services employment scenarios compared
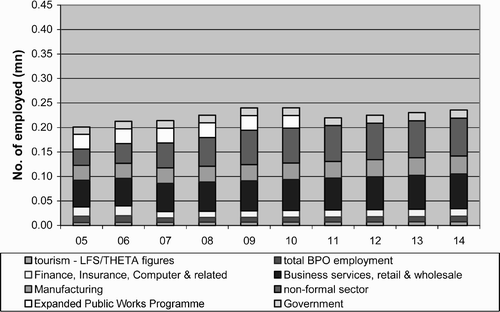
shows the annual increments in employment that would take place under scenario 1. This assumes that the special employment programmes do not expand past current proposals, and that infrastructure rolls out according to budget. Tourism employment grows by past rates, as reported in the Labour Force Survey, and South Africa does not capture significant global business in BPO. This scenario seems likely without policy shifts: for example, according to the Labour Force Survey, employment in the catering and accommodation industries in 2003 had fallen to 1999 levels. The services sectors do not develop export markets, and remain less competitive and restricted to a small market (except in so far as firms invest directly overseas). In this scenario, unemployment remains at 26.2 per cent.
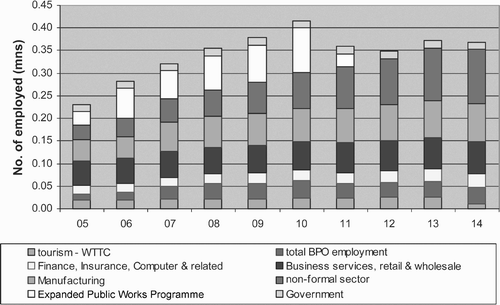
The second scenario is more positive. shows the annual increments in employment that would take place under scenario 2. It assumes that there are some policy shifts to accommodate SATOUR's tourism targets, and the DTI's BPO targets. Some of these policy shifts are related to exchange rates, interest rates, improved pricing and product quality in telecommunications and transport, a freer flow of global personnel and intensified human resource development. It also assumes that the government does reach its targets for intensifying labour use in infrastructure and substantially expands ECD and HCBC services in a way that meets some basic minimum delivery, with an extra R10 billion spent per annum by 2011. Employment levels out, since government expenditure peaks and is sustained at that level. In this optimistic scenario, employment expands as follows:
-
The labour intensification of public-procured construction, special employment programmes aimed at specified social welfare services and direct government employment creates approximately 634 000 new jobs, or about 13 per cent of the employment target.
-
Formal market-based employment creates up to 2.1 million new jobs, if strategies for BPO and tourism are realised, and other sectors grow at growth rates experienced since 1997. At the very least, this depends on policy becoming more orientated to the international services trade and to domestic stimulation through, inter alia, competitive and stable exchange rates, infrastructure reform that dramatically improves pricing and competitiveness in telecommunications and transport, and intensified human resource development.
-
Non-formal market-based employment grows by up to 759 000 new jobs, if it grows by up to three per cent per annum.
5.2 Meeting 2014 employment targets
shows cumulative employment growth in scenarios 1 and 2, compared to the employment target. The government's unemployment target of 13 per cent translates into 16.4 million people working in the formal and non-formal sectors by 2014.
Under scenario 1, total employment would expand to 13.86 million people by 2014. Unemployment would remain at the same level, about 26.2 per cent. Under scenario 2, 15.07 million people would be working, which translates into an unemployment rate of 20.1 per cent. Neither of these scenarios draws the economy sufficiently close to the target. Other interventions would be required to fill this gap. As at 2004, the economy would need to generate about 476 000 net new jobs each year in order to halve unemployment from 26.2 per cent to 13 per cent by 2014. To achieve the higher rate of job creation, employment would need to grow by 4.9 per cent annually. It would also need a higher rate of GDP growth.
What rate of GDP growth would be needed in the current environment to achieve this minimum target? GDP growth averaged about 2.7 per cent between 1993 and 2002, and 3.1 per cent between 1999 and 2002 (Goldman Sachs, Citation2003). Goldman Sachs Citation(2003) suggested that five per cent GDP growth would be sufficient to halve unemployment by 2014. However, this assumes almost no growth in the population or labour force, whereas more recent population estimates counter this pessimistic view. They estimate that the labour force would level off at 16.3 million (from 16.1 million in 2002), therefore requiring that employment grow to only 13.7 million, from 11.4 million in 2002. Subsequent to this report, two surveys shifted the view on population growth. First, the HSRC reported on its HIV/AIDS household survey results and then the Statistics SA 2001 census results were also released (StatsSA, Citation2001a; Shisana & Simbayi, Citation2002). Estimates of population growth were revised upwards. Hence, this paper projects that the labour force could grow to 18.5 million by 2014, with 15.75 million people employed.
To encourage the labour-absorbing sectors, the government will therefore need to intensify its policies in respect of exchange rates, infrastructure reform, improvements in economic efficiency and competition, human resource development and the promotion of the global flow of skilled personnel. It must also consider expanding the developmental social welfare programmes as a way of employing large numbers of lower-skilled workers, whilst intensifying social delivery.
Notes
1Executive Director, Employment, Growth & Development Initiative, HSRC (Human Sciences Research Council).
2References to planned government expenditure are sourced from the 2004/5 Budget Statement, and expenditure is sourced from the 2004/5 National Medium Term Expenditure Report (Government of South Africa, Citation2004a, Citation2004b). These figures, both past and planned, have been checked with the National Treasury, Presidency, Department of Public Works, Department of Education and Department of Social Development (see Altman et al., Citation2005a).
REFERENCES
- Altman , M . 1997 . State regulation and business strategies , PhD thesis, Economics Department, University of Manchester
- Altman , M . 2001a . Employment promotion in a minerals economy . Journal of International Development , 13 : 1 – 19 .
- Altman , M . 2001b . Paths to employment expansion in a minerals economy . Urban Forum , 12 ( 3–4 ) : 314 – 35 .
- Altman , M . 2004 . “ The state of employment ” . In State of the Nation: South Africa 2003–2004 , Edited by: Daniel , J , Habib , A and Southall , R . Cape Town : HSRC Press .
- Altman , M . 2005 . “ Leveraging services for growth, employment and equity: Project overview ” . Pretoria Unpublished report, prepared for the DTI (Department of Trade and Industry) on behalf of the Director General's Economic & Employment and Social Sector clusters
- Altman , M , Du Toit , R , Mayer , M , Sephiri , T and Kaiser Associates . 2005a . Employment through government procurement Pretoria Report prepared as part of the Services Project for the DTI (Department of Trade and Industry)
- Altman , M , Gostner , K , Tregenna , F , Lee , D and Van Heijden , T . April 2005b . “ Review of employment and remuneration trends for selected sectors in the South African economy ” . April , Pretoria Report prepared for the Policy Coordination and Advisory Services, Office of the Presidency
- Auty , RM . 1993 . Sustaining Development in Mineral Economies: The Resource Curse Thesis , London : Routledge .
- Auty , RM . 1994 . Industrial policy reform in six large newly industrialising countries: The resource curse thesis . World Development , 22 ( 1 ) : 11 – 26 .
- Berry , A . 1996 . “ Employment, growth and income distribution experiences of minerals and natural resource-based exporters. Employment, growth & development initiative ” . HSRC (Human Sciences Research Council) . Unpublished working paper
- Berry , A , Mendez , MT and Tenjo , J . 1997 . “ Growth, macroeconomic stability and the generation of productive employment in Latin America ” . In Employment Expansion and Macroeconomic Stability under Increasing Globalisation , Edited by: Kahn , AR and Muqtada , M . London : MacMillan .
- Bhorat , H and Cassim , R . 2004 . The challenge of growth, employment and poverty in the South African economy since democracy . Development Southern Africa , 21 ( 1 ) : 7 – 31 .
- Bhorat , H and Hodge , J . 1999 . Decomposing shifts in labour demand in South Africa . South African Journal of Economics , 67 ( 3 ) : 348 – 80 .
- Black , A and Kahn , B . 2002 . “ Growing without gold? South Africa's non-traditional exports since 1980 ” . In Non-traditional Export Promotion in Africa: Experience and Issues , Edited by: Helleiner and G , K . New York : Palgrave Macmillan .
- Du Toit , R . 2005 . Employment creation through the provision of social development services: Exploring the options . Development Southern Africa , 22 ( 5 ) : 657 – 71 .
- Edwards , L . 2001a . Trade and the structure of South African production, 1984–1997 . Development Southern Africa , 18 ( 4 ) : 471 – 91 .
- Edwards , L . 2001b . Globalisation and the skills bias of occupational employment in South Africa . South African Journal of Economics , 69 ( 1 ) : 40 – 71 .
- Fallon , P and Lucas , R . 1998 . South African labour markets: Adjustments and inequalities . Informal discussion papers on aspects of the South African economy, World Bank
- Fallon , P and Pereira De Silva , L . 1994 . South Africa: Economic performance and policies , World Bank Discussion Paper No. 7. Southern Africa Department, World Bank
- Goldman Sachs . 2003 . South Africa growth and unemployment: A ten year outlook , Global Economics Paper No. 93
- Government of Finland . 1996 . “ White paper ” . In The Finnish Government's White Paper on industrial policy , Finland : Ministry of Trade and Industry .
- Government of South Africa . 2001 . Budget Review , Pretoria : National Treasury .
- Government of South Africa . 2004a . Budget Review 2004/5 , Pretoria : National Treasury .
- Government of South Africa . 2004b . National Medium Term Expenditure Report , Pretoria : National Treasury .
- Health Systems Trust . 2005 . South African Health Review 2003/4 , Johannesburg : Health Systems Trust . Published Monograph
- HSRC (Human Sciences Research Council) . August 2001 . “ South African domestic tourism survey ” . August , Pretoria Report prepared for the Department of Environmental Affairs and Tourism (DEAT)
- Kaplinsky , R . 1995 . Capital intensity in South African manufacturing and unemployment, 1972–90 . World Development , 23 ( 2 ) : 179 – 92 .
- Ledger , T . 2004a . “ Employment and remuneration in the SA business process outsourcing sector ” . Pretoria Unpublished brief prepared for the Employment and Economic Policy Research Programme, HSRC
- Ledger , T . 2004b . “ Employment and remuneration in the SA financial sector ” . Pretoria Unpublished brief prepared for the Employment and Economic Policy Research Programme, HSRC
- Mayer , M . 2005 . “ Trade in services ” . Pretoria Report prepared for the Director General's Employment and Economic Cluster, Government of South Africa
- Mazumdar , D and Basu , P . 1997 . “ Macroeconomic policies, growth and employment expansion: The East and South-East Asian experience ” . In Employment Expansion and Macroeconomic Stability under Increasing Globalisation , Edited by: Kahn , AR and Muqtada , M . London : MacMillan .
- Mbeki , T . 21 May 2004 . 21 May , Cape Town Address of the President of South Africa, Thabo Mbeki, to the first joint sitting of the third democratic Parliament
- Mbeki , T . 11 February 2005 . 11 February , Cape Town Address of the President of South Africa, Thabo Mbeki, to the second joint sitting of the third democratic Parliament
- McCord , A . 2002 . Public works as a response to labour market failure in South Africa , Cape Town : Centre for Social Science Research . Working paper No. 19, November
- McKinsey & Co. 2005 . Creating employment and economic wealth through developing the South Africa BPO&O [Business Process Outsourcing and Offshoring] sector . Confidential report submitted to the City of Johannesburg
- Meth , C . 2004 . Half measures: The ANC's unemployment and poverty reduction goals , Cape Town : Development Policy Research Unit . Working paper 04/09, December
- Muqtada , M and Basu , P . 1997 . “ Macroeconomic policies, growth and employment expansion: The experience of South Asia ” . In Employment Expansion and Macroeconomic Stability under Increasing Globalisation , Edited by: Kahn , AR and Muqtada , M . London : MacMillan .
- Nattrass , N . 2004 . Unemployment and AIDS: The social-democratic challenge for South Africa . Development Southern Africa , 21 ( 1 ) : 87 – 108 .
- Nattrass , N and Nattrass , NJ . 1988 . Small formal business in Durban. , Natal Town and Regional Planning Supplementary Report, 31
- O'Connell , PJ . 1999 . Astonishing success: Economic growth and the labour market in Ireland , Geneva : Employment and Training Department, International Labour Office . Employment and training papers (44)
- Ostensson , O and Uwizeye-Mapendano , A . 7–9 November 2000 . Growth and diversification in mineral economies 7–9 November , Cape Town Regional workshop for mineral economies in Africa
- Reynolds , N . April 1984 . “ Citizens, the state and employment: Public Works as the core of a rural development strategy ” . In Second Carnegie Inquiry into Poverty and Development in Southern Africa April , 13 – 19 . Cape Town Paper 234
- SARB (South African Reserve Bank) . 2000 . Annual Economic Report , South African Reserve Bank .
- SATOUR (South African Tourism) . 2003 . Global competitiveness study . Presentation notes, prepared for DEAT (Department of Environmental Affairs and Tourism), the DTI (Department of Trade & Industry) and SATOUR
- Shisana , O and Simbayi , L . 2002 . Nelson Mandela/HSRC study of HIV/AIDS: South African national HIV prevalence, behavioural risks and mass media , Edited by: Shisana , O and Simbayi , L . Cape Town : HSRC (Human Sciences Research Council) . Household survey 2002
- Social Sector Plan . 2004 . “ Social Sector Plan 2004/5–2008/9 ” . Pretoria : Departments of Education, Social Development and Health .
- Southall , R . 1980 . African capitalism in contemporary South Africa . Journal of Southern African Studies , 7 ( 1 ) : 38
- STATSSA (Statistics Sa) . 1997 . OHS (October household surveys), 1997–1999 , Pretoria : Statistics SA .
- STATSSA (Statistics Sa) . 2001a . Census 2001 , Pretoria : Statistics SA .
- STATSSA (Statistics Sa) . 2001–2004 . LFS (Labour force surveys), September 2000–2004 , Pretoria : Statistics SA . Electronic data used in all cases except for September 2004
- Streak , J and Poggenpoel , S . 2004 . Toward social welfare services for all vulnerable children in South Africa , Cape Town : IDASA (Institute for Democracy in South Africa) . Occasional paper, Children's Budget Unit, Budget Information Services
- THETA (Tourism, Hospitality and Sport Education and Training Authority) . 2004 . Tourism, Hospitality and Sport Education and Training Authority . Sector skills plan, 2004–2009 , http://www.theta.org.za/skills/index.asp?thepage=sector_skills.htm Accessed 28 August 2006
- Woolard , I and Woolard , C . 2006 . Earnings inequality in South Africa, 1995–2003, Employment, Growth, and Development Initiative , Cape Town : HSRC Press . Occasional Paper 1
- WTTC (World Travel And Tourism Council) . 2004 . South Africa Travel and Tourism: Forging Ahead , London, , UK : WTTC .
