Abstract
This article reports the results of a 2002 survey of emigration potential among a representative sample of 4784 postgraduate and final-year undergraduate students at South Africa's tertiary educational institutions. The authors created a valid and reliable index of emigration potential and found slightly higher levels than those measured by identical questions in previous surveys of skilled adult South Africans. Multivariate regression analysis revealed that the factors that most increase emigration potential among South Africa's future skills base are logistical ones, including family encouragement and financial resources. Next in importance are students' prospects of a better life for themselves and their families in their target countries than in South Africa. Finally, the study showed that patriotism and strong national identity decrease emigration potential while previous travel abroad and access to information about life abroad increase it. It also found that a range of possible government attempts to make emigration more difficult would only increase students' probability of leaving the country.
1. INTRODUCTION
As they near graduation, highly educated young adults begin to make important decisions about employment, career, marriage and family. In the early 21st century, increasing numbers of students around the world must also decide where they want to pursue these plans. Things are no different in South Africa. Since the end of apartheid, young South Africans can look beyond the country's borders to find employment. Yet while greater opportunities and a wider range of choice may be good news for South Africa's talented tertiary students, it may be bad news for the country as a whole, robbing the country of considerable investments in training and education, as well as depriving the economy of needed skills and upper-end consumers.
Virtually all South African analyses of the ‘brain drain’ have focused on the negative aspects of skilled people emigrating (Haffajee, Citation1998; Van Rooyen, Citation2001; Bhorat et al., Citation2002; Crush, Citation2002; Dumont & Meyer, Citation2004). However, some analysts argue that the word ‘loss’ is misguided since emigration also brings gains (Meyer, Citation2001; Khadria, Citation2002; Martin & Widgren, Citation2002; Commander et al., Citation2003). Émigrés not only remit income while abroad, but also tend to return home and pass on advanced skills to their colleagues. This has led to the increasing use of terms such as skills ‘transfer’, ‘exchange’ and ‘circulation’ (Abella, Citation1997; Stalker, Citation2000; Wimaldharma et al., Citation2004). In fact, some argue that skills migration is not only a reality but is also necessary for industrial growth and cultural exchange in highly specialised societies (Khadria, Citation2002); but regardless of whether skilled emigration includes gains as well as losses, a brain drain is likely to be particularly damaging to an economy when skilled people leave relatively soon after training and the country fails to receive any appreciable return on its direct investments.
While the past ten years have seen a great deal of debate on the South African government's immigration policies, there is still no precise estimate of the extent of emigration from South Africa, or its causes. For example, Statistics SA estimated total emigration from 1989 to 1997 at approximately 82 000, including 11 000 ‘professionals’; however, a study of South Africans living in just five countries abroad put the total number at 232 000, of whom 42 000 were ‘professionals’ (a category narrower than that of ‘skilled’) (Brown et al., Citation2002). Using census data, another study argued that at least one million white South Africans emigrated between 1985 and 1996 (Van Rooyen, Citation2001). In a more predictive mode, an analysis of a 1998 nationally representative survey of skilled adults estimated that approximately 2 per cent (30 000 adults) had a ‘very high’ probability of leaving within the next five years, and another 160 000 had a ‘high’ probability (Mattes & Richmond, Citation2000). Thus, this study attempts to look into the future and assess potential emigration among South Africa's potential skills base: that is, young adults in tertiary training institutions. It also tests competing arguments that purport to explain the reasons behind South Africa's ‘brain drain’.
2. METHODOLOGY
This article is based on data collected by the Southern African Migration Project (SAMP) as part of the region's potential skills base. Conceptually, the target population for the SAMP potential skills base survey was South Africa's skills in training. Skilled people are defined as those who have received specialised training and possess key competencies and skills vital to the functional core of the economy (Mattes & Richmond, Citation2000). Thus a country's potential skills base consists of those people currently training to fill positions critical to that functional core.
This study defined South Africa's current potential skills base as consisting of students (a) studying at a South African tertiary institution (university, technikon or college); and (b) in the final year of an undergraduate or postgraduate degree programme. However, no national database of tertiary student numbers exists, especially of final-year students. Thus, in mid-2002, the authors collected these data from registrars at each tertiary institution across the country. On the basis of this definition, South Africa's potential skills base in 2002 was estimated at approximately 150 000 students (see ).
Table 1: 2002 final year South African tertiary population and sample
At the first stage of sampling, a list was compiled of all teaching faculties at all tertiary institutions across the country and the numbers of their final-year students. This list of faculties was then stratified according to (a) the type of institution (historically black or historically white), (b) the level of institution (university, technikon or college), (c) the type of degree (undergraduate or postgraduate) and (d) type of faculty. A sample of faculties was drawn from the entire list, with the probability proportionate to population size. Altogether, 74 undergraduate university faculties were selected, along with 92 postgraduate university faculties, 37 technikon faculties and three nursing college faculties. At the second stage of sampling, one class was chosen from each randomly selected faculty (or for each time that a large faculty was selected). While the sample was based on an expectation of eight interviews per class, it turned out to be more efficient to administer the questionnaire to all the students in each selected class. Thus the actual unweighted sample size was 4784. All cases were then weighted back to intended sample targets, so that the weighted data were based on a sample of 2400.
3. THE POTENTIAL SKILLS BASE
On the basis of this sample, South Africa's potential skills base is more female (54 per cent) than male (46 per cent) and more black (48 per cent) than white (40 per cent), coloured or Asian (12 per cent each). Just under half the students use an African language at home, the largest proportion being Xhosa (14 per cent). A quarter of the students said that they speak English and another quarter use Afrikaans. While there are no time-series data with which to draw a direct comparison, this seems to suggest dramatic changes at the country's tertiary institutions. The 1998 SAMP survey of skilled adults found a sample that was overwhelmingly male (61 per cent) and white (72 per cent), with most speaking Afrikaans (45 per cent) (Mattes & Richmond, Citation2000).
A quarter of the students described their family's socio-economic status as ‘upper class’ or ‘upper middle class’ and one-third ‘middle class’. One-fifth said they came from a ‘working class’ background and 15 per cent classified their family as ‘lower class’. Half the final-year students said they lived in a rural area, either in a rural farming area (25 per cent) or a small town (26 per cent). The rest said they came from a large town (13 per cent) or city (36 per cent).
Just over one-third were completing a certificate or diploma (36 per cent), and 38 per cent were completing a bachelor's degree. One-fifth of final-year students were engaged in postgraduate study pursuing an honours degree (10 per cent), a master's degree (12 per cent) or a doctorate (less than 1 per cent). The low number of PhD candidates may reflect a bias in the classroom-based setting of the sample, given that most PhDs in the South African system are obtained through individualised study. Four per cent were pursuing some other form of degree.
4. MEASURING EMIGRATION POTENTIAL
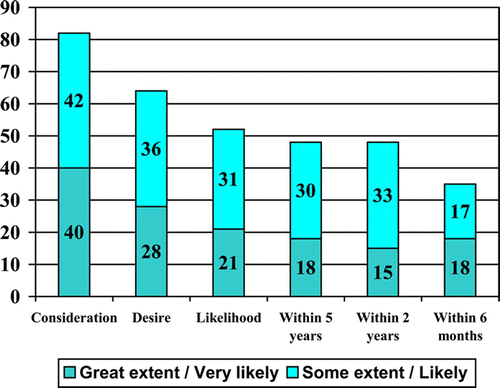
What is the potential for skills loss from final-year students emigrating? For a person to have a high emigration potential, they should–at a minimum–have given extensive thought to emigrating, they should want to emigrate and they should consider it likely that they will do so. While four in ten final-year students say they have given ‘a great deal’ of consideration to moving to another country to live and work, it is clear that as more demanding questions about commitment and probability of leaving are asked, the numbers drop ().
To measure emigration potential, the students were first asked which countries they would most probably go to if they ever left South Africa (their ‘most likely destination’ or MLD). They were then asked a series of questions about possible movement to that country. Just over a quarter (28 per cent) said they wanted ‘to a great extent’ to move to their MLD to live and work for two years or more. One in five (21 per cent) said it was ‘very likely’ that they would actually do this. Short-term emigration potential appears to be even higher. Four in ten said they wanted ‘to a great extent’ to go to their MLD to live and work for less than two years. A quarter said that it was ‘very likely’ they would actually go. About one in five said it was ‘very likely’ that they would leave the country within six months of graduation. Smaller numbers said they would leave within two years (15 per cent) and within five years (18 per cent).
Statistical methods of factor and reliability analysis were used to test which of these indicators best helped tap the underlying concept of ‘emigration potential’ in a valid and reliable way (as well as for all subsequent indices). The analysis indicated that the item on leaving within six months should be dropped. An average index of emigration potential was then created, which yields an emigration potential score for each respondent by summing responses across the five items listed in and dividing by five. Because all items had four-point response scales (0–3), the index produces a decimalised average index score for each respondent ranging from 0 to 3 ().
Table 2: Statistics for emigration potential
However, while these scores may be helpful in making finely grained distinctions in emigration potential among students, broader categories are needed to help analyse broad differences among respondents (Mattes & Richmond, Citation2000). Those who gave the most extreme responses to each item in terms of emigration were coded either as having a ‘very high’ emigration potential (3) or ‘no potential’ (0). Students with a score between 2.1 and 2.8 were deemed to have a ‘high’ emigration potential, those between 2 and 1.5 a ‘moderate’ potential and those scoring less than 1.5 a ‘low’ potential.
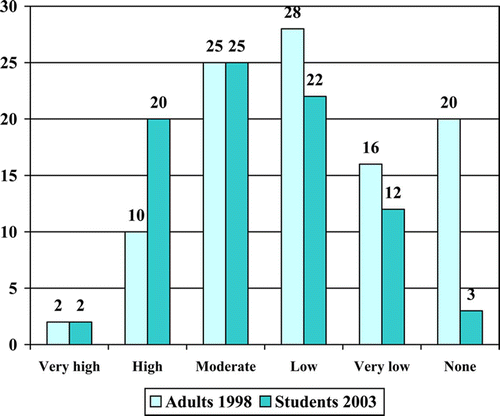
Compared to a 1998 SAMP survey of skilled South African adults, the proportion of students with a ‘very high’ emigration potential is exactly the same (2 per cent). However, twice as many students have a ‘high’ emigration potential (20 per cent) as the adult sample, with a further quarter (25 per cent) having a ‘moderate’ potential (Mattes & Richmond, Citation2000). As many as 20 per cent of skilled adults had ‘zero’ emigration potential, compared to only 3 per cent of the students (). In other words, emigration potential is higher among students than among people already pursuing their chosen profession.
5. THE NATURE oF POTENTIAL SKILLED EMIGRATION
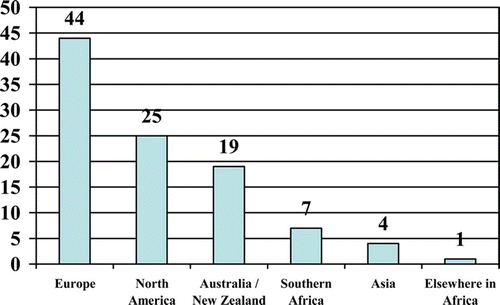
This section now investigates the nature of these emigration plans. Where do students want to go? How long do they want to stay? Will they return? And what will they take with them? Students were first asked: ‘If you were ever to leave South Africa, in which country[s] would you most prefer to go to live?’ (being allowed to list up to three destinations). At over 40 per cent, Europe was the most popular potential destination. Realising that a variety of reasons may prevent people from going to their most preferred destinations, the students were then asked, ‘If you had to leave South Africa, which country would you most likely end up living in?’. Among all respondents, the United Kingdom was the leading preferred destination, selected by almost three in ten respondents (24 per cent said the United Kingdom or England, and another 4 per cent specifically said London). This was followed by the United States (19 per cent), Australia (15 per cent), Europe (7 per cent) and Canada (5 per cent). In total, 42 per cent gave a European destination (including the United Kingdom), 23 per cent North American, 17 per cent Australasian and just 7 per cent southern Africa ().
There are a few important racial differences. Black, white and coloured respondents all agreed that they would most probably end up in Europe, although Indian respondents are significantly less likely to say so. Black respondents were slightly more likely to think they would end up in North America or southern Africa than other students. White students were more likely than others to see Australasia as a likely destination ().
Table 3: Most likely destination (by race) (%)
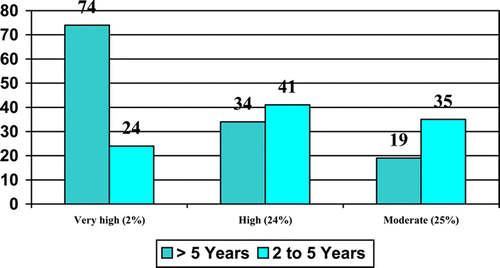
At this stage of their career development, high emigration potential among students does not automatically translate into a permanent skills loss for the country. Among the 2 per cent of all students who definitely want to leave (those with ‘very high’ emigration potential), three-quarters (74 per cent) say they want to stay in their most likely destination for more than five years. However, the one-quarter with ‘high’ emigration potential seem to envisage a more limited stay, at least at first; although 41 per cent of these students said they plan on a stay of two to five years and one-third (34 per cent) that they want to stay more than five years ().
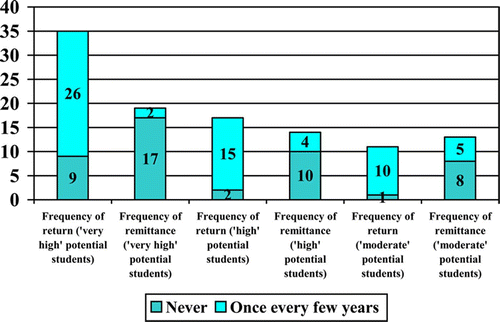
In addition, most respondents with either high or very high emigration potential plan on returning to South Africa on an annual basis. And those most likely to leave still plan on sending money home on a monthly basis ().
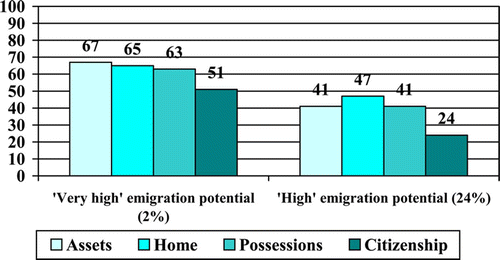
Possibly because younger people have not yet put down firm roots of their own, a large proportion of those students most likely to emigrate appear ready to give up any assets they might have in the country (). Two-thirds of very high potential respondents said they are willing to give up their home in South Africa, as did almost half of the high potential students. Most very high emigration potential respondents would be willing (32 per cent) or very willing (32 per cent) to take all their possessions out of South Africa. High potential students are evenly split on the matter, but all lower categories of emigration potential would be unwilling to do this if they had to relocate. Roughly the same patterns emerged when the question turned to taking all assets out of South Africa, with two-thirds of very high emigration potential respondents willing to do this, compared to only 40 per cent of high potential and 37 per cent of moderate potential students. Finally, while half of the very high emigration potential students said they are willing to give up citizenship, only 24 per cent of the high probability students would do so, and far fewer in all other categories.
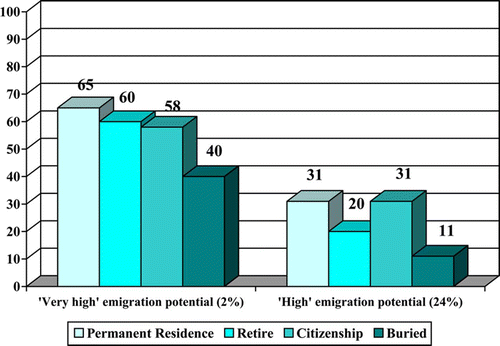
While students may be willing to pull up roots that are not yet deeply planted in South African soil, there are only moderate levels of desire among likely emigrants to put down deep roots in other countries. There is no overwhelming desire for citizenship or permanent residence, and even less for other indicators of a long-term stay. Differences by emigration potential are pronounced, especially when asked about longer-duration stays in the most likely destination. Six in ten very high potential respondents expressed a strong desire to retire in that country, whereas the average respondent in all other categories of emigration potential said they want this hardly at all (). Less than half of the very high potential respondents would want to be buried in their most likely destination (40 per cent), indicating that even among this group most students cannot envisage a total break with South Africa. Most high potential and moderate potential students do not want this at all.
6. EXPLAINING EMIGRATION POTENTIAL
This section examines the causal factors that may increase or decrease emigration potential. Five different ‘theoretical families’ of explanations were tested. First, a series of demographic variables was measured to test whether emigration potential is primarily a function of a student's place in the social structure. For example, are student behaviours and predispositions shaped simply by their racial or ethnic background, their gender or their socio-economic status? Secondly, a set of measures related to social identity was developed, specifically looking at national identity and patriotism and particularly whether emotional ties to South Africa constitute a type of social glue that may inhibit emigration. Thirdly, the impact of a wide range of economic evaluations was tested. Regardless of how strongly they feel about their country, will new graduates leave because of intense dissatisfaction with personal and national conditions? What are students' expectations of their future in South Africa, and their relative comparisons of South Africa with their most likely destination? Fourthly, a series of factors related to experience and information about emigration and the outside world was also tested. Are students with more contact with émigrés or who gather more information about emigration more likely to leave? Finally, the role of logistical factors was examined: to what extent is emigration related simply to the ability to move?
6.1 Social structure
To what extent is emigration potential simply a function of a person's place in South Africa's social structure? Given the country's history, the most obvious starting-point is race. Owing to their loss of dominant political and economic power and perceptions of reduced employment opportunities because of affirmative action, it is widely assumed that white South Africans are much more likely to leave than blacks. A previous SAMP study of skilled professionals found that there was no significant racial difference in the proportions of skilled adults with a very high emigration potential (2 per cent of each group), although there was a noticeable difference among those with a high probability (11 per cent of whites compared to only 6 per cent of blacks) (Mattes & Richmond, Citation2000). Given the racially skewed make-up of the South Africa's skilled population, the absolute number of black respondents was relatively small in that study. The present study provides a larger and more robust sample.
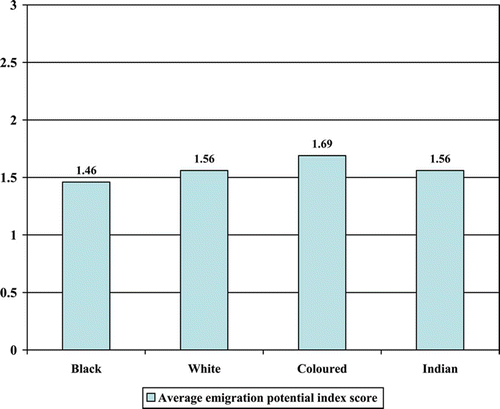
This study found that black emigration potential among students was slightly lower than the midpoint of 1.5, and white emigration potential was slightly higher (). This difference was statistically significant, meaning that the difference in the sample can be generalised to the larger population of all students. However, given that the emigration potential scale runs from 0 to 3, these differences are substantively trivial. In comparison with the many different factors reviewed throughout this article, a respondent's racial background provides us with little help in distinguishing between those with high and low emigration potential (eta = 0.087, P = 0.002).
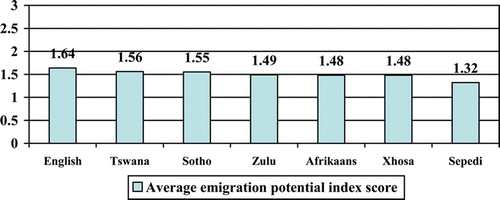
There was also a statistically significant difference according to home language, with English speakers (1.64) registering the highest emigration potential and Shangaan speakers the lowest (1.29) (); again, these substantive differences between different language groups are very small (eta = 0.120; P = 0.003).
In fact, there are few meaningful differences across a range of demographic factors, including gender (eta = 0.041; P = 0.065). And while one might expect that students from wealthier backgrounds would have more economic freedom to leave, there were only small differences according to self-reported class background of student. Students who said they were from ‘upper middle class’ families have a significantly higher emigration potential (1.59 on a scale of 0–3) than those from ‘working class’ (1.52) or ‘lower class’ (1.47) backgrounds (eta = 0.112; P = 0.000). Students from rural backgrounds (1.43) or small towns (1.43) are less likely to emigrate than those who come from urban areas (1.61), but again the difference is not very large (eta = 0.109, P = 0.000).
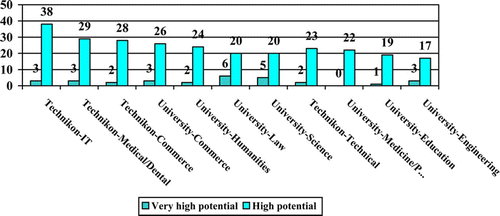
There is some evidence that particular courses of study make some students think that they are more attractive on the international job market. Popular perception is that medical students are the most likely to leave. However, the results demonstrate that those pursuing final-year studies in computer science/information technology at technikons (1.73) and studying in medical or dental faculties at technikons (1.74) are the most likely to want to leave. Students in nursing training colleges display the lowest emigration potential (1.29). Students studying in university faculties of medicine or pharmacy (1.53) have an average emigration potential. However, these differences across degree paths–again–are not very large (eta = 0.169; P = 0.000. Those studying information technology at university are also more likely to leave (1.81), but there are only 20 cases in this category, insufficient for reliable analysis). Finally, students at technikons have a significantly higher emigration potential (1.63) than university (1.48) or nursing college (1.29) students.
6.2 National identity
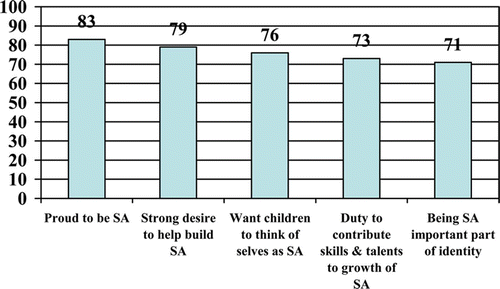
Common wisdom holds that South Africa's brain drain would be much lower if skilled South Africans were more patriotic, with higher levels of national identity. This study found that the bulk of South African tertiary students actually exhibit a high degree of national identity and patriotism (see ). Eight in ten agreed they were proud to be called South Africans (83 per cent) and had a strong desire to help build South Africa (79 per cent). More than two-thirds wanted their children to think of themselves as South Africans (76 per cent) and felt they had a duty to contribute their talents and skills to the growth of South Africa (73 per cent). Seven in ten agreed that being a citizen of South Africa was a very important part of how they see themselves. At the same time, these levels of national identity were substantially lower than those measured among ordinary adult South Africans, where more than nine in ten have consistently registered strong levels of national identity since 1994 (Mattes, Citation2003). Whether younger, more educated people are inherently less likely to exhibit very high levels of patriotism, or whether these results portend a slow, secular decline in patriotism in the future, is a subject for future research.
The pattern of responses to these questions can be used to form a single reliable index that measures ‘patriotism’ (these five items have an eigenvalue of 3.14 and explain 62.8 per cent of common variance; reliability (Cronbach's alpha)=0.85). While there was little difference by race group in terms of emigration potential, the study did find substantial differences between racial groups, with white final-year tertiary students exhibiting far lower levels of patriotism (3.74 on a scale of 1–5) than black students (4.43), with coloured (4.07) and Indian (3.98) students in between (eta = 0.435; P = 0.000). Yet responses to two other questions suggest that even though they feel patriotic towards South Africa, students in a globalising world have competing loyalties. Just 17 per cent disagreed with the statement that you ‘have more in common with people from other countries working in your profession than with people from South Africa’ (although only 38 per cent agreed, with the balance saying they neither agreed nor disagreed). Six in ten agreed that ‘it really does not matter where you are a citizen as long as you have a good quality of life’, and just one in five disagreed.
Some maintain that South Africans from minority groups (white, coloured and Indian) will leave the country because, although they personally feel strongly about their South African identity, they also feel that they do not have a real role to play in the new South Africa. However, just 3 per cent said that people of their race, people who speak their language, or they themselves have ‘no role at all’ to play ‘in the future of South Africa’ and another 9–10 per cent answered that they have only a ‘minor role’. Because these three items tap a common underlying dimension, they were combined to create an index of ‘perceptions of a future role in South Africa’ [these three items have an eigenvalue of 2.06 and explain 68.7 per cent of common variance; reliability (Cronbach's alpha)=0.77]. While students across all racial groups tend to see a role for themselves in the future of the country, black students are more enthusiastic (a mean of 2.62 on a scale of 0–3) than coloured (2.34), white (2.23) or Indian (2.21) students (eta = 0.295; P = 0.000).
Each of these sets of attitudes matters in terms of emigration potential. Respondents with higher levels of patriotism have substantially lower emigration potential (Pearson's r, a product–moment correlation coefficient = −0.235). The more a student feels they have a role to play in the future of the country, the lower the emigration potential (r = −0.130). Whether students feel closer to their national than their professional identity (−0.121) or emphasise national identity over quality of life (−0.171) also contributes to lower emigration potential (all correlations significant at P = 0.000).
6.3 Economic evaluations
The study measured student perceptions of a range of features of life in South Africa by asking about present satisfaction with personal and national economic conditions, and then asking students whether they thought conditions in South Africa would be better or worse in five years time across a wide range of specific features of national life. Finally, they were asked to assess whether each factor would be better in South Africa or in their most likely destination.
Half of all students (47 per cent) were dissatisfied with their present personal economic conditions. However, 82 per cent expected that their personal economic conditions would be better or much better in five years. About half felt that their level of income would be better. Six in ten were dissatisfied with current national economic conditions, but 47 per cent felt things would get better in five years' time. Only 27 per cent said they would get worse.
However, once the students were asked what they thought things would look like in South Africa in five years time across a broad range of factors, perceptions were decidedly more pessimistic. For example, 80 per cent said the HIV/AIDS situation would be worse and two-thirds felt the cost of living would get worse. Six in ten predicted that their ability to find the job they want (58 per cent), their personal safety (58 per cent) and their family's safety (58 per cent) would all be worse than they are today. Half foresaw deterioration in the upkeep of public amenities and 40 per cent expected things to deteriorate with regard to availability of affordable quality products, job security, level of taxation and children's future.
On no single item was there a preponderance of optimistic expectations, but there was more variation with regard to expectations about finding the house they want (36 per cent said things would be worse in five years, but 28 per cent said they would be better), a good school for their children (35 per cent worse, 32 per cent better), medical services for their family (36 per cent worse, 31 per cent better), the future quality of customer service (32 per cent worse, 31 per cent better) and their own prospects for professional advancement (31 per cent worse, 30 per cent better). Perhaps most important of all, only 41 per cent felt that it would be easy or very easy for them to find a job in their field of study after graduation. Eight in ten (81 per cent) felt the government had not done enough to create jobs for graduates.
The responses to fifteen of these items followed a sufficiently similar pattern to allow for the creation of a single index that measures ‘pessimistic expectations of quality of life’ [the single scale composed of these 15 items has an eigenvalue of 8.12 and explains 54.2 per cent of the common variance; reliability (Cronbach's alpha)=0.94]. The two items on safety obtained different patterns of response and were used to construct a separate index of ‘pessimistic expectations of safety’ (the correlation between these two items is an almost perfect 0.96, with reliability = 0.98).
The study found that pessimistic expectations of quality of life are indeed positively correlated with higher degrees of emigration potential (r = 0.181), as are pessimistic expectations of safety (r = 0.160) (both correlations are significant at P = 0.000). However, emigration potential is only weakly associated with personal economic dissatisfaction (r = 0.061; P = 0.006) and national economic dissatisfaction (r = 0.063; P = 0.005). There is no statistically significant link between emigration likelihood and whether or not one thinks it will be easy to find a job (Pearson's r = −0.061; P = 0.06), personal economic pessimism (Pearson's r = −0.024; P = 0.282) or dissatisfaction with government efforts to create jobs (Pearson's r = 0.032; P = 187).
Regardless of whether students expect conditions in South Africa to get worse, they would have no reason to leave if they consider that conditions here are still are better than elsewhere. Thus the students were asked whether conditions would be better in South Africa or in their most likely destination. Overall, the results indicate that a large number of final-year students indeed see the grass as being much greener on the other side. A massive three-quarters of students are certain that they would enjoy a higher income in their most likely destination. Solid majorities said things would be better elsewhere in terms of their prospects for professional advancement (59 per cent), their ability to find a desired job (56 per cent) and their job security (54 per cent). Roughly four in ten felt that the cost of living (41 per cent) would be better elsewhere and they would also pay a fairer level of tax (41 per cent). These six items form a scale that measures ‘relative comparisons of financial prospects’ [the scale created by these six items has an eigenvalue of 3.00 and explains 50.0 per cent of the common variance; reliability (Cronbach's alpha)=0.80].
About half the students consider that their ability to find good quality medical services for their family (55 per cent) and a good school for their children (50 per cent) would be better elsewhere. Opinion is more evenly divided when it comes to their expected ability to find a good house (37 per cent say it would be better elsewhere, but 27 per cent say it would be better in South Africa). Overall, just under half felt that their children would have a better future in their most likely destination than in South Africa. Responses to these four items form a separate scale that measures ‘relative comparisons of family prospects’ [the scale created by these four items has an eigenvalue of 2.55 and explains 63.7 per cent of common variance; reliability (Cronbach's alpha)=0.81]. Two-thirds felt that public amenities would be better maintained elsewhere (65 per cent), and that the HIV/AIDS situation would also be better (63 per cent). Majorities also expected to have an easier time finding affordable quality products (57 per cent) and quality of customer service (54 per cent) in their most likely destination. These four items form a scale that measures ‘relative comparisons of quality of life’ [the scale created by these four items has an eigenvalue of 2.56 and explains 63.6 per cent of common variance; reliability (Cronbach's alpha)=0.81]. Finally, two-thirds thought that they (66 per cent) and their family (65 per cent) would be safer elsewhere. These items form a separate index of ‘relative comparisons of safety’ [the two items are almost perfectly correlated (0.94) with a reliability (Cronbach's alpha) of 0.97].
Students' emigration potential increases predictably as they conclude that they would enjoy better financial prospects (r = 0.280), better family prospects (r = 0.261) and a better quality of life (r = 0.220), and will be safer in their most likely destination (r = 0.179). Finally, emigration potential increases sharply to the extent that students believe that émigrés lead better lives in their new countries (r = 0.271) and less so to the extent they feel that émigrés' skills have been optimised (r = 0.147; all correlations are significant at P = 0.000).
6.4 Information and experience
Beyond people's emotional attachment to their own country or their rational assessments of conditions in their own country and their target destinations, another factor that may shape emigration potential is simply their level of information about and contact with the act of emigration.
6.4.1 Personal experience with emigration
Large numbers of the students interviewed reported at least some direct or indirect experience with emigration. Six in ten said that they knew at least one fellow student or colleague (58 per cent) or close friend (58 per cent) who had left the country permanently. Half of all students had had at least one member of their extended family (46 per cent) emigrate, and a quarter said that someone in their immediate family (24 per cent) had done so. These four items tap a single underlying dimension of ‘personal contact with emigration’ [the scale created by these four items has an eigenvalue of 2.28 and explains 60 per cent of common variance; reliability (Cronbach's alpha)=0.75]. Emigration potential is modestly related to the extent that students know people who have already emigrated (r = 0.219; all correlations are significant at P = 0.000).
6.4.2 Personal experience abroad
Must students make their decision on the basis of an idealised or romanticised vision of what life is like on the other side, or have they actually spent meaningful time in the countries they say are their most likely destination? To what extent are these student's views of emigration and the outside world based on real experience (through travel) rather than vicarious experience via the stories they hear from departed friends and families, or through the news media?
In their 1998 study of skilled adults, Mattes & Richmond (Citation2000:33) found that South Africans tended to form preferences about emigration that had little do to with whether or not they themselves had ever been out of the country to visit the places to which they dreamt of moving. Their study found that extremely small proportions travelled regularly (once a year or more) to other African countries (3 per cent), Europe (7 per cent), North America (3 per cent), Australia and New Zealand (2 per cent) or Asia (1 per cent). In contrast, South Africa's tertiary students have far higher levels of regular contact with Africa (34 per cent travel to southern Africa at least once a year, and 8 per cent do so elsewhere in Africa), but regular contact with frequently listed probably destinations such as Europe (4 per cent), North America (2 per cent) or Australia or New Zealand (1 per cent) is just as low as it was for the adults.
These items form two distinct scales of ‘African travel’ (southern Africa, and elsewhere in Africa) [these two items are moderately correlated (0.38) with reliability (Cronbach's alpha)=0.50] and ‘overseas travel’ (to Europe, North America, Australasia and Asia)]. Perhaps, contrary to expectations, emigration potential is only weakly related to the extent to which students travel in Africa (0.068; P = 0.003) or overseas (0.077; P = 0.001).
6.4.3 Information about the outside word
A number of questions were asked about various ways of acquiring information, which created three composite measures. A quarter of the students interviewed say they ‘often’ obtain information about job opportunities from family (23 per cent) or co-workers (24 per cent) and one-third say they ‘often’ obtain information from fellow students (37 per cent). Approximately one in three say they obtain information about living conditions from co-workers (30 per cent) or their family (33 per cent) and half obtain it from friends or fellow students (48 per cent). These items form a valid and reliable scale of ‘obtaining information about life abroad through personal networks’ [the scale created by these six items has an eigenvalue of 3.21 and explains 53.5 per cent of common variance; reliability (Cronbach's alpha)=0.83]. While half say they ‘often’ obtain information about job opportunities about from newspapers and magazines (48 per cent), less than one in five obtain it from television or radio (17 per cent). Half often obtain information about living conditions from newspapers and magazines (53 per cent), but in contrast to job opportunities, six in ten say they ‘often’ obtain information about living conditions in other countries through television or radio (60 per cent). These four items form a separate scale of ‘obtaining information: life abroad through news media’ [the scale created by these four items has an eigenvalue of 1.99 and explains 49.8 per cent of common variance; reliability (Cronbach's alpha)=0.66].
Finally, 45 per cent seek information about job opportunities and 44 per cent about living conditions through the internet. These two items form a distinctive composite scale of ‘obtaining information about life abroad through the internet’ [these two items are strongly related (0.68) and form a very reliable construct (Cronbach's alpha = 0.81)]. There is a modest relationship between higher levels of emigration potential and higher frequency of seeking out information about conditions abroad via the internet (r = 0.216), personal networks (r = 0.213) and news media (r = 0.149).
6.5. Logistics
Finally, to what extent does emigration hinge on the simple issue of whether people are able to plan to move or afford to move? Large numbers do seem to think that emigration would not present insurmountable obstacles. More than half of all final students believe that it would be ‘easy’ or ‘very easy’ to get a job (54 per cent) in their most likely destination if they wanted to. Forty-three per cent say it would be easy to leave the country to work in their most likely destination; and one-third (32 per cent) believe that the costs of moving to that destination and finding a good home would be affordable. Notably, half (52 per cent) say that it would be unaffordable or very unaffordable. These three items tap a common underlying dimension that can be called ‘ease of leaving’ [the scale created by these three items has an eigenvalue of 1.69 and explains 56.5 per cent of the common variance; reliability (Cronbach's alpha)=0.66]. A psychological element of logistics would simply be the extent to which people may feel they have the support of loved ones in making this move. Four in ten final-year students say that their family would encourage them to leave South Africa (45 per cent); just one in five (19 per cent) say their families would discourage emigration. As expected, those who feel that leaving South Africa would be easy and affordable have considerably higher emigration potential than those who think the effort would be daunting (r = 0.236; P = 0.000). Emigration potential increases sharply to the extent that students say their families would encourage them to leave South Africa (r = 0.394).
7. MULTIVARIATE ANALYSIS
We have reviewed the bivariate connections between the possible factors that may help us account for and explain variations in emigration potential. We now use multivariate regression to test which of these factors remain as important predictors once we consider all other factors simultaneously. We use ‘blockwise entry’ and enter in theoretical ‘families’ of variables in groups to help us understand which set of factors contributes most to our understanding of emigration potential.
We arrive at a relatively parsimonious model that explains 31 per cent of emigration potential, a relatively strong result given that we are measuring the experiences of widely varying types of students across very different types of educational institutions. The single strongest predictor of emigration potential is simply whether or not students feel that their families would encourage or discourage their decision to move (beta; the standardised regression coefficient = 0.289, explaining on its own 19 per cent of the variance of emigration potential). Students' perceptions about the fortunes of those who have already moved are the second strongest set of predictors; particularly the belief that émigrés lead better lives (beta = 0.127) and that they are working in the areas for which they were trained (beta = 0.095) (see ).
Table 4: OLS estimates of predictors of emigration potential
Relative economic assessments and national identity have approximately equal impacts on emigration potential, though they work in the opposite directions. The belief that family prospects would be better in a student's most likely destination than in South Africa increases emigration potential (beta = 0.132), while a sense of patriotism (−0.098) and a belief that where one lives is more important than qualify of life (−0.056) serves to decrease emigration potential.
Finally, logistic and informational factors have about equal impact. The more one seeks information from the internet about the living conditions and job opportunities abroad (beta = 0.139) and regularly travels internationally (0.047), the greater one's probability of emigrating. [We could entertain plausible arguments that seeking information from the internet is as much a consequence of the decision to emigrate as a cause. If this variable is omitted, a third identity variable (whether people value national identity more than occupational identity) remains in the model but the overall explanatory strength of the model is slightly weaker (adj. R2 = 0.29]. The more one thinks that emigration would be manageable and affordable (0.084), the more likely one is to emigrate.
Once all these factors are taken into consideration, no structural factor (such as race, gender, language or social class) has any statistically significant impact. Moreover, there was virtually no evidence of any of the so called ‘push factors’ widely supposed to be propelling South Africans out of the country, such as crime, economic pessimism, falling standards, mismanagement or HIV/AIDS (e.g. Van Rooyen, Citation2001). [While this is usually based on popular wisdom, some systematic attempts have reached the same conclusions because they have only asked those who have already left the country and thus miss the fact that those who have not left also mention the same problems (Haldenwag, Citation1996; STATSSA, 1998)].
Rather, it seems they are being ‘pulled’ out by some factors in their identified target destinations. However, these factors are not primarily the simple material gains of better jobs, higher salaries and living standards often supposed by migration theorists (e.g. Aderinto, Citation1978) or the fulfilment of occupational or professional aspirations (Weis, Citation1998). It is true that students are much more likely to emigrate if they believe that émigrés lead better lives abroad (beta = 0.127) and that their skills are being optimised (beta = 0.095); but the most important factors are students' forecasts of whether their family's prospects would be better elsewhere than in South Africa in terms of such issues as finding good schools and houses and good quality medical services.
8. POLICY IMPLICATIONS
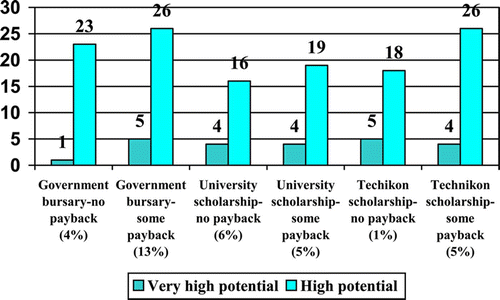
What kinds of investments does the South African government stand to lose if likely emigrants do in fact leave? According to students' present dispositions, the South African government would lose about 1–2 per cent of final-year students with bursaries that require no repayment, and approximately 5 per cent of those that require some repayment (). Universities and technikons also stand to lose about 5 per cent of their investments in bursaries. However, these numbers would rise dramatically to as high as one-quarter to one-third of government bursaries if the ‘high’ potential emigrants also left.
With regard to investments in specialised technical training, a great deal of public attention has focused on the impacts of skilled emigration on the medical profession. The survey results indicated that the greatest losses may in fact be among certain sectors of technikon-trained students, especially those training in Information Technology ().
Faced with significant emigration, it is understandable that governments are inclined to try to limit emigration through restrictive policies. Most analysts feel such policies are likely to hasten the rate of emigration even further. The data collected by this survey tend to support such conclusions. First of all, students with study bursaries were asked whether the conditions of those bursaries required them to remain in the country after they completed their studies and/or to work specifically in either the public or private sector. Twenty-two per cent of all students had such a bursary. While these students do have a lower emigration potential than others, the difference is very small, suggesting that these restrictions have a minimal effect on student plans and calculations (eta = 0.072; P = 0.001).
Secondly, they were asked whether they felt a range of potential government interventions to restrict emigration were justifiable. For example, one type of government intervention is a requirement that students perform some form of national service in return for their education. Since 2001, the Department of Health has required final-year medical students to carry out a year of community work. The ANC argued in its 2002 Party Conference Manifesto that this should be broadened to include other health professionals and higher education. The survey results suggest that if handled well, and if specifically required of those students who had received some form of bursary, restrictions would not meet with massive resistance or make students more likely to leave. Just 18 per cent said the government would not be justified in requiring those who have received government bursaries to complete some form of national service in return for their bursary. High emigration potential students were no more likely than others to think so (tau b = 0.033; P = 0.073).
However, students would be far more opposed to other types of interventions. Half the students felt that requirements that students complete some form of national service before they began tertiary education would not be justified. Fifty-three per cent said requiring citizens to work in the country for several years after graduation was not justified, with higher emigration potential students especially opposed (tau b = 0.146; P = 0.000). Nearly six in ten (57 per cent) said that limiting the amount of money they could send out of the country was not justified, with higher emigration students more likely to resent this (tau b = 108; P = 0.000); and 60 per cent said that making people pay taxes on income earned outside the country was not justified, again with high emigration potential students especially opposed (tau b = 0.146; P = 0.000).
Finally, students were asked whether some other possible interventions would make them less or more likely to leave. Their answers showed that requiring students leaving professional schools to perform a year of national service in their area (tau b = 0.220; P = 0.000), limiting people to one passport (tau b = 0.199; P = 0.000) or increasing fees for emigration documents (tau b = 0.199; P = 0.000) would make it more, or much more, likely that the very high and high emigration potential students would leave, as would any government steps to make emigration more difficult (tau b = 0.230; P = 0.000).
In contrast, students feel there are far more effective ways to limit emigration. Three- quarters agree that development and growth in South Africa would reduce emigration and six in ten agreed that measures to encourage the return of skilled nationals living abroad would also reduce it. However, only just over one-quarter think legislation limiting the ability of state-trained students to emigrate would actually reduce emigration, and students with higher emigration potential were even less likely to think so (tau b = -0.090; P = 0.000). Just over one-fifth said that South Africa's efforts to discourage other governments from employing South African emigrants would reduce emigration. Finally, just 20 per cent thought a legal prohibition on emigration would reduce the outflow of people.
9. CONCLUSIONS
Whether South Africa is able to retain its future skills base is a far more complex matter than simply reducing crime to satisfy ‘whingeing’ white students or training more black (and presumably more patriotic) students. First of all, there are many factors that fall outside the government's direct control. Short of resorting to draconian measures, for example, there is no chance of limiting curious students' international travel or their use of the internet to find out about the quality of life in Australia, or of forbidding students to communicate with their relatives who have moved to the United States. Rather, the government must make proactive use of both its ability to set economic policy and the impressive resources of public communications at its command to demonstrate to highly skilled–and thus highly marketable–young South Africans from all backgrounds (as well as to their families who offer them valued advice and support) that the country offers people such as themselves a bright future for their families, including good quality schools and medical services and affordable housing, and that they will have ample opportunities to put their skills to full use and be rewarded accordingly. Such a positive approach promises to retain far more students than the negative, lecturing and restrictive approach that the government has adopted to date.
Notes
1Respectively, Professor, Department of Political Studies, and Director, Centre for Social Science Research, University of Cape Town; and Researcher, Department of Political Studies and Centre for Social Science Research, University of Cape Town.
REFERENCES
- Abella , M . 1997 . Sending workers abroad , Geneva : International Labour Organisation .
- Aderinto , A . 1978 . “ Toward a better understanding of brain drain ” . In Human resources and African development , Edited by: Damachi , U G and Diejomaoh , V P . New York: Praeger .
- Bhorat , H , Meyer , J B and Mlatsheni , C . 2002 . Skilled labour migration from developing countries: study on South and Southern Africa , Geneva : International Labour Organisation . International Migration Papers no. 52
- Brown , M , Kaplan , D and Meyer , J B . 2002 . “ The brain drain: an outline of skilled emigration from South Africa ” . In Destinations unknown: perspectives on the brain drain in southern Africa Edited by: McDonald , D and Crush , J . 113 – 38 . Pretoria and Cape Town: Africa Institute and Southern African Migration Project
- Commander , S , Kangasniemi , M and Winters , L . 2003 . “ The brain drain: curse or boon? ” . In Challenges to globalisation , Edited by: Baldwin , R and Winters , L . Chicago : University of Chicago Press .
- Crush , J . 2002 . The global raiders: nationalism, globalization and the South African brain drain . Journal of International Affairs , 56 : 147 – 72 .
- Dumont , J C and Meyer , J B . 2004 . “ The international mobility of health professionals: an evaluation and analysis based on the case of South Africa ” . In Trends in International Migration , Paris : OECD Publishing .
- Haffajee , F . 1998 . Exit the middle classes . Mail & Guardian , 22 September
- Haldenwag , B . 1996 . Migration processes, systems and policies , Stellenbosch : University of Stellenbosch Press .
- Khadria , B . 2002 . Skilled labour migration from developing countries: study on India , Geneva : International Labour Organisation . International Migration Papers no. 49
- Martin , P and Widgren , J . 2002 . International migration: facing the challenge . The Population Bulletin , 57 ( 1 ) : 5 – 39 .
- Mattes , R . 2003 . “ Towards an understanding of African identity ” . In SA tribes: who we are, how we think and what we want out of life , Edited by: Burgess , S . Cape Town : David Philip, pp. 82–97 .
- Mattes , R and Richmond , W . 2000 . “ The brain drain: what do skilled South Africans think? ” . In Destinations unknown: perspectives on the brain drain in southern Africa , Edited by: McDonald , D and Crush , J . 17 – 46 . Pretoria and Cape Town : Africa Institute and Southern African Migration Project .
- Meyer , J B . 2001 . Network approach versus brain drain: lessons from the diaspora . International Migration , 39 : 91 – 108 .
- Stalker , P . 2000 . Workers without frontiers: the impact of globalization on international migration , Boulder : Lynne Reiner .
- STATSSA (STATISTICS SOUTH AFRICA) . 1998 . “ Statistical Release ” . In Tourism and migration: 1994–1996 , Pretoria : Statistics South Africa .
- Van Rooyen , J . 2001 . The new Great Trek: the story of South Africa's white exodus , Pretoria : UNISA Press .
- Weis , T . 1998 . “ Addressing the brain drain: the return and reintegration of qualified African nationals programme ” . In Labour markets and migration in southern Africa , Edited by: Sachikonye , L M . Harare : SAPES (Southern Africa Political Economy Series) Trust .
- Wimaldharma , J , Pearce , D and Stanton , D . 2004 . Remittances: the new development finance? . Small Enterprise Development Journal , 15 ( 1 ) : 1 – 8 .
