Abstract
The Financial Diaries data-set is a unique, new set of year-long daily income, expense and financial transactions for households from three different areas of South Africa. These data show that over-indebted households (those that spend 20 per cent or more of their gross monthly income on debt) do not fit one homogeneous profile. Formal debt tends to be responsible for over-indebtedness in the urban areas, while in the rural areas the cause tends to be informal debt. In the urban areas high indebtedness is more prevalent among medium-income and high-income households, whereas in the rural areas it occurs at all income levels. High indebtedness in grant-dependent rural households tends to be persistent, whereas in wage-dependent urban households it is often short-lived. These findings present a new financial picture of poor rural populations that is unlikely to be touched by recent policy measures to address over-indebtedness.
1. INTRODUCTION AND REVIEW OF THE LITERATURE
Indebtedness is a concern to financial service providers and regulators alike. In South Africa, a new National Credit Act came into effect in June 2007, to improve what is seen as the high level of indebtedness among South African households. However, this legislation is likely to address only a portion of highly indebted households – those in the wage-dependent, largely urban population. This paper suggests that indebtedness among rural, unsalaried households is pervasive, persistent and far less easily remedied legislatively.
The most significant studies yet performed on indebtedness in South Africa differ in their assessment of whether indebtedness in the lowest income categories is a cause for concern. A Department of Trade and Industry Citation(2000) study based on data from the PERSAL (government payroll) system showed that the increased level of formalisation of the micro lending sector has created higher levels of consumer debt. They cite a 57 per cent increase in the level of indebtedness of individuals with loans on the system between July 1999 and February 2000. A follow-up study (Daniels, Citation2001) based on the National Income and Expenditure Survey (Statistics South Africa, Citation1995) helps put the PERSAL data into perspective by including income and expenditure data representative of all South African and not just government employees. Daniels's analysis shows that households at the bottom end of the income spectrum (R0–R5000 per annum) have lower levels of indebtedness than those in the middle or at the top. He concludes that, based on this evidence, although the poor may have a high demand for debt, they do not necessarily have access to credit.
However, the Human Sciences Research Council (HSRC, Citation2003), also using data from the Income and Expenditure Surveys (Statistics South Africa, Citation1995, Citation2000), paints a less benign picture. They show that although the number of households with positive debt is smaller at the lower income levels, debt levels were rising faster in the lower income categories than in the wealthier ones. They also point out that the debt-servicing burden for indebted households is very much higher for those in the lowest income category, and that growth in the number of over-indebted households between 1995 and 2000 was highest in this category. On the other hand, the HSRC report also shows that a sizable, and growing, portion of this debt comes from loans from family, while a smaller, and shrinking, portion comes from retail credit. This is quite different from the debt composition of households in the next highest income category (R5000–R15 000), where debt levels are also rising but are more dominated by retail and furniture credit. One could therefore argue that the indebtedness of the lowest income levels is less of a concern than the tiers above it, as family debt may arguably be seen as easier to reschedule and possibly comes with lower, if any, interest rates.
Do these studies give us all the information we need if we want a conclusive view of indebtedness in the lower income ranges of South Africa's population? Analysis using national surveys potentially misses several important aspects of South African indebtedness. First, national surveys are conducted using questionnaires that are administered in a single interview with each household at a single point in time. They do not give us the dynamic story of how and why households became indebted and whether their debt situation is persistent or temporary. Unusual circumstances may temporarily put someone into short-term debt, only to recover within months to a healthy debt-to-income ratio, and a one-off survey would miss this. Second, single interview surveys, particularly those designed to capture a large amount of information about the households in addition to their financial situation, are not finely tuned to capture the dynamics of informal finance, which can often be as important as formal finance for poor households, if not more so. Because these sources of debt are easily missed, analysis based on this kind of survey data may erroneously suggest that debt levels in the lowest brackets of income are either low, or come from what may be assumed to be innocuous sources, such as family.
Yet, for the poorest households, these two aspects of financial dynamics are likely to hold much of the story. Rutherford Citation(1999) points out that the poor find it difficult to save money not only because of the constraints they have on their budgets, but also because it is difficult to find a place where money is safe. He speaks of safety not only from theft and deterioration, but also from the many claims on it from the household itself (i.e. if there is no safe place to save money, it somehow gets spent on trivial things), and from family and friends in need. With such a difficult environment challenging saving, borrowing options become more important. Both Rutherford Citation(2002) and Ruthven Citation(2002) – using data from Bangladesh and India, respectively – found that most large lump sums of money raised by poor households were from credit rather than savings, and that most of these sums were raised in informal environments, such as moneylenders and small shops. These are sources that are unlikely to be picked up by a one-off survey, but may drastically change the picture we have of indebtedness at the lowest income levels.
2. CONTRIBUTION FROM THE FINANCIAL DIARIES
The Financial Diaries is a data-set that can fill in these missing gaps. The emphasis in the Financial Diaries is on understanding poor households in detail rather than relying on a broad sample to make conclusions about the South African population. The sample consists of 152 households in the low-income areas of Langa, Cape Town (urban), Diepsloot, Johannesburg (peri-urban), and Lugangeni, Eastern Cape (rural).Footnote1 The households were seen every other week over a period of 13 months from November 2003 to December 2004. For each interview, a household-specific questionnaire was generated, designed specially to capture a reconciled account of all income, expenditure and financial flows. These detailed household cash flows were complemented by an open-ended qualitative questionnaire designed to understand the current circumstances facing the household on a week-by-week basis. Further detail of the sampling method and the Diary methodology for data collection are discussed in Collins Citation(2005) or can be found online (www.financialdiaries.com).
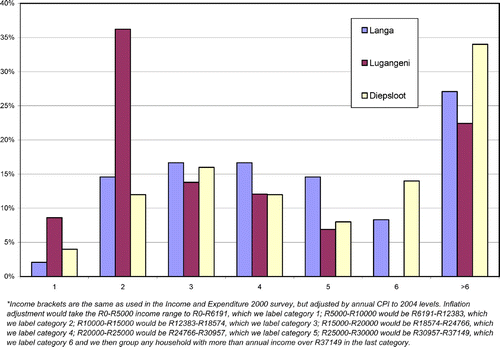
To show how these households would compare with those interviewed in the 2000 Income and Expenditure Survey (IES), we created the same income ranges as the IES, adjusting the annual income figures for inflation between 2000 and 2004. To avoid confusion, rather than label income ranges with values, we assign each a number. shows the distributions for each area of the Financial Diaries study. Note that most of the households are spread below the R37 149 annual income range, in the income categories where the HSRC report found most cause for concern.
Figure 1: Distribution of households in income brackets comparable with the IES 2000 survey (percentage of sample households in each income bracket*)
Using these data, the present paper contributes to the picture of indebtedness presented by national surveys by:
| • | considering all forms of debt, including formal debt – loans, accounts, store cards, debts under administration and wage advances, and informal debt – mashonisa (informal moneylender) loans, one-on-one loans, stokvel loans and credit at the local spaza shop; | ||||
| • | measuring indebtedness against a backdrop of all forms of income, including regular (net and gross) wages, casual work, business profits, rental income, remittances and social grants; and | ||||
| • | calculating measures of indebtedness over the period of 13 months during which the households were interviewed. | ||||
3. INITIAL FINDINGS FROM THE FINANCIAL DIARIES
3.1 Indebtedness is not endemic, but pockets of indebtedness are substantial
Much of the literature on indebtedness considers a person to be in a state of ‘over-indebtedness’ when he or she has a consumption debt greater than 20 per cent of annual income. The Financial Diaries data-set uses the 20 per cent benchmark for monthly debt servicing payments over monthly income to define over-indebtedness, but a number of caveats apply to making direct comparisons with the HSRC findings or any others. For example, the HSRC used data from the IES, which surveyed only households with positive debt, whereas the Financial Diaries data considers all 152 households in the sample. The HSRC also used only direct (and therefore more formal) estimates of income, whereas the Financial Diaries data consider all forms of income. The HSRC debt-servicing estimates were derived from data on outstanding debts, whereas the Financial Diaries data are based on actual payments rather than assuming that households make these payments.
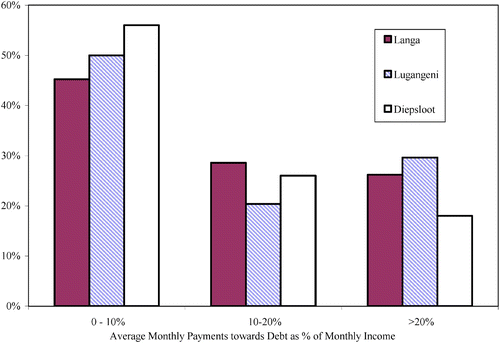
Using the 20 per cent benchmark, it appears that over-indebtedness is not endemic to this sample. Across all areas, roughly one-half of the households allocate very reasonable levels of their monthly income to debt repayment, between 0 and 10 per cent. However, there is still a substantial pocket of high indebtedness across all areas. In Langa, about 27 per cent of households are over-indebted, while in Lugangeni the figure is close to 30 per cent. In Diepsloot, a small 16 per cent of households are over-indebted (see ).
3.2 Indebtedness is correlated with income in the urban areas, but not in the rural areas
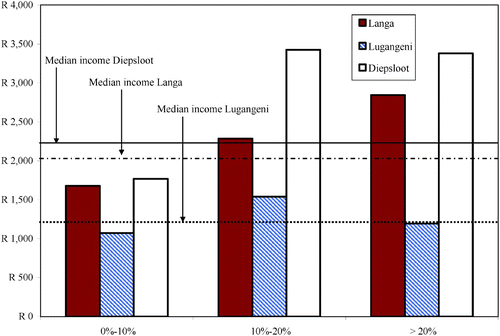
A significant divergence between urban and rural indebtedness is the difference between the income profiles of a highly indebted household and the area average. In Langa and Diepsloot the median income of highly indebted households is higher than the area median, but in Lugangeni it is roughly in line with the median of the entire rural sample. This suggests that while the wealthier households in the urban and peri-urban areas bear the largest percentage of debt, high indebtedness is not restricted to the higher income households in rural areas (see ).
Does the connection we observed between income levels and debt relate to the formality of employment? In the urban areas, the ties between having a formal job, with a payslip, and being over-indebted are very strong. In Langa, with the exception of one household, which was indebted due to one-on-one loans and stokvel loans, highly indebted households rely on regular wages for at least 75 per cent of their income.
3.3 Over-indebtedness is driven by formal credit in the urban areas and informal credit in the rural areas
The profile of types of debt also differs markedly between urban and rural settings. In Langa it is primarily store-card credit that results in high debt payments for highly indebted households, with informal debt counting for very little of the debt payments of highly indebted people. In Diepsloot, formal loan repayments to either a bank or a cash loan made up roughly 37 per cent of a highly indebted household's debt payments every month. Also high (26 per cent) was the percentage of debt payments that went to retail credit accounts or lay-bys (see ).
Figure 4: Highly indebted households only – types of debt payments (percentage of average monthly debt payments)
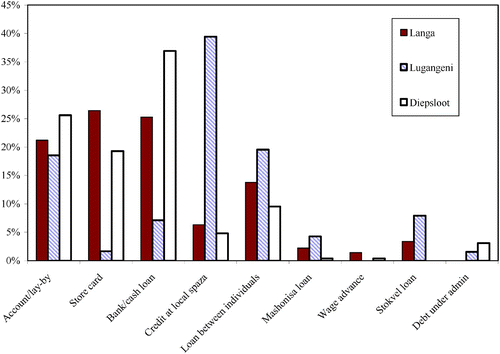
In Lugangeni the story is quite different, with credit at the local spaza shop dominating the credit portfolios of the Financial Diaries sample. This kind of credit makes up 39 per cent of a highly indebted household's debt payments every month, followed by 19 per cent that consists of repaying loans from family and neighbours. Moreover, credit at spaza shops in Lugangeni can carry high, and non-transparent, costs. One of the rural respondents told us that even the high interest rates charged by mashonisas would be preferable to not knowing how much she owed. During the data collection period, she took credit worth R98 at one of the local spaza shops in the village, and repaid this several months later. However, the shop owner told her that she still owed R350 because of the interest that had accumulated on the credit. In frustration, she waited until she received a R400 payout from her stokvel and used R350 of it to pay the shop. During the next month, when she had no cash to buy groceries, she decided to borrow R98 from a mashonisa. Even though she would pay a very high interest rate – 20 per cent per month, at least, she said – she knew what the rate was, and that it would be a fixed rate.
A key argument in debates on over-indebtedness is whether debt is used for ‘productive’ debt, such as business loans or mortgage debt, or ‘consumption’ debt, such as instalment credit for buying consumer items such as clothes or a television. However, when looking into the lives of Financial Diaries households, we found that this distinction was extremely difficult to make. Householders often used instalment credit to buy school uniforms, which are necessary for children to attend school. Similarly, a stokvel loan may be taken to pay for a funeral. Or credit at the local store may be taken to buy food. This reality does not mesh easily with the distinction between productive and consumption debt. If the lack of a school uniform would have prevented school attendance then it is difficult not to see this debt as productive.
3.4 Short term, payslip-driven debt
A pervasive view of indebtedness in South Africa is that it is predominantly urban, payslip-driven debt. This is the type of indebtedness that is most accurately described by the PERSAL data of government employees, who with regular employment and a payslip are a major market for micro lenders. Within the Financial Diaries sample, we did indeed find a small subsection of these indebted households. However, we found that most of them tended to be highly indebted for a short period of time. Of the highly indebted, regular-salaried households in the sample, only 41 per cent of them suffered from persistently high indebtedness over the period of the study. The following case study is one example of a household that had a level of debt that was marginal relative to income, but which increased sharply with an unexpected bout of illness.
3.4.1 Case study 1: an unexpected illness topples the debt cart
Samuel is a 35-year-old man who lives in Diepsloot with his 27-year-old wife and 4-year-old daughter.Footnote2 He lives in a home that he owns, having purchased it with a mortgage bond. When we first met him in 2003 he was working in a factory and earning a salary of R3655 per month, a good salary in comparison with those of his neighbours and the rest of the sample. In addition he received benefits, both medical aid and a provident fund. He also carried a fair amount of debt. In addition to his bond, he had borrowed R5000 from his employer against his provident fund to buy a fridge. The family had also bought a wardrobe on credit, which they were still paying off. Samuel's salary was just adequate to keep up with the payments on these debts – when we first met the family, their debt service payments were just bordering on 20 per cent of income.
However, Samuel's luck changed. In April 2004, he became ill and was unable to work at all between July and October. During this time, he at first received half pay, and then no pay at all. He was supported with remittances from his family but he also had to keep repaying his mortgage bond and the loan from his employer. He let the credit account for the wardrobe lapse. During this period, his debt service to income ratio shot up to nearly 50 per cent.
In Samuel's case, this situation was short-lived, unlike the debt situation described in case study 3 below. He recovered and went back to work, earning his regular salary and paying his debts again. His case is typical of a regular wage earner – someone who carries debt from formal sources. Sometimes the debt levels are high, sometimes they are very low. Sometimes households are forced from a reasonable debt situation into an over-indebted one, where they struggle to keep up with their payments.
3.5 Short-term debt and the wageless
For the non-waged households, the picture can be quite different. Their debt situation is indicative of much lower per-capita incomes. Most of the debt is from informal rather than formal sources. Some households, typically those in urban areas and with relatively few household members, carry very low levels of debt and are only pushed into an over-indebted situation by an unfortunate incident. Case study 2 is an example of this type of household. Others, typically in the rural areas, with more household members and lower income, regularly carry high levels of debt, rolling over credit wherever they can. Case study 3 in section 3.6 is example of this type of household.
3.5.1 Case study 2: falling into debt to pay for a funeral
Mapeyi is a 72-year-old woman living with her three grandchildren in a house inherited from her parents in the established part of an urban area. All four members of this household are supported by Mapeyi's old-age grant of R740 per month, a per-capita income of R190 per month. Every now and then she makes ginger beer to sell, but this is not a consistent business. The mother of two of the children works in a nearby factory and lives elsewhere in the township. She does not contribute to the children's upkeep. The other child is an orphan.
In June 2004 Mapeyi struggled to contribute to the funeral of her daughter-in-law, the mother of the orphan. She used R250 from her grant, and was given R1000 by her daughter, who borrowed at work. Mapeyi also borrowed R1000 from the local spaza shop where she was getting groceries on credit every month. She stopped taking this credit so as to repay the loan first, and managed to repay it by October.
It is important to note that she did not pay any interest for either the loan or the credit. This compares sharply with the example given in Section 3.3 above. We found that spaza shops in urban areas tended not to charge interest, while those in rural areas did. However, as this was a survey of households and not of formal or informal financial institutions, such as spaza shops, we cannot say whether this would be true outside Langa and Lugangeni.
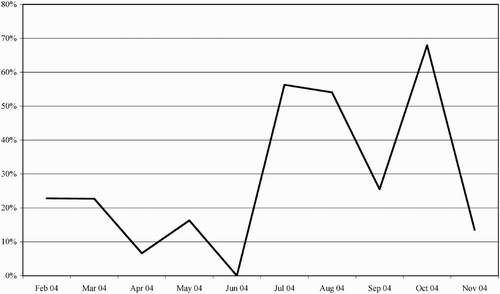
The shop owner said she rarely gave credit to anyone without a salary but Mapeyi was a special case because she had been in the neighbourhood a long time and the shop owner knew she would pay. She did, however, restrict the credit she gave Mapeyi every month to R200 because she worried that Mapeyi would not be able to pay more. As shows, Mapeyi tended to manage her credit fairly tightly, paying back 10–20 per cent of her income to the shop. During the 4 months she was paying back the loan, she used between 30 and 60 per cent of her income to pay the loan and restricted her household expenditures.
When we left Mapeyi at the end of the study, she was joining a burial society because she was concerned about what she had experienced with her daughter-in-law's funeral. She said she was having a hard time keeping money aside and did not want the grandchildren to have that burden. She also applied for a foster-care grant for the child who had recently lost her mother. The social worker had come to see her and Mapeyi was quite optimistic that her financial situation would improve.
Several interesting observations come out of this case study. First, we see that even households that manage money carefully are doing so against quite small incomes, so they can be forced into a high-debt situation by an emergency. Having to pay for a funeral was something we observed frequently during the Financial Diaries study, so Mapeyi's situation was not unusual. However, we also note that Mapeyi's financial discipline prior to the funeral paid off later – she was able to get herself out of the high-debt situation fairly quickly, within 4 months. Second, we see that informal finance can be crucial to poor households. Mapeyi was able to secure a loan from the first place she asked. Otherwise she would have had few options other than borrowing from the local mashonisa at an interest rate of 30 per cent per month. Her relationship and good credit standing with the spaza shop owner, and her self-discipline, made it possible for her to pay for the funeral without getting into a debt trap.
3.6 Rural, perpetual debt
The stories of Mapeyi and Samuel were ones of short-lived debt, but we found that some Financial Diaries households cope day by day with financial needs that are persistently larger than their income, and in due course they find themselves in long-term debt situations. In the Financial Diaries sample, high indebtedness was found to afflict both urban and rural households alike. The difference, however, is not only that indebtedness tends to affect rural households across all income levels, but also that in the rural areas it tends to be perpetual debt. In the urban areas, 75 per cent of highly indebted households have a regular job. Of the highly indebted urban households with jobs, 60 per cent suffer from only short-term indebtedness. In the rural areas, 71 per cent of highly indebted households are grant recipients and, of these, 75 per cent have perpetually high levels of debt. This suggests that the high level of indebtedness in rural grant-recipient households is not a matter of poor financial management, but of too little income stretched to cover too many needs. The following case study is an example of such a household, one that was more stretched financially than Mapeyi's and whose head was less disciplined about her credit undertakings.
3.6.1 Case study 3: high debt in the rural area
Madlamini is a 65-year-old widow who lives with her 37-year-old son and seven grandchildren. Four of the grandchildren have the same mother, who is looking for work in Durban. The mother of the other three is working in Durban, but she does not earn much and rarely is able to send anything home to them. Sometimes Madlamini's son gets work as a herd boy, but he does not give the money to Madlamini. She says she knows he uses it for liquor. She has never been able to get the daughters to organise child grants. The family therefore subsists on her old-age grant, a per-capita income of R82 per month, less than one-half that of Mapeyi's household.
In addition to a tight budget, Madlamini gets confused about her money and does not manage it well. She is in the habit of taking credit from local traders, for an apron or some chicks, and then forgetting that she needs to pay them. Over the year that we were speaking with her, she took a total of 11 of these credit arrangements. The amounts tend to average less than R100 each time but they still bite into the little money she has. She borrowed from a mashonisa seven times over the course of the year, paying 25 per cent interest per month. She borrowed from neighbours and did not always pay them back. She took credit from two of the local spaza shops, and continuously has a balance with them. She knows that the spaza shops charge interest, but they are not transparent about how much it is. On average, throughout the study, Madlamini's debt payments were 40 per cent of her total monthly income.
There are three reasons why Madlamini's debt levels are so high. First, the income she lives on is only just enough to feed the members of the household, leaving no slack to buy other items they might need. Second, although her main sources of credit, like Mapeyi's, are informal, they are far more expensive and less transparent. Third, her own confusion about debt has led to her taking on more arrangements than she can keep track of. As a result, we saw Madlamini's debt situation change very little through the course of the study.
4. CONCLUSIONS
The Financial Diaries data-set provides a view of household debt in poor areas that is missed by one-off surveys. Because it places debt in the context of all sources of household income and in the context of both formal and informal financial instruments, the findings give us a more nuanced picture of indebtedness in low-income households. Over-indebtedness is not endemic across households, but it does affect a sufficiently large pocket of households to be significant. In urban areas, indebtedness is primarily caused by formal debt and suffered by those who have a regular job and a payslip (i.e. those above the median income levels). That said, this does not mean that households without a payslip do not fall into debt due to unforeseen circumstances, nor does it mean that households with a regular job are doomed to succumb to high level of over-indebtedness.
We also find that high indebtedness can exist in the rural areas, and among households that do not have access to formal credit. For these households, the combination of extremely low per-capita incomes and a lack of easy credit relationships creates the conditions for a debt trap. The credit they have access to is both a benefit and a burden: a benefit because it allows them to stretch their small incomes from month to month, but a burden because the credit tends to be expensive and non-transparent. The National Credit Act will not be the solution in this case, given the logistical impossibility of regulating spaza shop credit or mashonisas. For poor rural indebted households, the solution is more likely to be found in social policy, perhaps in terms of widening the social safety net to take account of increasing family sizes, rather than in financial legislation that curtails credit.
This paper has created a picture of how households use debt to manage what is often a tight budget on very low per-capita incomes, but it does not go beyond the describing the data. The next step would be to understand how households might alter their behaviour should they find their income constraints eased. Would they replace their existing credit relationships with cheaper, more transparent ones? Would they opt to save more, or rather upgrade their food choices? An analysis that gives an estimate of these income elasticities, with respect to both expenditure and to financial choices, is beyond the scope of this paper, but would be a useful addition to our understanding of the financial lives of the poor.
Acknowledgments
The author wishes to thank two anonymous reviewers for the helpful and insightful comments. All remaining errors are the author's own.
Notes
1 The sample started out with 181 households and had an attrition rate of 19 per cent through the survey year. The analysis shown in this paper is based on the 152 households for which we have a complete set of data.
2 The names in the case studies have been changed to protect the identities of the respondents.
REFERENCES
- COLLINS , D . 2005 . Financial instruments of the poor: initial findings from the Financial Diaries study . Development Southern Africa , 22 ( 5 ) : 717 – 28 .
- DANIELS , R . 2001 . Consumer indebtedness among urban South African households: a descriptive overview , Cape Town : University of Cape Town . Working paper No 1/55, Development Policy Research Unit
- DEPARTMENT OF TRADE AND INDUSTRY . 2000 . DTI interest rate study , http://www.mfrc.co.zaAccessed 5 February 2003
- HUMAN SCIENCES RESEARCH COUNCIL . 2003 . Household indebtedness in South Africa in 1995 and 2000 , Report prepared for the Micro Finance Regulatory Council. http://www.mfrc.co.za Accessed 5 February 2003
- RUTHERFORD , S . 1999 . The poor and their money , New Delhi : Oxford University Press .
- RUTHERFORD , S . 2002 . Money talks: conversations with poor households in Bangladesh about managing money , Manchester : University of Manchester . Paper No. 45, Finance and Development Research Programme Working Paper Series, Institute for Development Policy and Management
- RUTHVEN , O . 2002 . Money mosaics: financial choice and strategy in a West Delhi squatter settlement . Journal of International Development , 14 : 249 – 71 .
- STATISTICS SOUTH AFRICA . 1995 . Income and Expenditure Survey , Pretoria : StatsSA .
- STATISTICS SOUTH AFRICA . 2000 . Income and Expenditure Survey , Pretoria : StatsSA .
