Abstract
There has been concern in recent years about the impact of the child support grant on fertility in South Africa and probable changes in age-specific fertility rates. Specifically, it has been mooted that the grant may be increasing age-specific fertility rates among younger women. Using the Gompertz relational model and survey and census data, this study examines trends in the age pattern of fertility in South Africa during the period 1995–2005. The results indicate that there have been shifts in the age pattern of fertility. However, the factors responsible for the shifts are debatable. Policy-makers should therefore be cautious about drawing conclusions regarding the relationship between the child support grant and fertility in South Africa, as policies based on poorly informed conclusions could have major financial implications.
1. INTRODUCTION
The overall level of fertility is often decomposed into age-specific fertility rates. An age-specific fertility rate, defined as the number of births in a specified year per 1000 women in specified reproductive groups at mid-year, has several related uses – ranging from purely demographic to providing insights for evaluating policy and programmes related to fertility. From a purely demographic standpoint, age-specific fertility rates are one of the measures of the level of fertility and hence are often used to analyse trends and differential in fertility. Since these rates control for the age–sex composition of populations and variation in fertility within each reproductive age group, they are useful for exploring the impact of policy interventions and programmes relating to fertility, where such interventions have been made, and whether the appropriate data are available.
1.1 The child support grant in South Africa
The history of the child support grant in South Africa has been summarised in a monograph by Amoateng Citation(2005). He explains that in South Africa non-income and low-income earners who were single parents were eligible for the State Maintenance Grant until 1997. Historically, access to the grant was racially biased; but even after the removal of such restrictions, uptake by African parents, especially in rural areas, was low (Taylor Commission, 2002). He further notes that in 1996 the Lund Committee recommended that this grant be replaced by the child support grant. The value of the grant was reduced and it was hoped that this would make resources available for improved uptake. Citing the Taylor Commission Citation(2002) report, Amoateng notes that by June 2000 uptake rates were still poor, with the highest number of applicants being from the richest provinces, and that in 2000 it was estimated that only 1 million out of a prospective 4.2 million children who are eligible in fact receive the grant (Cassiem et al., Citation2000), although the Department of Social Development has recently announced a marked increase in recipients. Amoateng also notes that concern has been expressed about the low financial value of the grant, the barriers to access that the administrative process causes, and the arbitrariness of the age limit, originally set at 7 years (Community Agency for Social Enquiry, Citation2000), and that this last concern has recently been addressed with the phased extension of the grant to 14 years.
The impact of the child support grant on fertility in South Africa has aroused interest in recent years and has sparked debate about probable changes in age-specific fertility rates. Specifically, it has been mooted that this social welfare benefit may be affecting age-specific fertility rates, especially among younger women (aged 15–19 years); that is, increasing fertility among younger women. The concern is about not only the cost of providing the grant but also the perceived consequences of teenage pregnancy.
1.2 Consequences of teenage pregnancy
Various studies have drawn attention to the negative socio-economic, demographic, health, biological, psychological and public consequences of teenage pregnancy at the individual (mother and child) and community levels. Among the demographic and health consequences are high levels of maternal and child mortality, toxaemia, and increased numbers of stillbirths and premature and low-birth-weight infants (due to underlying biological risk inherent in young maternal age), prolonged labour, iron-deficiency and defective infants (Menken, Citation1972; Chelala, Citation1988; United Nations, Citation1989; Center for Population Options, Citation1990; Vernon, Citation1991; Alexander & Guyer, Citation1993; Fraser et al., Citation1995; Goldenberg & Klerman, Citation1995), and so forth. Mahfouz et al. Citation(1995), however, argue that pregnant teens do not constitute a high-risk group if good prenatal care is provided.
Menken Citation(1972), Furstenberg and Crawford Citation(1980), Makinson Citation(1985) and Hatcher and Trussell Citation(1986), among others, have noted the following social aspects of teenage childbearing: lower educational attainment, as the teenage mother often discontinues her education; increased parity, as the teenage mother has another child quickly; higher divorce rate, as teenage marriages break up faster than other marriages, especially if the bride was pregnant at the time of marriage; and lower income, increased poverty and dependency. Hoffman et al. Citation(1993) show that there is consistent support for the notion that adolescent pregnancy reduces economic and social well-being.
In the context of biological consequences, Garn et al. Citation(1986) observed that pregnant teenagers show excessive weight gain during pregnancy and tend to gain more weight than older mothers. Regarding psychological consequences, Vernon Citation(1991) observed that teenage mothers are stressed by childcare and living arrangements, employment, school, relationships with peers and with parents, housework and errands, health, finances, job counselling, community services and childcare information. McCarthy Citation(1981) argues that children of adolescent parents have more problems than those of older parents, but that most of the negative consequences are related to the socio-economic conditions of the adolescent mothers rather than to age itself. According to Simkins Citation(1984), teenage mothers as a group tend to be less well educated, do not have adequate vocational skills, and are not financially equipped to provide for their child. This author argues that perhaps even more important is that many of these mothers have motivations and attitudes to bearing and raising of children that are psychologically questionable.
Regarding public cost, on the basis of a study in the United States, Burt Citation(1990) observes that an increase in the numbers of children born to unmarried teens means large public expenditures for welfare and medical care. The study estimated that the public cost of a family started by a first birth to a teenager in 1979 would amount to $18 710 and all such families would cost taxpayers $8.3 billion. Caldas Citation(1993) argues that the most significant costs of teenage childbearing are associated with truncated educations and lost human capital investment.
Summarising these consequences, Alexander and Guyer Citation(1993) observe that teenage pregnancy and childbearing comes at great social and public economic costs.
Against this background, the present study examines trends in age-specific fertility rates in South Africa during the period 1995–2005, bearing in mind that the child support grant was introduced in 1998.
2. DATA
The data used in this study are the 1995 and 1998 October Household Surveys, and the 2001 census.
2.1 The October household surveys, 1995 and 1998
The 1995 October household survey was carried out on a national sample of 30 000 households drawn from 3000 enumeration areas. Ten households were selected in each enumeration area. The sample was stratified by province, urban and non-urban areas and by population group. Hirschowitz and Orkin Citation(1996) provide detailed methodological information about the 1995 survey. Although an omnibus survey, it collected birth histories from women younger than 55 years old and thus can be used to examine age-specific fertility rates.
The 1998 October household survey was similar in design to the 1995 one except that the sample size was reduced to 20 000 households (Statistics South Africa, Citation1998). As in the 1995 survey, the 1998 survey collected birth histories from women younger than 55 years old, so these data make it possible to examine age-specific fertility rates.
2.2 The 2001 population census
The 2001 population census (Statistics South Africa, Citation2001) was the second post-apartheid census in South Africa that attempted to canvass the entire country. One of the fertility questions in the 2001 census for women aged between 12 and 50 years at the time of the census was: ‘If (the person) has ever given live birth: when was (the person's) last child born?’ Used appropriately in conjunction with other variables, the answers to this question can be used to examine age-specific fertility rates.
3. METHODS
Because retrospective reporting on fertility surveys and censuses often contain reporting errors, age-specific fertility rates directly computed from such data are often biased, hence the need for appraisal and adjustment for such errors using indirect methods. One such method is the Gompertz relational model. This method was applied in the present study to estimate age-specific fertility rates. Details of the method are as follows. The model was developed as a means of evaluating and adjusting for errors in fertility distributions obtained from reports on births in the last year before the census/survey, vital registration systems and information on children ever born (Zaba, Citation1981). It is sufficiently rigid to reveal error deviations but flexible enough to follow the really significant features of the observations; that is, to fit good data well but bad data badly (Brass, Citation1981). It is an improvement on the original Brass Citation(1968) P/F ratio method in that it not only reveals error deviations in the data, if present, but can also be used to estimate fertility where fertility has been subject to a marked trend in recent years, as it is not necessary to assume that fertility has been constant in recent years or that the reporting error does not vary with the age of the respondent, as is the case in the P/F ratio method.
The Gompertz relational model for fertility proposed by Brass Citation(1974) is summarised and expressed by Brass Citation(1981) as:
Brass also notes that for most applications F is not known but, working under the guidance of Brass, Zaba (1981) has shown using a linear transformation how F can be separated from the estimation of α and β using a Taylor series expansion with β = 1. On the basis of Zaba's work (often referred to as the ratio method), the equation for fitting the Gompertz relational model to current fertility is given as
Similarly, for mean parities and z(i) defined as –ln[–ln{P(i) / P(I+1)}],
the equation is:
In applying the model to evaluate and adjust fertility distributions, z(x) – e(x) or z(i) – e(i) are plotted against g(x) or g(i) in the case of current and lifetime fertility respectively. α and β are then calculated from the graph or determined algebraically. If β is not close to one, the correction term involving 0.48 (β – 1)2 is applied, thus:
The α and β values are then applied to the standard series of z values to obtain proportional parities and estimates of F. The ‘best’ series of F are averaged to obtain a single estimate of F. The estimated F together with the α and β values applied to the standard fertility cumulants can be used to smooth the age pattern of fertility (i.e. the reported age-specific fertility rates) when errors are present in such distributions.
The appropriate variables for the evaluation and indirect estimation of age-specific fertility rates were extracted from each of the data-sets listed above and then appraised using the Gompertz relational model. Estimates of age-specific fertility rates for the years 1995, 1998 and 2001 were then computed on the basis of the estimated Gompertz parameters for these periods. For the year 2000 the values were obtained by linear interpolation, while for the year 2005 they were obtained through extrapolation by linear regression. The results were then graphically examined for trends in age-specific fertility rates for the periods 1995, 2000 and 2005.
4. RESULTS
4.1 Trends in age-specific fertility rates by population group
show the estimated trend in relative age-specific fertility rates (i.e. with total fertility rate equal to one) by population group. Note that total fertility rates in South Africa have been declining in the past few decades (see Chimere-Dan, Citation1993). The total fertility rate in South Africa probably declined from about 4.9 in 1970 to about 3.2 in 1998. Since age-specific fertility rates reflect both overall total and age patterns of fertility, it is necessary to control for changing levels of total fertility rate for the different periods by computing relative age-specific fertility rates so as to examine the contribution of each reproductive age group to total fertility. The highlights are as follows.
Figure 1: Trend in estimated relative age-specific fertility rates (total fertility rate =1), African
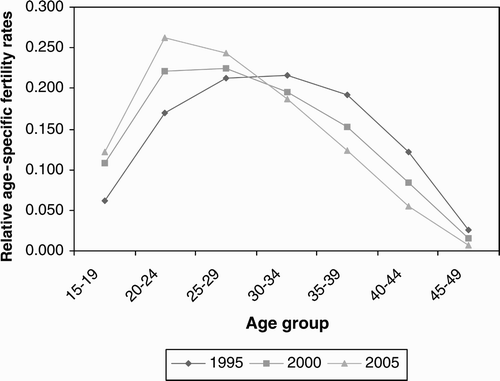
Figure 2: Trend in estimated relative age-specific rates (total fertility rate=1), coloured
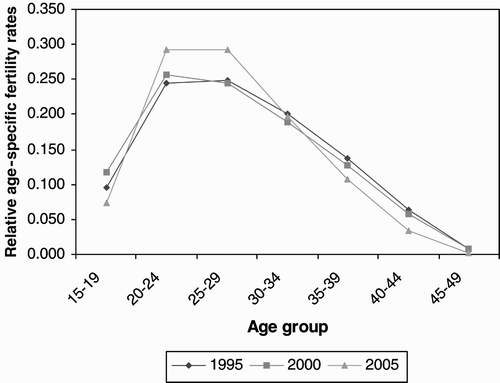
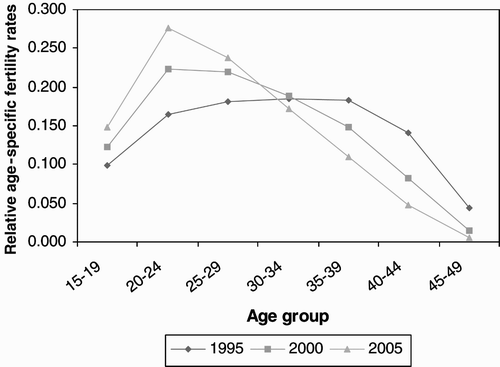
Figure 3: Trend in estimated relative age-specific fertility rates (total fertility rate=1), Indian
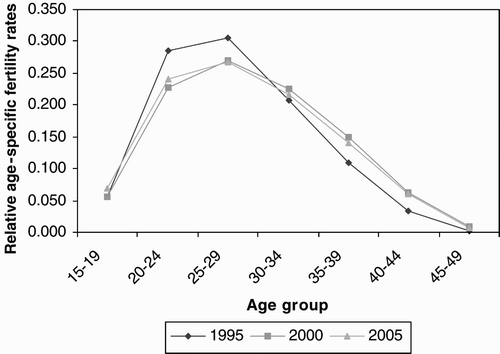
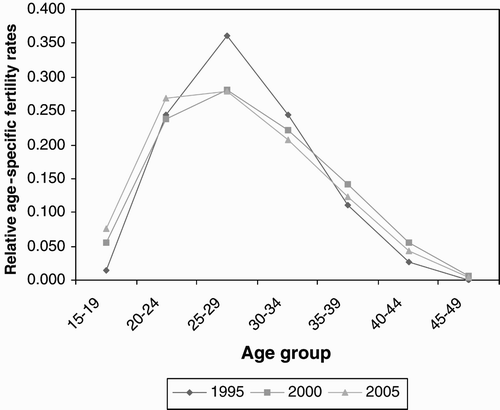
Figure 4: Trend in estimated relative age-specific fertility rates (total fertility rate=1), white
Among Africans, as can be seen in , the age distribution of fertility in 1995 was wider than in 2000 and 2005. This suggests that in 1995 a substantial proportion of women bore children until a late reproductive age, whereas in 2000 and 2005 a substantial proportion stopped bearing children at a late reproductive age. Furthermore, although the total fertility rate was higher in 1995 than in 2000 and 2005, the relative contribution to total fertility by younger women (aged 15–29 years) relative to older women (aged 30–49 years) was lower in 1995 than in 2000 and 2005. This means that the age pattern of fertility has been getting younger over the years: in 1995, women aged 15–29 years contributed an estimated 44 per cent to total fertility; this increased to 55 per cent in 2000 and 62 per cent in 2005.
A similar pattern can be seen among coloureds (), although not as prominently as among Africans. On the other hand, Indians and whites show the opposite pattern (i.e. in general, the contribution of the younger women to total fertility was higher in 1995 than in 2000 and 2005; see and ). In 1995, white women aged 15–29 years contributed about 62 per cent of the total fertility rate of the white population; in 2002, their contribution was about 58 per cent and in 2005 it was about 62 per cent.
4.2 Trends in age-specific fertility rates by place of residence
and show the estimated trend in relative age-specific fertility rates by place of residence. Although the estimated total fertility rate has remained more or less constant in urban areas (at about 2.6) since 1995, the age pattern of fertility has been shifting, as can be seen in . It would appear from this figure that, proportionately, fertility was higher among women aged 15–19 and 20–24 years in 2005 than among women of corresponding age in 1995 and 2000. For example, whereas in 1995 and 2005 women aged 15–19 years contributed about 25 per cent of the total fertility in those years, the contribution of women of corresponding age to total fertility in 2005 was about 28 per cent. Note that there was very little change in the age pattern of fertility among women living in rural areas between 1995 and 2000.
Figure 5: Trend in estimated relative age-specific fertility rates (total fertility rate=1), urban
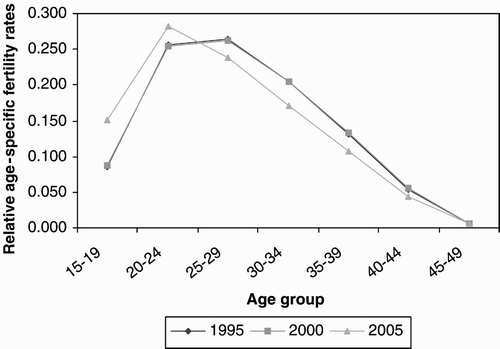
Figure 6: Trend in estimated relative age-specific fertility rates (total fertility rate=1), rural
As can be seen in , although the model fit to the age pattern of fertility in the rural areas is poor for the year 1995, the curves for the rural areas suggest a trend in the age pattern of fertility similar to the ‘African pattern’ shown in . That is, a substantial proportion of women in the rural areas had children until late reproductive ages, whereas a substantial proportion of women in 2000 and 2005 appeared to prefer to bear children at younger ages. The shifting age pattern of fertility towards higher fertility at younger ages in recent times is more pronounced in the rural areas than in the urban areas.
4.3 Historical trends in age-specific fertility rates
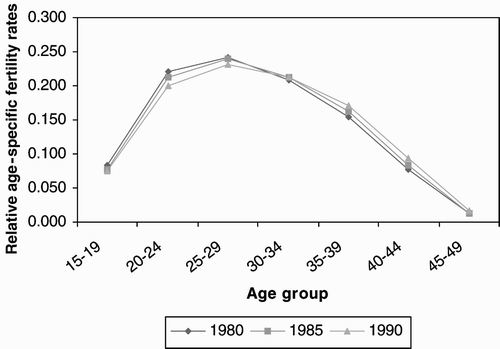
shows that there was very little shift in the age pattern of fertility between 1980 and 1990 when the changing levels of total fertility during the period are controlled for those among Africans, as the relative age-specific fertility rates were almost the same for the period.
Figure 7: Historical trend in estimated relative age-specific fertility rates (total fertility rate=1), African
5. DISCUSSION AND POLICY IMPLICATIONS
Various studies have shown that fertility rates have been declining in South Africa in the past few decades. Fertility decline is often accompanied by changes in the spread of the fertility distribution (denoted by β in the Gompertz relational model) and by changes in the location or timing of fertility (denoted by α). See Wulf Citation(1986) for the empirical evidence of this phenomenon. As fertility declines, the spread of the fertility distribution (which can be examined by looking at either the β values or the relative age-specific fertility rates) often becomes narrower, while the location or timing of fertility (which can be examined by looking at the mean age of the fertility schedule) tends toward younger ages.
In the context of the debate about the impact of the social welfare benefit on fertility, these quantum and tempo effects (which could arise from changes in the proximate, i.e. direct, determinants of fertility) need to be isolated from the ‘real’ impact of the child support grant, if any. There are broadly two kinds of factors that influence fertility: direct (proximate) and indirect factors. Changes in fertility are brought about by one or more proximate factors, since indirect factors (such as education, or the child support grant) do not influence fertility directly but must operate through one or more proximate factors (such as contraceptive practice, breastfeeding, of women of reproductive age in sexual unions, etc.).
In the debate about the child support grant and fertility, one therefore needs to examine how this grant may be operating through direct determinants to influence fertility. A carefully designed survey and analysis that incorporates fertility and child support grant variables might be able to isolate these impacts. As the present study shows, there have been shifts in the age pattern of fertility, and among Africans this shift appears to have been quite marked since 1995. However, the factors responsible for the shifts are debatable in the absence of a carefully designed study to examine them. Such a study would involve, inter alia, a survey and data analysis using appropriate demographic and statistical techniques including multivariate analysis to examine the relationship between teenage fertility (the dependent variable) and the child support grant (the independent variable), and controlling for other factors. Such a study has not been undertaken in South Africa. In view of this, one needs to be cautious about drawing conclusions about the relationship between the child support grant and fertility in South Africa so that policy-makers are not misled. The financial implications of policies based on poorly informed conclusions could be enormous.
REFERENCES
- ALEXANDER , C S and GUYER , B . 1993 . Adolescent pregnancy: occurrence and consequences . Pediatric Annals , 22 ( 2 ) : 85 – 8 .
- AMOATENG, Y, 2005. The relationship between child support grant, pregnancy and fertility in six provinces of South Africa. Unpublished monograph, Human Sciences Research Council
- BOOTH, H, 1979. The estimation of fertility from incomplete cohort data by means of the transformed Gompertz Model. PhD thesis, London School of Hygiene and Tropical Medicine, University of London.
- BRASS , W . 1968 . “ Methods of analysis and estimation ” . In The demography of tropical Africa , Edited by: Brass , W , Coale , A J , Demeny , P , Heisel , D F , Lorimer , F , Romaniuk , A and Van deWalle , E . Princeton, NJ : Princeton University Press .
- BRASS , W . 1974 . Perspectives in population prediction: illustrated by the statistics of England and Wales . Journal of the Royal Statistical Society , A137 ( 4 ) : 532 – 83 .
- BRASS , W . The use of the Gompertz relational model to estimate fertility . Proceedings of the International Union for the Scientific Study of Population Conference . December 9–16 , Manila. Vol. 3 , pp. 345 – 61 . Liege : International Union for the Scientific Study of Population .
- BURT , M R . 1990 . Public costs and policy implications of teenage childbearing . Advances in Adolescent Mental Health , 4 : 265 – 80 .
- CALDAS , S J . 1993 . The private and societal economic costs of teenage childbearing: the state of the research . Population and Environment , 14 ( 4 ) : 389 – 99 .
- CASSIEM , S , PERRY , H , SADAN , M and STREAK , J . 2000 . Child poverty and the budget: are poor children being put first? , Cape Town : Institute for Democracy in South Africa .
- CENTER FOR POPULATION OPTIONS . 1990 . “ Teenage pregnancy and sexually transmitted diseases in Latin America. International Clearinghouse on Adolescent Fertility ” . Washington, DC 2 August
- CHELALA , C A . 1988 . Teenage pregnancy in the Americas . World Health , June : 22 – 23 .
- CHIMERE-DAN , O . Racial patterns of fertility decline in South Africa . Proceedings of International Population Conference . August–1 September 24 , Montreal. pp. 43 – 51 . Liege: International Union for the Scientific study of Population
- COMMUNITY AGENCY FOR SOCIAL ENQUIRY . 2000 . Phasing in the Child Support Grant: a social impact study , Researched for the Department of Welfare. www.case.org.za/2000.html Accessed August 2007
- FRASER , A M , BROCKERT , J E and WARD , R H . 1995 . Association of young maternal age with adverse reproductive outcomes . New England Journal of Medicine , 332 ( 17 ) : 1113 – 17 .
- FURSTENBERG , F F and CRAWFORD , A G . 1980 . “ Social implications of teenage childbearing ” . In Adolescent pregnancy: perspectives for the health professional , Edited by: Smith , P B and Mumford , D M . Boston : GK Hall .
- GARN , S M , PESICK , S D and PETZOLD , A S . 1986 . “ The biology of teenage pregnancy: the mother and the child ” . In School-age pregnancy and parenthood: biosocial dimension , Edited by: Lancaster , J B and Hamburg , B A . New York : Aldine de Gruyter .
- GOLDENBERG , R L and KLERMAN , L V . 1995 . Adolescent pregnancy: another look . New England Journal of Medicine , 332 ( 17 ) : 1161 – 2 .
- HATCHER , R A and TRUSSELL , J . The provision of contraception to teenagers and university students . Proceedings of International Meeting on Sexual and Reproductive Health in Teenagers and Young Adults , pp. 142 – 53 . Mexico City
- HIRSCHOWITZ , R and ORKIN , M . 1996 . Living in South Africa: findings from the October 1995 household survey , Pretoria : Statistics South Africa (formerly Central Statistical Service) .
- HOFFMAN , S D , FOSTER , E M and FURSTENBERG JR , F F . 1993 . Re-evaluating the costs of teenage childbearing . Demography , 30 ( 1 ) : 1 – 3 .
- MAHFOUZ , A A , EL-SAID , M M and AL-ERIAN , R A . 1995 . Teenage pregnancy: are teenagers a high risk group? . European Journal of Obstetrics, Gynaecology, and Reproductive Biology , 59 ( 1 ) : 17 – 20 .
- MAKINSON , C . 1985 . The health consequences of teenage fertility . Family Planning Perspectives , 17 ( 3 ) : 132 – 9 .
- MCCARTHY , J . Social consequences of childbearing during adolescence . Proceedings of a conference . Canadaigua, NY. New York. Pregnancy and childbearing during adolescence: research priorities for the 1980s , Edited by: McAnarney , E R and Stickle , G . Allan R. Liss . 5–7 October 1980
- MENKEN , J . 1972 . The health and social consequences of teenage childbearing . Family Planning Perspectives , 4 ( 3 ) : 45 – 53 .
- SIMKINS , L . 1984 . Consequences of teenage pregnancy and motherhood . Adolescence , 19 ( 73 ) : 39 – 54 .
- STATISTICS SOUTH AFRICA . 1998 . 1998 October household survey , Pretoria : StatsSA .
- STATISTICS SOUTH AFRICA . 2001 . Census 2001 , Pretoria : StatsSA .
- TAYLOR COMMISSION, 2002. Report of the Committee of Inquiry into a comprehensive system of social security for South Africa. Submission to the Department of Social Development, 14 June.
- UNITED NATIONS . 1989 . Adolescent fertility in less developed countries . Population Newsletter , 47 : 1 – 6 .
- VERNON , M . 1991 . Adolescent childbearing . North Carolina Medical Journal , 52 ( 5 ) : 209 – 12 .
- WULF , D . 1986 . Teenage pregnancy and childbearing in Latin America and the Caribbean: a landmark conference . International Family Planning Perspectives , 12 ( 1 ) : 17 – 22 .
- ZABA, B, 1981. Use of the relational Gompertz model in analyzing fertility data collected in retrospective surveys. Paper 8,1–2, Centre for Population Studies, London School of Hygiene and Tropical Medicine.