Abstract
This study ascertained the food product attributes prioritised by low-income and very low-income consumers when purchasing their staple food, maize meal. Survey results from 502 Gauteng respondents in three informal settlements and one formal settlement revealed the level of importance perceived for 14 predetermined attributes. The informal settlement consumers' ratings for product acceptability and convenience closely matched those of the formal settlement, but the more affluent respondents gave them higher ratings. The ratings for appearance, value for money, product quality, texture, product safety, brand loyalty and nutrient content were significantly similar between the two low and between the two very low income groups, but significantly different between the former two and the latter two, specifically for nutrient content. The informal settlements rated satiety value and affordability as the most important, while the formal settlement reported taste and appearance. These findings represent both a challenge and an opportunity for food product developers.
1. Introduction
1.1 Urbanisation
South Africa is experiencing a rate of urbanisation unprecedented in its history – culminating in city growth rates that are among the highest in the world and typical of third world countries (Jenkins, 1997:4). Most newly urbanised people find refuge in large cities or on their edges (Hubbard & Onumah, 2001:433). A significant proportion of the urban poor are very poor (Mitlin, 2005:6), and experience some of the worst poverty levels (Higgs, 2007:1). This situation is further aggravated by poor food production and availability (Kruger et al., 2008:3), which pose an increasing challenge to food and nutrition security. Because they are poor and price matters to them, the low-income consumers' demand is mainly for staple-type foods (Den Hartog et al., Citation1995:25; Ellaway & Macintyre, 2000:55). Maize is the food most often consumed in South Africa (NFCS-FB-1, 2008:258), as confirmed by a situation analysis conducted in an informal settlement in Gauteng (Oldewage-Theron et al., Citation2005a:20).
The urban-formal, urban-informal, rural-formal and tribal enumerator areas included in the National Food Consumption Survey Fortification Baseline (NFCS-FB-1, 2008:254, 260) show that households at risk of hunger or experiencing hunger, with the lowest monthly income and spending the lowest amount of money weekly on food, tend to live in informal dwellings that do not conform to municipal building regulations. The mothers of these households also have a lower standard of education. The reality of this situation is further highlighted by the national household monthly income of ZAR1 to ZAR1000 (US$0.1 to US$98) reported for 55 per cent of the South African population. The highest percentage of no income (6 per cent) and monthly incomes of ZAR1 to ZAR500 (35 per cent) have been reported for urban informal households (23 urban informal enumerator areas) (MERC, 2008:5–6; NFCS-FB-1, 2008:255). The cumulative effect of the 40 per cent of South African households (i.e. approximately 19 million people) cited as ‘poor’ by the Poverty and Inequality Report (PIR, 1998:5) represents a recognised, although often problem-ridden, emerging market (Prahalad, 2006:2).
1.2 Food expenditure within the duality of the South African consumer market
South Africa has a two-tiered economy, serving a wide range of consumers characterised by an uneven distribution of wealth and income (Gain, 2005:3–4). The South African Advertising Research Foundation (Saarf, 2006) has developed a wealth measure segmentation tool to profile the consumer market into 10 relatively homogeneous groups. The consumers of lowest status are indicated in the first segment of the universal living standards measure (SU-LSM 1) and those of highest status in the last segment (SU-LSM 10). The duality of the South African consumer market is mirrored by the difference in food consumption patterns between the middle-income and high-income consumers (the modern economy – SU-LSM 4 to 10) and the low-income consumers (the marginalised economy – SU-LSM 1 to 3) (ACNielsen, Citation2005:1; BFAP, 2007:52).
The European Food Information Council (Eufic, 2005:2) poses the cost of food as the primary determinant of food choice, in direct relation to the income and socioeconomic status of the consumers. Therefore, the lower the income per capita, the greater the portion of the budget that is spent on staple-type starch food products such as cereals (ACNielsen, 2005:2). The result is an increasingly less diverse diet (FF, 2006:1–2), indicative of a market more vulnerable to food price and income changes (Regmi, 2001:iii).
For the most marginalised consumers in South Africa (SU-LSM 1), food cash expenditure, as share of total cash expenditure, amounts to 71 per cent of their average monthly household income (or 80 per cent of income decile 1), resulting in a very limited choice of basic food items (BFAP, 2008:56–7; Kruger et al., 2008:4). The amount of maize bought increases with decreasing household income and the money spent on food. With less money available, each of the food purchases is important, as no money is available for replacements (Treiman as quoted by Fisher, 1999:2). The poor are cautious shoppers (Alwitt & Donley, Citation1996:60) and will change their food buying habits in an attempt to economise. The cost of food takes precedence over issues of taste, cultural acceptability and healthy eating (JRF, 1994:2). In this situation, food choice reflects a complex relationship between economic circumstances, limited access to a wide variety of reasonably priced foods, and cultural norms and expectations (Anderson & Morris, Citation2002:12).
1.3 Quality perception and decision-making
Consumers in western industrialised countries perceive quality in terms of four dimensions: taste and appearance, health, convenience, and process (Brunsø et al., Citation2002:12). In South Africa, affluent consumers seeking high-quality eating experiences increasingly demand convenient, healthy, attractive food, food variety, food produced in ethical and environmentally responsible ways, and value for money (BFAP, 2007:50–1), confirming that convenience, health and pleasure are the three major food choice reasons that shape the food industry (Gray et al., 2003:214). On the other hand, the main concern of low-income consumers in South Africa is basic food security – the availability of an adequate quantity of affordable food to satisfy their nutritional requirements (BFAP, 2007:52). However, it is not known whether this statement is true for the low-income consumers in urbanised informal settlements or how it translates into the choice of food product attributes when buying maize meal.
Decision-making during food choice is complex and highly diverse (Torjusen et al., 2001:208). In any purchasing situation, a unique combination of environment information is integrated with personal needs, motives, perceptions and attitudes, including past experiences and individual factors (Hubbard & Onumah, 2001:434). A food product possesses a combination of attributes (Green & Srinivasan, 1987:119), comprising the characteristics that consumers infer from the product. The perception of product quality (Oude Ophuis & Van Trijp, 1995:179) is experienced as accumulated benefits, with tangible and intangible attributes relating to the consumers' needs, wants and behaviour (Earle et al., 2001:3). Consumers are also ‘rational utility maximisers’ who will choose a product that provides the highest utility to them when faced with a set of available alternatives (Ness & Gerhardy, 1994:29). The cumulative effect of these attributes is of importance to food product producers (Von Alvensleben, 2002:218, 223).
The importance consumers assign to food product attributes varies (Malaviya & Sivakumar, 1998:97; Von Alvensleben, 2002:216). Researchers depict the ‘voice of the consumer’ as a hierarchical set of customer needs, where each need, or set of needs, is assigned a priority value indicating its importance to the consumer (Hart, 2004:224). The consumer choice process is accordingly described in terms of attributes the consumer perceives as good quality because they provide benefits and pleasant consequences (Kaul & Rao, 1995:296; Hart, 2004:224; Van Kleef et al., 2005:186). The acceptance or rejection of a food product is determined by the compatibility of its attributes with consumer needs (Earle et al., 2001:201), and the consequent value to the consumer indicates consumer acceptance and determines a particular attribute's competitive position in the market (Young, 1999:81).
Producers therefore need to become ‘creators of value’ (Brunsø et al., Citation2002:6–7). This can be done by discovering what the most needed or preferred food product attributes (such as price, convenience, quality) mean to the target consumer (Groves, 2003:17) as decisions can then be made about the way these attributes can be created in a product or product range (Young, 1999:81). Successful (food) products communicate significant value in the key categories that are of importance to the target consumer and setting (Cagan & Vogel, Citation2002:5–7, 14).
1.4 Purpose of the study
Low-income consumers differ from high-income consumers demographically and in their needs for goods and services (Alwitt & Donley, Citation1996:68). As yet, no clear guidelines have been formulated for a workable and cost-effective implementation of this obtainable ‘consumer intelligence’ during the early phases of food product development for low income consumers (Costa & Jongen, 2006:8–9). The purpose of this study was therefore to derive and test a set of attributes that guide low-income consumers' purchasing choice of maize meal in urbanised informal settlements in Gauteng, South Africa.
2. Methods
An explorative approach was followed, to allow identification of trends and differences, and a sequential explanatory design was used, consisting of a quantitative survey supplemented by a qualitative procedure (Creswell, Citation2003:213).
2.1 Planning
In a prior baseline investigation conducted among low-income consumers in an urbanised informal settlement, 14 food product attributes were identified as possible contributors to these consumers' perception of value when they buy maize meal (Duvenage, Citation2010:83). In descending order of perceived importance, these attributes were: satiety value, affordability, packaging size, value for money, and taste, followed by acceptability, appearance/colour, product quality, convenience/ease of preparation, nutrient content, texture, product safety/shelf life, brand name loyalty/satisfaction, and family influence.
To validate the baseline findings through test market evaluation, the respondent database was expanded to cover a broader geographical area. The survey covered four urbanised settlements, three informal and one formal (StatsSA, 2005a), as follows:
-
Boipatong, informal, very low income, near to the town of Vanderbijlpark,
-
Eatonside,Footnote1 informal, very low income, near to the city of Vereeniging,
-
Alexandra, informal, low income, near to the metropolis of Johannesburg, and
-
Tsutsumani, formal, low income, directly adjacent to the metropolis of Johannesburg and directly adjacent to Alexandra.
2.2 Sampling
A systematic approach was used to recruit at least 100 consumers from each of the four settlements. Using a town map, the frequency interval was calculated to determine which households to approach. If the main food purchaser was not willing to be interviewed or did not meet screening criteria, the next household was approached until consent was obtained, covering each of the settlements systematically. The first household to approach was selected at random, with planned variation of starting point between settlements (Babbie & Mouton, Citation2002:190).
In order to base the sample choice on known characteristics as far as possible and to ensure a high level of prior food product knowledge to facilitate meaningful quality assessment (Alba & Hutchinson. as quoted by Malaviya & Sivakumar, 1998:95), purposive sampling was used (Babbie & Mouton, Citation2002:166). Volunteers were screened on the basis of habitual consumption of maize meal as staple food (at least twice a day), being the main food purchaser for the household, receiving an average household income of ≤R1003/month (SU‐LSM 1; Saarf, 2006), and living in shacks (informal settlements) and/or being unemployed (formal settlement). To avoid bias, separate respondents were selected for the quantitative test market survey and the qualitative focus group discussions.
2.3 Procedures
Using a questionnaire similar to the one used for the baseline investigation, but condensed, incorporating the 14 attributes identified as being of highest importance in that investigation, the extended survey was conducted in the four settlements. Data were gathered by trained field workers during one-on-one interviews with 502 respondents. The survey was completed within a maximum of 2 days for each of the settlements during the period of November 2007 to February 2008.
Responses were reported by a six-point hedonic rating scale, recording the importance of each attribute to the consumers during their purchasing choice of maize meal (Heymann, 1995:12). The options were ‘don't know’, ‘not important’, ‘slightly important’, ‘fairly important’, ‘very important’ and ‘extremely important’ for each of the listed food product attributes. To highlight the important or interesting differences in the data, the six-point rating scale was aggregated into three categories (1 = don't know + 2 = not important; 3 = slightly important + 4 = fairly important; and 5 = very important + 6 = extremely important). On the basis of the prepared frequency table, the results from the four settlements were ranked and compared. Line graphs were used to suggest the attributes to test for significance of difference between the two sets of data.
As the aim was to explore and formulate (A De Wet, Professor Emeritus (Statistics), North West University, personal communication, 17 June 2008), formal multiple comparison statistical procedures were not used. Instead, approximate tests were done, applying a lenient 10 per cent level of significance to pair-wise comparisons in order to indicate a trend or difference. If a strict 5 per cent level of significance had been applied, the risk of jeopardising the identification of a trend would have been too high. It was therefore important to confirm the findings by incorporating a variety of groups and critically evaluating the data generated.
The difference between the weighted percentages of groups (p1 and p2 or as applicable) was calculated and the identified difference was then compared with the calculated standard error of difference × 1.64 for the two groups, as follows:
-
Standard error of difference =
-
1.64 × standard error of difference between p1 and p2 = norm for comparing p1 percentage and p2 percentage (Z)
-
p1 percentage – p2 percentage = Y
-
If Y < Z = cannot distinguish between p1 and p2 (not significantly different)
-
If Y > Z = can distinguish between p1 and p2 (significantly different).
For further clarification of the meaning of the terminology used and to support consistency when comparing findings, one focus group was conducted in each of the four settlements (Babbie & Mouton, Citation2002:123) with 5 to 10 participants each (Finch & Lewis, 2005:191–2), and the discussions were recorded and transcribed, capturing the essence as textual data.
For the qualitative data analysis a phenomenological approach was followed, using a descriptive style. The food product attributes (i.e. concepts) identified as most important during the quantitative survey were used as preset categories to organise the textual data according to common properties and dimensions, while allowing for the identification of other emergent concept categories (Taylor-Powell & Renner, 2003:3; Corbin & Strauss, Citation2008:45, 231). Colour coding was used to identify key words or phrases (Taylor-Powell & Renner, 2003:2, 4–5; Corbin & Strauss, Citation2008:45, 57–7). Descriptive themes (concept elements) were then identified within each of the concepts to allow more subtle discrimination of patterns and relationships within and between categories (Taylor-Powell & Renner, 2003:4–5; Corbin & Strauss, Citation2008:45, 57).
The derived information was used to screen the quantitative survey data to ensure consistency of meaning for the same term between the groups (validity) and to support comparability. An operational understanding of the attributes that guide consumers' purchasing choice of maize meal was derived, contributing to the validity of content and applicability of the findings in the real world (Babbie & Mouton, Citation2002:275). For the purpose of this article, only the concept elements describing the food product attributes indicated as of highest importance are reported (Duvenage, 2009:125–47).
3. Results and discussion
3.1 Demographic profile
shows the population density of the study areas. The densities of Boipatong, Sebokeng Unit 6 (incorporating Eatonside) and Tsutsumani are quite similar. However, Alexandra's is about 6.7 times higher (StatsSA, Citation2005b), highlighting the differences in living conditions experienced by low-income consumers.
Table 1: Geographical description of the urbanised settlements (Duvenage, Citation2010:101)
shows the enumeration area type and the kind of dwellings predominant in these areas (see Brits, Citation2002:7; StatsSA, Citation2005b). In this table the predominance of dwellings that do not conform to municipal building regulations in the three informal settlements (70 per cent, 90 per cent and 72 per cent for Boipatong, Eatonside and Alexandra, respectively) stands in stark contrast to the situation in the urban settlement, Tsutsumani (2 per cent) (StatsSA, Citation2005b). When linking this situation to household income (see ), it can be argued that income levels relate to residential location and type of housing. Of particular interest is that the geographical settings of Alexandra and Tsutsumani are very similar, yet their average household incomes () and type and density of dwellings () are very different.
Table 2: Dwelling types predominant in the settlements (Duvenage, Citation2010:102)
Table 3: Situation analyses for household income and education level (Duvenage, Citation2010:104)
shows the respondents' household incomes as gathered from available information. Since different parameters were used to portray levels of income and poverty, clear-cut comparisons could not be drawn and a best-fit approach was followed. For the purpose of this study a monthly household income of between ZAR1 and ZAR400 was used as the indicator for very low income (very poor) and between ZAR401 and ZAR800 for low income (poor) (StatsSA, Citation2005b). This was in keeping with the national poverty line of ZAR354 per month per adult (SAHD, 2003:5), and the household poverty line of ZAR800 per month (StatsSA, 2000:5). If a household received no income, it was reported as destitute.
also shows the distribution of the respondent groups according to income. In Boipatong 70 per cent of the population survives on a monthly household income of R800 or less. Since on average these households consist of three members, the implication is that approximately 51 per cent of this population exist on less than R200 per capita per month (very poor) (StatsSA, 2000:6, 2005b). Information for Eatonside is not available, except that 58 per cent of the population have an average monthly household income of less than R1000 (Oldewage-Theron et al., 2005b:317). By deducing the approximate income per capita per month a basis of comparison was created, revealing that Eatonside (58 per cent <R200 per capita per month) is even poorer in real terms than Boipatong (51 per cent <R200 per capita per month). Alexandra was identified as the informal settlement with the highest income (33 per cent <R200 per capita per month). This stands in contrast to the relative low incidence of poverty reported for the formal settlement Tsutsumani (22 per cent <R200 per capita per month).
An income of less than R200 (US$20) per capita per month means approximately R7 (US$0.70) per capita per day to meet all needs (). Taking into account the international poverty line indicator of R10.22 (US$1) per capita per day, this highlights the exceptionally marginalised conditions of the two poorer informal settlements, Boipatong and Eatonside.
The percentage of respondents with the lower levels of education is similar for Sebokeng Unit 6, Alexandra and Tsutusumani (17 per cent each), but higher for Boipatong (24 per cent). The percentage of Grade 12 and higher qualifications is much higher for Tsutsumani (26 per cent), the area with the highest income ().
3.2 Low-income and very low-income consumers' ratings of maize meal attributes to suit their needs
Since the number of respondents was large (502), the six-point rating scale was aggregated into three categories to highlight important or interesting differences and enhance the accuracy of the scale. As the ‘very important + extremely important’ category reports the results for most of the respondents for each attribute (), and thus relates to the main focus of this study, the following discussions pertain only to this category.
Table 4: Importance of food product attributes to low-income and very low-income consumers (Duvenage, Citation2010:105)
, derived from the findings in , provides a clear comparison of the values allocated to the various attributes by the four respondent groups. From viewing and using an approximation approach, the comparisons in appeared reasonable. The significance of difference between the various combinations of respondent scores was calculated for all the attributes listed in this table by comparing the maximum with the minimum. The results are summarised in .
Figure 1: Comparison of the importance of food product attributes to low-income and very low-income consumers (Duvenage, 2009:105)
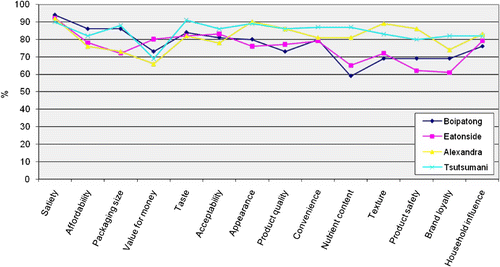
Table 5: Suggested comparisons between the ratings of the different respondent groups (Duvenage, Citation2010:107)
Table 6: Exploratory comparison of the importance of food product attributes to low-income and very low-income consumers with different expendable incomes (p < 0.1) (Duvenage, Citation2010:118)
No significant difference was found between the four respondent groups' assessments of the importance of satiety value, product acceptability, convenience and household influence, which suggests that variation within the household low-income bracket does not lessen the importance of these attributes as maize meal quality indicators.
For taste no significant difference was found between the values reported by the three informal settlements, but these values were significantly lower than for the formal settlement. For appearance, product quality, nutrient content, texture, product safety and brand loyalty no difference was found between the values of the two poorest informal settlements (Boipatong and Eatonside), or between the more affluent informal settlement (Alexandra) and the formal one (Tsutsumani). A significant difference was, however, found between the two sets of groups: the values for the former were consistently lower than for the latter.
Overall, satiety value was found to be the attribute of highest importance for Boipatong, Eatonside and Alexandra (94 per cent, 92 per cent, 92 per cent, respectively), and a close second for Tsutsumani (90 per cent, compared with 91 per cent for taste) ().
The significant difference in the importance allocated by the two very low income groups, Boipatong and Eatonside to affordability (86 per cent and 78 per cent, respectively) and packaging size (86 per cent and 72 per cent, respectively), is of interest and can probably be ascribed to a difference in interpretation of terms between the two poorest groups. A smaller packaging size can be purchased when less money is available, which explains the higher importance attached to packaging size and lower importance to affordability, as an Eatonside consumer explained: ‘I usually buy 12,5 kg, but when I don't have enough money I buy 5 kg’ (Duvenage, Citation2010:142–3). The researcher therefore recommended that the implied importance of affordability be accepted as representative of both of the informal settlements of lower income, Boipatong and Eatonside. This view is supported by the baseline findings (96 per cent) and the focus group discussions relevant to these attributes.
No significant difference was found between the importance Boipatong and Eatonside allocated to value for money (73 per cent and 80 per cent, respectively). These figures were also significantly higher than those reported by Alexandra and Tsutsumani, which indicates the importance of this attribute to these consumers compared with the perceptions of the two more affluent settlements for this attribute.
The attributes related to economic factors were satiety value, affordability, packaging size, value for money, convenience and family influence. Except for affordability and packaging size, no significant differences were found between the importance that the two poorest informal settlements allocated to these attributes. It is of interest to observe that all the attributes for which no significant difference were found between all four respondent groups, namely satiety value, product acceptability, product convenience and household influence, are in this category. The sequence of importance allocated by the three informal settlements to these attributes corresponds with the sequence reported by the baseline study, namely satiety value, affordability and packaging size.
A quite different picture is seen when looking at the importance of the non-economic attributes to low-income and very low-income consumers. Figures reported for the sensory (taste, appearance and texture), culture related (consumer acceptability, including social, cultural and religious aspects), health (nutrient content, product safety/shelf life) and status attributes (product quality and brand loyalty) illustrate the significantly lower level of importance allocated to these attributes by the two poorest informal settlements. The ratings by Boipatong and Eatonside respondents indicated no significant difference in their need for any of these attributes, but the ratings from Alexandra and Tsutsumani were significantly higher (see ).
In overview, it is notable that the difference between the importance allocated to appearance, product quality, nutrient requirements, texture and product safety by the two less affluent settlements and that allocated by the two more affluent settlements was established beyond doubt ( and ).
Although the prevalence of very low-income households is much higher in the informal Alexandra (±33 per cent) than in Tsutsumani (±22 per cent) (), significant differences in the importance allocated to attributes were only reported for packaging size and taste. Possible explanations are that better taste costs money and that the need for specific packaging sizes was interpreted differently.
For Alexandra the attributes related to economic constraints, excluding satiety value and brand loyalty, were rated less important than the sensory, acceptability and health related attributes. Further notable differences were found in the values allocated to appearance, product quality, nutrition, texture, and product safety/shelf life. These values were of much higher importance to this metropolis-based informal settlement than to the two poorer informal settlements, Boipatong and Eatonside, and were more similar to the responses by the formal settlement Tsutsumani.
Possible trends were further highlighted (see ) by incorporating only the results proven not significantly different in the calculation of the weighted overall average for each of the attributes for the three informal settlements () and also for the settlements of slightly higher income, Alexandra and Tsutsumani ().
Table 7: Exploratory comparison of the importance of food product attributes to low-income and very low-income consumers with different expendable incomes (p < 0.1) (supplementary to ) (Duvenage, Citation2010:185)
Table 8: Importance of food product attributes as perceived by the low-income consumers from informal settlements during the test market evaluation (weighted) (p < 0.1) (Duvenage, Citation2010:186)
Table 9: Importance of food product attributes as perceived by the slightly more affluent low-income consumers during the test market evaluation (weighted) (p < 0.1) (Duvenage, Citation2010:187)
From these results () it is of interest that no significant differences were found between the weighted averages of the two poorest informal settlements (Boipatong and Eatonside) for satiety value, taste, product acceptability, convenience/ease of preparation, household influence, appearance, value for money, product quality, texture, product safety/shelf life, brand loyalty and nutrient content. These findings suggest a very close similarity in perceptions of the importance of the attributes. To complete the picture, shows how the slightly more affluent low-income consumers rated the attributes.
Comparing and confirms that there is no significant difference between the four respondent groups' perceptions of the need for satiety value, product acceptability, convenience and household influence. It can further be noted that, apart from taste and packaging size, no significant differences were found between the Alexandra and Tsutsumani respondents' perceptions of importance, for any of the food product attributes (). The ratings of the importance of taste were significantly different and higher for Tsutsumani than for the three informal settlements ( and ). This implies a direct relationship between the level of income and the ‘luxury’ of perceiving taste as of overriding importance during food choice, as is typical in consumer preferences (Shepherd, 1999:810).
Although all four groups rated satiety value, product acceptability, convenience/ease of preparation and household influence similarly, a different trend was found for the rest of the attributes. No significant differences were found for appearance, value for money, product quality, texture, product safety/shelf life, brand loyalty and nutrient content between Boipatong and Eatonside (). The findings for Alexandra and Tsutsumani, indicated a similar significance (). It can therefore be argued that household income not only guides the need for attributes perceived as most important but also the level of importance attached to the not so important attributes. The implication is that respondents from the slightly more affluent settlements allocated a higher importance to attributes that the less affluent cannot afford to worry about.
These findings also imply that the health-related (nutrient content and product safety/shelf life) and status (product quality, brand loyalty) attributes are of far less importance to the low-income consumers than to those with a slightly higher income. That these consumers were so little concerned about the nutrient content of their food is alarming. This finding matches that of the baseline study and work by other researchers (JRF, 1994:1; Walker et al., 1995:8; Nord et al., 2007:1). It cannot, however, be inferred that the very low-income consumers do not care at all about these attributes; rather, that in severely constrained economic conditions ‘nice to have’ attributes take second place to the attributes linked to survival.
Although it is not possible to calculate the critical level of income below which survival needs override ‘nice to haves’, the findings of this study suggest a certain level of deprivation where survival needs become of utmost importance. These low-income and very low-income consumers, relying almost entirely on maize meal for survival, are aptly described as ‘survival users’ of staple food (Makwetla International Communications & Fleishman-Hillard, 2002). The struggle to merely meet physiological needs, the lowest level in Maslow's hierarchy of needs, supports this perception (Hughes, 2002:10).
Applying Maslow's concept, Kinsey created a hierarchy of food preferences that influence consumer choices. At the lowest level, the quest to satisfy physiological needs to maintain life includes a struggle for sufficient kilojoules, lower-priced foods and foods that are not spoiled (Kinsey, 2000, as quoted by FF, 2006:4; Painter, 2007:15). This indication that satiety value and affordability are the two most important attributes to these consumers is in close congruence with the needs of ‘survival users’ of maize meal.
3.3 Description of maize meal attributes
summarises the food product attributes (concepts) perceived as most important by the low-income and very low-income consumers from the informal settlements. This synopsis was based on the qualitative analysis and was intended to help elucidate the concepts being tested. (For further details, see Duvenage, Citation2010:120–59 and Marumo, 2009.) It clarifies the importance of satiety value to low-income and very low-income consumers. The descriptive elements – provision of energy, a feeling of fullness, the absence of hunger and a sense of well-being – are clearly linked to the highly constrained nature of food expenditure. Likewise, affordability realised as ‘the availability of enough money’, where price and the need to avoid waste determine the packaging size purchased, confirms these findings.
Table 10: Elements describing the food product attributes perceived as of highest importance (Duvenage, Citation2010:126, 128)
4. Conclusions
The perception of food quality is a complex issue. Various methods have been used to research it, one of which is used in this study. The rating of the quality of a food product depends on consumers' subjective perceptions and their own reality during purchasing choice (Brunsø et al., Citation2002:6–7, 52). The ideal is therefore to combine the most preferred and needed attributes to maximise the product's competitiveness in the marketplace for the specific consumer group.
This study's systematic exploration (p ≤ 0.1) of the importance of specific food product attributes to low-income and very low-income consumers when buying maize meal as a staple food revealed a definite trend. Overall, a higher importance was accorded to satiety value and affordability by low-income and very low-income consumers than by the more affluent ones. This finding is supported by literature that suggests price and the money available for food are the determining factors in what food to buy (Dobson et al., Citation1994:33). The importance of taste as a food product attribute was very clearly income related.
The other attributes (appearance, value for money, product quality, texture, product safety/shelf life, brand loyalty and nutrient content) were allocated a higher rating, and in most cases a significant similarity of importance, by the two slightly higher income groups. They were rated lower, but also very similarly, by the two lower-income groups. The low importance of brand loyalty for the latter groups is of interest, while the very low importance they allocated to nutrient content is a matter of extreme concern.
In contrast to ‘nice to have’ attributes such as nutrient content, low-income and very low-income consumers rate attributes determined by economic restrictions, specifically satiety value and affordability, as of highest importance, followed by taste and acceptability. Only when these needs are satisfied do other considerations, such as appearance and ease of preparation, come into play. The attributes chosen as most important in this study can therefore be seen as representative key buying goals in the minds of low-income and very low-income consumers wanting to obtain the highest level of product satisfaction.
From these results a boundary is implied beyond which the lack of expendable income differentiates between food product attributes that can influence purchase choice to a higher or lower degree. For low-income and very low-income consumers, there is little leeway between choosing for quality and accepting what price dictates – the poorer you are, the more important price becomes. From these results it can be deduced that even a little extra expendable income may exert an influence on food purchasing decisions.
In sum, it is income level that determines which attributes guide low-income and very low-income consumers' purchasing choice for maize meal, which confirms the importance of satiety value and affordability as the most important food product attributes. This is in stark contrast to the attributes valued by the middle-income and high-income consumers of South Africa's modern economy, whose main concerns when buying food are convenience, health, aesthetic appeal, value-for-money, ethical and environmental responsibility, and simplicity (BFAP, 2007: 52–3).
The low importance allocated to nutrient content by low-income and very low-income consumers contradicts the current understanding that their main concern is to obtain an adequate quantity of affordable food to satisfy nutritional requirements (BFAP, 2007:52). The findings of this study suggest that satiety value should be as high as possible so as to limit the quantity that must be purchased and consumed in order to stave off hunger for a prolonged period. These consumers' focus is on the most immediate needs for survival, which may lead them to neglect the long-term consequences of possible poor nutrient content. It seems that a distinct category of consumers, from extremely low-income households with specific food needs, is emerging at the lower end of the income ladder, necessitating attention to specific food product attributes, including nutritional attributes. These findings indicate both a challenge and opportunity for food product developers.
Acknowledgements
The authors wish to thank the National Research Foundation and Vaal University of Technology for financial support, Professor A de Wet for statistical advice, and the community representatives, respondents and ward councillors from the informal and formal settlements for their participation in this study.
Notes
1Eatonside forms part of the larger Sebokeng Unit 6. Where information was not available specifically for Eatonside, data for the whole of Sebokeng Unit 6 were used.
Related Research Data
References
- ACNielsen Center . 2005 . “ A country divided: Consumer spending trends in the dual economy. Food Review, April, Wisconsin School of Business ” . University of Wisconsin–Madison
- Alwitt , F and Donley , T D . 1996 . “ The Low-income Consumer: Adjusting the Balance of Exchange ” . Thousand Oaks, CA : Sage .
- Anderson , A S and Morris , S E . 2002 . Changing fortunes: Changing food choice. Nutrition and Food Science . 30 ( 1 ) : 12 – 15 .
- Babbie , E and Mouton , J . 2002 . “ The Practice of Social Research ” . Cape Town : Oxford University Press .
- BFAP (Bureau for Food and Agricultural Policy) . 2007 . South African agricultural baseline: Consumer trends and analysis. Pretoria. www.bfap.co.za/reports/BFAP%20Baseline%20June%202007.pdf Accessed 16 July 2007
- BFAP (Bureau for Food and Agricultural Policy) . 2008 . The South African agricultural baseline: Part 2. Pretoria. www.bfab.co.za/ Accessed 27 June 2008 .
- Brits , I . 2002 . Investigation into density criteria as part of defining urban and rural areas for South Africa. Statistics South Africa. www.statssa.gov.za/ Accessed 7 July 2007 .
- Brunsø , K , Fjord , T A and Grunert , K G . 2002 . “ Consumers' food choice and quality perception ” . The Aarhus School of Business. Working Paper 77. Bureau for Food and Agricultural Policy, Pretoria
- Cagan , J and Vogel , C M . 2002 . “ Creating Breakthrough Products: Innovation from Product Planning to Program Approval ” . Upper Saddle River, NJ : Prentice Hall .
- Corbin , J and Strauss , A . 2008 . Basics of Qualitative Research , 3 , Los Angeles, CA : Sage .
- Costa, AIA & Jongen, WMF, 2006. New insights into consumer-led food product development. www.sciencedirect.com/ Accessed 26 March 2006.
- Creswell , J W . 2003 . Qualitative, Quantitative, and Mixed Methods Approaches , 2 , Thousand Oaks, CA : Sage .
- Den Hartog , A P , Van Staveren , W A and Brouwer , I D . 1995 . “ Manual for Social Surveys on Food Habits and Consumption in Developing Countries ” . Weikersheim : Margraf Verlag .
- Dobson , B , Beardsworth , A , Keil , T and Walker , R . 1994 . “ Diet, Choice and Poverty: Social, Cultural and Nutritional Aspects of Food Consumption among Low-income Families ” . London : Centre for Research in Social Policy .
- Duvenage , S S . 2010 . Development of a food product concept formulation framework for low-income households in urbanised informal settlements in Gauteng South Africa. PhD thesis, University of Pretoria, South Africa
- Earle, M, Earle, R & Anderson, A, 2001. Food Product Development. Woodmead, Cambridge.
- Ellaway, A & Macintyre, S, 2000. Shopping for food in socially contrasting localities. British Food Journal 102(1), 52–9.
- Engelbrecht, K & Du Rand, P, 2000. Status of frail elderly black people in informal settlements. South Africa's Continuing Medical Education Monthly 18(10), 828–33.
- Eufic (European Food Information Council), 2005. The determinants of food choice. EUFIC Review, 2005/04. Brussels.
- FF (Farm Foundation), 2006. Food marketing analysis: Consumer demand issues. www.farmfoundation.org/projects/documents/ConsumerDemands.pdf Accessed 27 February 2007.
- Finch, H & Lewis, J, 2005. Focus groups. In Ritchie, J & Lewis, J (Eds), Qualitative Research Practice: A Guide for Social Science Students and Researchers. Sage, London.
- Fisher, A, 1999. Consumer preferences and farmer's markets. Why: Finding answers for hunger and poverty. http://www.whyhunger.org/ Accessed 17 March 2007.
- Gain (Global Agriculture Information Network), 2005. Retail food sector report 2005. Republic of South Africa: Retail food sector. Report SF5040, US Department of Agriculture: Foreign Agricultural Service, Washington, DC.
- Gray, J, Armstrong, G & Farley, H, 2003. Opportunities and constraints in the functional food market. Nutrition and Food Science 33(5), 213–18.
- Green, PE & Srinivasan, V, 1987. Conjoint analysis in consumer research: Issues and outlook. Journal of Consumer Research 5, 103–23.
- Groves, A, 2003. Consumer Watch. Institute of Grocery Distribution Consumer Tracker. February. www.igd.com/consumer Accessed 17 March 2007.
- Hart, S, 2004. New Product Development: A Reader. Thompson, Eastbourne.
- Heymann, H, 1995. Sensory evaluation of food and beverage products. A two-day introductory sensory evaluation workshop, 10–11 April, Stellenbosch, South Africa.
- Higgs, N, 2007. The state of South Africans as we start 2007. TNS Research Surveys. www.biz-community.com/PressOffice/PressRelease.aspx?i=112297&ai=13219 Accessed 12 September 2007.
- Hubbard, M & Onumah, G, 2001. Improving urban food supply and distribution in developing countries: The role of city authorities. Habitat International 25(3), 431–46.
- Hughes, D, 2002. Consumer interests and the reform of the CAP: A review of relevant documentation and research. http://ec.europa.eu/consumers/reports/rep02_en.pdf Accessed 27 August 2006.
- Jenkins, JW, 1997. Urbanisation and security in South Africa: The continuation of history. African Security Review 6(6), 1–12. www.iss.co.za/Pubs/ASR/6No6/Jenkins.html Accessed 5 November 2008.
- JRF (Joseph Rowntree Foundation), 1994. Eating on a low income. Social Policy Research, 66. www.jrf.org.uk/knowledge/findings/socialpolicy/SP71.asp Accessed 19 February 2008.
- Kaul, A & Rao, VR, 1995. Research for product positioning and design decisions: An integrative review. International Journal of Research and Marketing 12, 293–320.
- Kinsey, J, 2000. The changing global consumer. Paper presented at the 2000 IAMA World Food and Agribusiness Congress. Chicago, IL, 27 June 2005.
- Kruger, R, Schönfeldt, HC & Owen, JH, 2008. Food coping strategy index applied to a community of farm-worker households in South Africa. Food and Nutrition Bulletin 29(1), 3–14.
- Makwetla International Communications & Fleishman-Hillard, 2002. Draft National Food Fortification Programme: Communication strategy. 8th draft. Unpublished. Supported by Department of Health, UN Children's Fund & The Micronutrient Initiative.
- Malaviya, P & Sivakumar, K, 1998. The moderating effect of product category knowledge and attribute importance on the attraction effect. Marketing Letters 9(1), 93–106.
- Marumo, K, 2009. Food product attributes of importance to low-income households during purchasing. MTech dissertation, Vaal University of Technology, South Africa.
- MERC (Markets and Economic Research Centre), 2008. The South African Food Cost Review. National Agricultural Marketing Council & Department of Agriculture, Pretoria.
- Mitlin, D, 2005. Understanding chronic poverty in urban areas. International Planning Studies 10(1), 3–19.
- Ness, MR & Gerhardy, H, 1994. Consumer preferences for quality and freshness attributes of eggs. British Food Journal 96(3), 26–34.
- NFCS-FB-1, 2008. National Food Consumption Survey Fortification Baseline South Africa 2005: Executive summary. South African Journal of Clinical Nutrition 21(3 Suppl 2), 245–300.
- Nord, M, Andrews, M & Carlson, S, 2007. Household food security in the United States, 2006. Economic Research Report EER-49. www.ers.usda.gov/Publications/ERR49 Accessed 20 November 2007.
- Oldewage-Theron, WH, Dicks, EG, Napier, CE & Rutengwe, R, 2005a. Situation analysis of an informal settlement in the Vaal Triangle. Development Southern Africa 22(1), 13–26.
- Oldewage-Theron, WH, Dicks, EG, Napier, CE & Rutengwe, R, 2005b. A community-based integrated nutrition research programme to alleviate poverty: Baseline survey. Public Health 119, 312–20.
- Oude Ophuis, PAM & Van Trijp, HCM, 1995. Perceived quality: A market driven and consumer oriented approach. Food Quality and Preference 3(6), 177–83.
- Painter, K, 2007. An analysis of food-chain demand for differentiated farm commodities: Implications for the farm sector. Centre for Sustaining Agriculture & Natural Resources, Washington State University. Pullman, Washington, DC.
- PIR (Poverty and Inequality Report), 1998. Poverty and inequality in South Africa. Report prepared for the Office of the Executive Deputy President and the Interministerial Committee for Poverty and Inequality. Government Printer, Pretoria.
- Prahalad, CK, 2006. The Fortune at the Bottom of the Pyramid: Eradicating Poverty through Profits. Wharton School Publishing, Pennsylvania, PA.
- Regmi, A, 2001. Changing structure of global food consumption and trade. Agriculture and Trade Report No. WRS-01-1, Economic Research Service, US Department of Agriculture.
- Saarf (South African Advertising Research Foundation), 2006. Segmentation Handbook – Based on AMPS 2005 and AMPS 2006. Saarf, Johannesburg.
- SAHD (South Africa Human Development), 2003. The challenge of sustainable development in South Africa: Unlocking people's creativity. Final report. United Nations Development Programme (UNDP). Oxford University Press, Cape Town.
- Shepherd, R, 1999. Social determinants of food choice. Proceedings of the Nutrition Society 58, 807–12.
- StatsSA (Statistics South Africa), 2000. Measuring poverty in South Africa. RDP (Reconstruction and Development Programme) Development Monitor 16(12), 5–7. www.statssa.gov.za Accessed 19 February 2008.
- StatsSA (Statistics South Africa), 2005a. Calculating the undercount in Census '96. Appendix E: Enumerator area type definitions. www.statssa.gov.za Accessed 7 July 2008.
- StatsSA (Statistics South Africa), 2005b. Census Survey 2001. www.statssa.gov.za/census01/html/C2001Interactive.asp Accessed 25 March 2008.
- Taylor-Powell, E & Renner, M, 2003. Analyzing qualitative data. Programme development & evaluation G3658-12. University of Wisconsin–Extension. Cooperative Extension Publishing Operations, Madison, WI.
- Torjusen, H, Lieblein, G, Wandel, M & Francis, CA, 2001. Food system orientation and quality perception among consumers and producers of organic food in Hedmark County Norway. Food Quality and Preference 12, 207–16.
- Van Kleef, E, Van Trijp, HCM & Luning, P, 2005. Consumer research in the early stages of new product development: A critical review of methods and techniques. Journal of Food Quality and Preference 16(4), 369–82.
- Von Alvensleben, R, 2002. Consumer behaviour. In Padberg, DI, Ritson, C & Albisu, LM (Eds), Agro-food Marketing. CAB, Wallingford.
- Walker, R, Dobson, B, Middleton, S, Beardsworth, A & Keil, T, 1995. Managing to eat on a low income. Journal of Nutrition & Food Science 3, 5–10.
- Young, JA, 1999. Marketing the intrinsic quality of the product. In Global quality assessment in Mediterranean aquaculture. Proceedings of the workshop of the CIHEAM (International Centre for Advanced Mediterranean Agronomic Studies) networks, 29 November, Barcelona, Spain.