Abstract
Tourist expenditures constituted the largest part of the economic impact of South Africa's 2010 FIFA Football World Cup. However, limited air transport capacity and increased accommodation prices may have led to crowding-out effects. Until now, crowding-out could only be considered by using econometric modelling based on data of inbound arrival or accommodation statistics. This paper suggests a methodology for measuring the crowding-out effect precisely. It is based on the available statistics in South Africa and is applicable at province level. An important innovation is to distinguish crowding-out from time-switching effects. The paper explains the theoretical framework of crowding-out as part of impact measurement, discusses the technical problem of assessing crowding-out, and supplies formulae for calculating this effect. Although this is a study of the 2010 FIFA World Cup 2010 specifically, the methodology described here is appropriate for calculating the impacts of other mega-events.
1. Introduction
The huge public subsidies that were provided to stage the FIFA World Cup 2010 in South Africa can be seen as critical investment, particularly since the country has the second highest uneven distribution of family income worldwide (CIA, Citation2010). Justification for this investment may be made from an economic perspective when examining the tourism sector, which attracts exogenous resources to South Africa. It is therefore necessary to evaluate whether the South African tourism sector did in fact benefit from the event.
There are, however, methodological difficulties in determining the economic impact from World Cup tourism. The findings of previous studies have differed substantially and provoked a lively debate about estimated economic effects. Impacts based on tourism are much more difficult to evaluate than the expenditures for infrastructure or the organising committee, and thus a more refined measurement model is needed. Studies have found contrasting economic effects on South Africa's GDP from the event, varying from 0.1% to 1.5% (Grant Thornton, Citation2003, Citation2004; Saayman & Rossouw, Citation2008:8; Swinnen & Vandemoortele, Citation2008:4; Du Plessis & Venter, Citation2010:20; Polity, Citation2010). These large differences reveal much uncertainty about the potential positive economic legacy of the 2010 World Cup. One reason for the variation is that supporting statistical evidence is missing. A closer look at the various authors' economic impact methodology reveals that different frameworks, many obstacles and great complexities have accounted for these disparate figures. For example, the Union Bank of Switzerland (PMG, Citation2010) estimates South Africa's tourism revenue from the World Cup at 0.54% of GDP for the year 2010, while Du Plessis and Venter (Citation2010:20) estimate it at 0.1% of GDP, but considering only the short period of the World Cup itself.
This paper offers a refined methodology for calculating the tourism impact of a sport mega-event on the economy of a country or region. Particular attention is paid to the difference between crowding-out effects and redistribution, using the 2010 FIFA World Cup as a case example. The methodology presented here can also detect the impact on smaller regions such as provinces or even individual host cities.
2. The concept of crowding-out
The difficulty of precisely calculating an economic impact lies in its complexity. Following Keyne's neoclassical model of economics and looking only at tangible and direct economic effects derived from the 2010 World Cup, the central observation must work towards determining whether fresh resources were entering South Africa.
It is therefore important to determine (a) the welfare function, (b) a particular region and (c) a time frame for each study. These three factors define what financial streams must be considered for an economic impact. All direct financial streams are easy to measure – however, difficulties arise when crowding-out must be taken into account. Crowding-out is any reduction in private consumption that occurs because of an increased demand based on the staging of the event, here in particular the football tourists' demand.
shows that the increase in demand would have led to an increase in quantity by delta Q. Because of limited capacities, the prices increased and thus crowded out a part of the expected quantity Q. This can be called pecuniary crowding-out, since it is purely the price effect. For example, in South Africa this was the case for flight and accommodation packages (Du Plessis & Maennig, Citation2010b:268). Hunting tourists in particular were affected because the World Cup occurred during the peak hunting season (The Star, Citation2010). However, potential visitors may also have been more literally crowded out (they would not like going to a place that would be overcrowded), thus causing the demand curve to shift towards the left.
Figure 1: Price crowding-out
The diagram on the left-hand side of illustrates the importance of defining a region. Streams 1 and 2, representing football tourists' consumption, both have a positive impact on the city. If the region is defined as a state, only streams 1 and 3 have an impact, while stream 2 must be considered as redistribution. If the World Cup is the reason for city residents leaving the city or the region, shown as streams 4 and 5, this crowded-out consumption must be deducted. If it is the region that is being studied, streams 4 and 6 must be deducted, while stream 5 must be considered as redistribution. Another case of crowding-out is stream 8, which represents people who intended to visit the city but decided not to because of the World Cup.
Figure 2: Principles of crowding-out
The diagram on the right-hand side of illustrates the time consideration. For simplicity, only a city perspective is taken and all the time considerations, including the pre and post event periods, are grouped together in one box. Note that visitors' consumption can be time switched – stream 7 represents the consumption during the event that would normally have occurred during another period. Stream 8 is split into two parts, 8a representing the consumption by visitors who wanted to visit the city during the event period but postponed their trip, and 8b representing those who really were crowded out, having cancelled their visit to the event city because of the event.
For the methodology to detect crowding-out, the above-mentioned groups must be considered, along with several others. To identify all football visitors bringing exogenous money to South Africa, we must consider the reasons for their visits. The methodology therefore integrates a behavioural act as the central element in an economic model. In other words, isolating the particular stream of money that creates the impact is not as simple as shown in . To discover whether consumption should be integrated into the calculation or not depends on the person's travel movement combined with how much effect the World Cup had on the person's decision to travel. For simplicity we focus on South Africa as a region, looking at .
Figure 3: Movements of event-affected persons during the 2010 FIFA World Cup
‘Extenders’ (A), ‘Football visitors’ (B) and ‘Home stayers’ (C) are World Cup visitors using exogenous resources for consumption. These create the core primary impact. The ‘Home stayers’ (C) are a typical example of ‘import substitution’ (Cobb & Weinberg, Citation1993) because these South Africans stayed at home and spent their holiday budget in South Africa and not outside the country.
While A, B and C add money to the South African economy, two groups of event-affected persons reduce this impact because they are crowded out – the ‘Cancellers’ (E1) and the ‘Runaways’ (D). The methodological challenge is to distinguish these two groups from those visitors who merely time switched their visit to South Africa. For example, residents avoiding the World Cup are not necessarily ‘Runaways’ (D). They can also be ‘Changers’ (F), i.e. individuals who time switch their holiday trip from another time of the year to the period of the World Cup. While ‘Runaways’ must be considered as crowded out, the ‘Changers’ do not spend more money outside South Africa than they would have done anyway. Similarly, while ‘Cancellers’ (E1) are crowded out, ‘Pre/Post switchers’ (E2) are not. While ‘Cancellers’ (E1) would not visit South Africa at any other time, ‘Pre/Post switchers’ (E2) have just postponed their visit.
To calculate the economic impact, ‘Changers’ (F) and ‘Pre/Post switchers’ (E2) must not be considered due to the time-shift in their consumption. However, the ‘Runaways’ (D) must be considered. This can be done either by a survey after the World Cup (a bottom-up approach) or by using statistics on individuals leaving the country (a top-down approach). The identification of ‘Cancellers’ (E1), who can be found only by using ex post trend calculations, is the focus of this paper (see also Preuss et al., Citation2010).
shows three other groups, the ‘Casuals’ (G), ‘Time switchers’ (H) and ‘Citizens’ (K). All of these would have spent their money in South Africa even without the World Cup and therefore are rather neutral in their contribution to the economic impact. However, all of them presumably spent more money on their normal holidays because of the World Cup being hosted than they would have without it.
provides evidence that the groups mentioned above really exist and are not marginal.
Table 1: Movements of event-affected persons at two FIFA World Cups (%)
The World Cup, as the event, must be the reason for the crowding-out of visitors or residents. Crowding-out can occur because of high prices of accommodation and transport (in particular air fare to South Africa) (Du Plessis & Maennig, Citation2010a; Fourie et al., Citation2011). But reasons for crowding-out are not limited to increased prices. Other deterrents for non-football tourists could be their perceptions that hotel rooms are scarce and high priced, and that there will be drunkenness, fan violence and hooliganism, and peak use of the public transport systems (Crompton, Citation1999; Baade & Matheson, Citation2004:19; Loots, Citation2006; Du Plessis & Maennig, Citation2010b:16).
Furthermore it is important to consider who gets crowded out. The potential ‘football tourists’ who do not come to the World Cup because tickets are either not available or too expensive are people who would not have come to South Africa for some other reason. Therefore this group (8b in ) is not to be considered in an economic impact calculation.
Crowding-out must be distinguished from redistribution. Redistribution occurs when there is spending in an unplanned way at another time (these are the ‘Time switchers’ or ‘Pre/Post switchers’) or in a different economic sector. For example some South African tourists may have avoided visiting World Cup cities but spent their travel budget in other cities in South Africa or for other consumption. The central question is whether the money is spent in the same economic sector but at a different location and/or time or in another economic sector. If the money is being spent in another sector, the question is whether that sector has a greater added value (e.g. higher wage share or labour intensity). A greater added value benefits all citizens working in the tourism industry. In reality, positive and negative kinds of redistribution can be expected (for which further research is needed). To simplify the impact calculations we can consider that the positive and negative effects cancel each other out and therefore do not need to be considered.
The change in consumption behaviour, a so-called re-allocation of expenditures, is also true for the South African citizens. They may either have spent less temporarily, because they watched the matches on television at home (the ‘couch potato effect’), or more because they watched the matches in pubs or went to the stadiums. To calculate the impact of these changes we must ask two questions:
| 1. | Has this different consumption behaviour because of the World Cup changed the individual long-term propensity to save? | ||||
| 2. | Did consumption as a result of the World Cup cause money to be directed to an economic sector other than the one it would have been directed to had it not been for the World Cup?Footnote1 | ||||
Again, further research is needed on these questions. For the purposes of this paper we ignore these issues and take them as being neutral (see Ahlert, Citation2006:13).
Finally, we can sum up and define crowding-out in event tourism thus:
The concept of ‘crowding-out’ applies only to non-event related persons who cancel their planned visit to the event destination because real or perceived capacity constraints, price increases or other unpleasant effects of the World Cup make them unwilling or unable to switch the time or place of their visit.
3. Literature review
The international literature on the economic impacts of sport mega-events is growing. Most of the scholarly works on football tournaments describe the methodology they use to analyse the impact of the visitors (Preuss, Citation1998; Coates & Humphreys, Citation2000; Szymanski, Citation2002; Baade & Matheson, Citation2004; Ahlert, Citation2006; Kurscheidt, Citation2006; Oldenboom, Citation2006; Bohlmann & Van Heerden, Citation2008; Preuss et al., Citation2009; Allmers & Maennig, Citation2009; Du Plessis & Maennig, Citation2010a; Fourie & Santana-Gallego, Citation2011; Fourie et al., Citation2011). In particular, Getz Citation(1994), Crompton Citation(1995) and Késenne Citation(1999) write about the overall evaluation problems. Norman et al. Citation(2002) point out several shortcomings in the evaluation of tourism impacts, saying that there is often confusion about the economic impact because the benefits are different for the different stakeholders. They also say there is confusion in assessing the regional impact because of difficulties in differentiating ‘new dollars’ from outside the region from local spending. This paper addresses these shortcomings below, in regard to crowding-out.
It is clear from the existing literature that one of the main hurdles in determining the economic impact of the 2010 World Cup is a lack of information about visitors' consumption patterns and the number of people visiting (or not visiting) South Africa. Nevertheless the calculation – based on estimations – of the economic impact on South Africa has stimulated considerable research activity over the past eight years (see ).
Table 2: Economic impact studies of the 2010 FIFA Football World Cup
There is no specific literature on crowding-out effects related to mega-event impact measurement. However, many authors have mentioned the importance, and difficulty, of measuring crowding-out. Porter warns that crowding-out and price increases by input suppliers in response to higher levels of demand and the tendency of suppliers to lower prices to stimulate sales when demand is weak lead to overestimates of net new sales due to the event (Citation1999). Impact studies are therefore constantly criticised whenever crowding-out is not considered (Baade & Matheson, Citation2004; Lee & Taylor, Citation2005; Matheson, Citation2006; Barclay, Citation2009). Saayman and Rossouw observe that in impact studies of the 2010 World Cup crowding-out ‘was not taken into consideration’ and they say that their literature review ‘indicated clearly the necessity of taking into account the great number of factors which influence the number of visitors that attend the event, and thus also the magnitude of spending’ (2008:11).
Other authors who mention the importance of crowding-out do not measure its nominal magnitude but capture it by econometric modelling. Fourie and Santana-Gallego Citation(2011) attempt to measure the impact of mega-events on tourist arrivals using the most advanced approach, a gravity equation. They find evidence that mega-events attract ‘additional’ tourism arrivals. However, their results show differences in outcome depending on the type of event, the income per capita of the host country, and the timing of the event, since the number of tourist arrivals differs significantly depending on which nation is hosting the event (see also Spronk & Fourie, Citation2011).
The present paper therefore provides a methodology that considers not only the number of arrivals but also the magnitude of visitor spending. Further, these calculations can be adapted to various levels, for example a city, a province or the whole country.
Although tourist arrival statistics are readily available in South Africa, there is no consistency (Saayman & Saayman, Citation2008:84) in the data collected for expenditures by the tourists and their receipts (Spronk & Fourie, Citation2011). The methodology proposed here is therefore particularly relevant for South Africa.
4. The measurement problem
provides a scheme showing the basic considerations for calculating the economic impact of visitors' consumption on the World Cup host.
Figure 4: Scheme of persons affected by the 2010 FIFA World Cup
During the 2010 World Cup many people visited South Africa whose trip was unrelated to the event (e.g. business travellers, people visiting their families, safari tourists) but there were also people who were affected by the event. shows that these could be foreign tourists (‘Cancellers’, ‘Pre/Post switchers’, ‘Casuals’, ‘Time switchers’, ‘Football visitors’ and ‘Extenders’) as well as South African residents (‘Home stayers’, ‘Runaways’, ‘Changers’ and ‘Citizens’). The challenge for the methodology is to determine the number of visitors in each group, the magnitude of their spending and the duration of their stay. This information cannot be gathered using the available statistics in South Africa and econometric modelling.
| • | ‘Football visitors’ and ‘Extenders’ add their full consumption to the impact. | ||||
| • | ‘Cancellers’ reduce the number of individuals travelling to South Africa and therefore their normal tourist consumption pattern must be subtracted from the impact. | ||||
| • | ‘Pre/Post switchers’ will come to South Africa at another time, so this loss of consumption during the World Cup will just be shifted to another period. | ||||
| • | ‘Casuals’ are visiting South Africa irrespective of the World Cup, but because of the increased prices they might even contribute to the economic impact. | ||||
| • | ‘Time switchers’ increase the demand during the World Cup without affecting the impact substantially as they would have come to South Africa anyway. | ||||
The consumption by the individuals who are not in South Africa during the World Cup (‘Cancellers’ and ‘Pre/Post switchers’, see right-hand diagram in ) is most probably overcompensated for by the sum of the consumption by ‘Football visitors’, ‘Casuals’ and ‘Time switchers’.
At first glance, it seems feasible to calculate the number of tourists visiting South Africa specifically because of the World Cup by using the top-down approach and statistics on tourism arrivals or overnight stays. Using econometric models that compare the figures with those of previous years and from other countries by using proxies to capture global impacts on tourism theoretically provides an estimation of the net number of World Cup visitors or overnight stays but has three serious shortcomings.
The first shortcoming lies in the number of event visitors who arrived long before the event or time-switched their visit. The absolute number of these visitors to South Africa is too small to be detected by econometric modelling using the available aggregated national statistics. In particular the time-switching behaviour of those avoiding the World Cup can result in shifts of up to one year and disappear in statistics around the time of the event. If detected, this time-switching can hardly be distinguished from crowding-out. As anecdotal evidence of time-switching, in 2009 Indians shifted their planned visits during June and July to May to coincide with the Indian Premier League (IPL) event. Spronk and Fourie Citation(2011) found that 54.3% fewer Indians visited South Africa in June and July 2009 but there was a 59.7% increase during the 2009 IPL in May. A similar effect was observed during the World Cup in Germany in 2006. A large number of Greeks and Turks live as foreign nationals in Germany, generally receiving a large number of family visitors every year. During the World Cup period, however, 26.5% fewer Greeks and 18.6% fewer Turks stayed overnight in Germany, although over the year the total number of Greeks increased by 8.8% and the number of Turks by 1.1%, compared with 2005 (DZT, Citation2007:13). This indicates a very large time-switching effect.
Using econometric models, one must then use annually or even biannually aggregated data to capture all the time-switching effects. However, this means that all irregularity in tourism, for example natural, political or criminal incidents over one year, will be counted as being a World Cup effect. Econometrists tend to use proxies to capture these special effects, which must then be done for all years and all countries considered. However, we need to ask how these proxies are built. If the dollar price of Brent crude oil per barrel is used as a proxy for travel costs (Spronk & Fourie, Citation2011), it becomes clear that complex issues such as travel costs must be simplified to such an extent that the econometric modelling will in the end not be precise enough for the purpose of impact calculation.
The second shortcoming is that the statistics are often not as precise as required. For example, many South African statistics, such as those for accommodation, are either only available for a monthly period or do not distinguish between foreign visitors and nationals. Furthermore, arrival statistics on inbound tourism to South Africa do not consider the fact that overnight stays may be extended to include further nights and thereby create additional consumption. In European Union countries this is even more difficult to measure, because visitors arriving by car or train from other EU countries are not counted at all. In addition, the fact that ‘Home stayers’ do not leave the country and therefore do not return to South Africa decreases the number of inbound tourists but creates a consumption impact. Only a mixed model considering inbound and outbound tourists to and from South Africa would make this effect visible.
This issue becomes yet more complex when the region under consideration is not the whole country of South Africa but only a province or host city. Arrival statistics of inbound tourists to, for example, Durban are not even available. It would therefore be better to use tourist accommodation statistics. However, these statistics only consider visitors staying in registered accommodation. ‘Home stayers’ and foreign visitors renting flats, staying in caravans or with friends and family are not registered. On the other hand nationals – who are not accounted for in an impact calculation – staying in hotels are registered. For example, 31% of all overseas tourists attending the 2006 FIFA World Cup in Germany did not stay in registered accommodation (Preuss et al., Citation2009:121) and the economic impact would have been disregarded had these statistics been used. This effect is overlooked by Maennig and co-authors (Allmers & Maennig, Citation2009; Hagn & Maennig, Citation2009), who state that at the 2006 World Cup visitor numbers appear little different from the counterfactual of normal tourist arrivals. At the EURO 2008 in Austria almost 71% of all stadium visitors did not stay in official accommodation (Preuss et al., Citation2010:77). It would therefore be better to use tourist traffic revenue statistics. However, if they are available, these statistics will also not be precise enough because several kinds of tourism expenditure cannot be considered (see Preuss et al., Citation2009:259).
The third shortcoming is that statistics available in South Africa cannot consider the magnitude of spending by those individuals who have to be considered in an impact calculation. Additionally, ‘Home stayers’, who signify import substitution, are not taken into account in the impact calculation, since they are nationals and therefore appear as persons not adding to the consumption impact. According to empirical findings, event visitors (‘Football tourists’, ‘Casuals’ and ‘Time switchers’) consume more than normal tourists (Solberg et al., Citation2002; Lee & Taylor, Citation2005; Preuss et al., Citation2010). For example, even if the number of crowded-out individuals equals those coming because of the World Cup – which could be a finding using the gravity model from Fourie and Santana-Gallego (2011) – there can in reality be a very positive impact due to higher spending by football tourists replacing normal tourists, considerable import substitution by nationals staying home to attend the World Cup, and a longer duration of stay by those visitors who are already in South Africa.
All the studies on the 2010 World Cup mentioned above are based on top-down approaches. Most advanced are the gravity model and the time-series auto-regressive model used by the two ex post studies (Fourie & Santana-Gallego, Citation2011, and Spronk & Fourie, Citation2011, respectively). Both of these papers contain problems, such as being based on much estimation to build proxies (e.g. fuel prices for travel costs) or on data interpolated if not available (e.g. quarterly data split into monthly data). Other problems are that they miss effects that disappear in white noise (e.g. time switching over more than three months) or consider effects that are not taken out by proxies.
To summarise, when they try to calculate impact by taking crowding-out into account, these studies struggle to identify the true economic impact because:
| 1. | They do not take into account the fact that World Cup tourists have a different consumption pattern from normal tourists. | ||||
| 2. | They do not consider import substitution. | ||||
| 3. | They confuse time-switching with crowding-out (in particular when the time-switching disappears in white noise) – which would be non-significant changes in econometric modelling. | ||||
| 4. | They do not calculate the exact number of additional tourists coming specifically for the World Cup – a single event. The most precise that Fourie and Santana-Gallego (2011) can get with their advanced gravity model is to say that ‘mega-sporting events increase predicted tourism by roughly 8% in the same year’ but that there are, however, ‘large disparities between the types of event’. They cannot distinguish whether these discrepancies stem from displacement or from the type of event. | ||||
| 5. | As a result of the above problem, they do not distinguish the World Cup stimulus from all the other (smaller) interventions that take place during the same period. These cannot all be represented by proxy variables. | ||||
These are precisely the reasons why one should tackle the problem by using a bottom-up approach, which means measuring the primary tourism impact by looking at its actual origin. In doing so, complex and costly empirical research must be conducted to measure the gross number of visitors and the share of those staying in statistically registered accommodation, their number of overnight stays, their motivation for the visit () and finally their individual consumption pattern.
However, the bottom-up approach also has shortcomings. Field research cannot detect ‘Cancellers’ (E1) or ‘Pre/Post switchers’ (E2) or ‘Runaways’ (D). Therefore, some statistical data (top-down) are needed, which are quite reliable because the information needed is limited to the number of overnight stays by foreign tourists in South Africa (or another region under consideration) on a monthly basis. All further necessary data can be taken from the evaluated empirical data and a small amount of estimation.
5. The calculation of crowding-out
To determine the number of potential overnight stays by foreign World Cup visitors to South Africa during June and July 2010 that were crowded out, it is necessary to calculate trends (line a, ).
Figure 5: Schematic illustration of opportunity costs
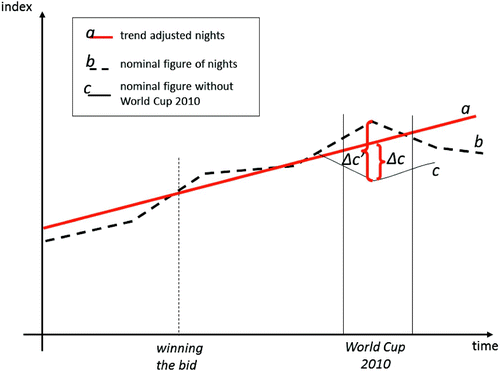
Line b in represents the real measured number of overnight stays by foreign visitors during the World Cup. For simplicity a linear trend is used. The fact that a slightly higher number of overnight stays can be expected for the period after winning the bid is ignored for trend calculation. This is a conservative approach, as the numbers of overnight stays tend to increase as the event draws near (see Fourie et al., Citation2011), which will underestimate the result.
We assume that if the World Cup had not been staged the South African tourism industry would have continued with tourism advertisement efforts as before. By using trend calculations based on tourism development before the World Cup, we automatically consider the opportunity costs of advertising differently due to the World Cup. Line c in represents the number of overnight stays by foreigners whose reason for coming was not the World Cup. To consider the opportunity costs, the difference between the trend line a and the number of overnight stays without World Cup tourists (line c) is not taken into the impact calculation (Δ c). The gross nominal number of World Cup tourists' overnight stays – measured bottom-up – is shown as Δ c' (line b – line c), which must be reduced by the number of nights replacing those not coming to South Africa (crowded-out individuals and Pre/Post switchers) (Δ c) (line a – line c). This results in a net increase of overnight stays by foreign visitors (line b – line a). However, this is a simplified description because ‘Time switchers’ (H) and ‘Casuals’ (G) are not included yet. The model in displays the various time-switching groups.
Figure 6: Schematic illustration of overnight stays including time-switching
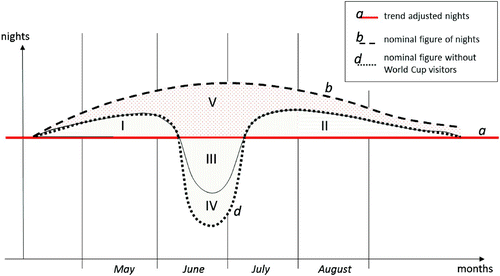
is based on . Here line a is still the trend adjusted expectation of overnight stays by foreign visitors (simplified by making it horizontal and linear) if the World Cup had not taken place but all tourism activities, crises and upswings had continued as in the past. Line b is still the real number of overnight stays as shown in the official statistics. In other words, the difference between line a and line b (area V) is the net increase in overnight stays due to the World Cup.
An important premise of this model is that only those crowded-out individuals (‘Avoiders’ (E) – see ) who would have stayed in official accommodation can be considered.
For simplicity, in line b is shown above line a, representing a net gain of overnight stays by foreign visitors despite crowding-out and time-switching.
One limitation of the model is that the crowding-out of overnight stays is fully calculated while the time-switching effect is only considered for the periods just before and after the World Cup (areas I and II in ). It is highly probable that some people postponed their trip to South Africa not only for a month or two but for a year. For example, the hunting season or school vacation is limited to a particular time of the year, so trips for these purposes cannot be postponed for one or two months but must be put off to a year later. This effect can be compensated for by adding in a (small) percentage of overnight stays for the time-switching to periods before and after the already considered pre- and post-event periods. This is later considered as ‘correction 1’ (corr1). It is also possible that ‘Time switchers’ (H) overcompensate for ‘Pre/Post switchers’ (E2). In that case corr1 is negative.
Line d is hypothetical and illustrates the overnight stays by foreign visitors in South Africa, not including any football tourists but with time-switching taking place because of the World Cup. It can be seen that ‘Pre/Post switchers’ (E2) reduce the number of overnight stays during the World Cup period (area III) but increase the pre- and post-World Cup stays (areas I and II), whereas III equals I plus II. Area V above area I and II represents the number of overnight stays by foreign visitors who come because of the World Cup but who are not time switching (people attending training camps or football conferences, carrying out FIFA inspection visits, acting as consultants to organising committees, and so on). This number of overnight stays is later considered as ‘correction 2’ (corr2).
The main aim of is to illustrate the lost overnight stays by those foreigners who are really crowded-out (area IV – ‘Cancellers’ (E1)). The following steps explain how to calculate the number of overnight stays lost because group E1 did not come. This number of overnight stays needs to be replaced by other football visitor groups. We start from bottom-up field research (steps 1 to 4) and use top-down accommodation data from official statistics (steps 5 and 6).
| 1. | Carry out field research to evaluate all foreign visitors to the World Cup 2010: the reason for their visit, their consumption pattern, the type of accommodation they use, and the duration of their stay (see Preuss et al., Citation2009, for methodology). | ||||
| 2. | Subtract all foreign day tourists, a number that was very low for South Africa, but high for the FIFA World Cup in Germany 2006 (Preuss et al., Citation2009; Swart et al., Citation2010). | ||||
| 3. | Convert ‘visitor days’ in South Africa into overnight stays (i.e. two days = one night). | ||||
| 4. | Subtract those who did not stay in statistically counted accommodation (those who stayed with family and friends, camped outside official caravan parks, rented a private flat, stayed overnight in trains, and so on). At this point the gross number of overnight stays by all foreign visitors to the World Cup (groups A, B and H, in ), calculated bottom-up, is known. | ||||
| 5. | Calculate the difference in overnight stays from statistical data with the calculated trend-adjusted number of overnight stays expected without the World Cup (line a), including the pre- and post-World Cup periods, by taking into consideration only foreign visitors to South Africa (area V, including corr2). | ||||
| 6. | Increase or decrease the number of overnight stays by a small percentage (corr1) to cover those time switching for more than the considered pre- or post-World Cup period. | ||||
At this point the gross number of visitors above or below the trend is known, including the number of long-term time switchers.
When we compare the empirically measured adjusted number of overnight stays (after step 4) with the statistically available adjusted number of overnight stays by foreign visitors (after step 7), the crowding-out effect becomes visible. The hump (area V in ) can only be as large as line b allows because this is the official statistical data. If there are more ‘Time switchers’ (H) and ‘Football tourists’ and ‘Extenders’ (A and B) that fit between line a and line b we can identify the number of overnight stays missing due to the groups who cancelled their visit to South Africa, or changed the time of their planned visit because of the World Cup (E1 and E2).
shows the calculation once more, now including the different consumption patterns (column 5) that are necessary for impact calculation.
Figure 7: Schematic visualisation of gross and net effects for economic impact calculation during the World Cup
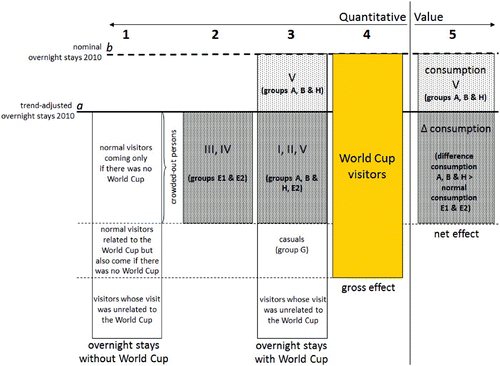
must be read from left to right and is based on the abbreviations used in and . The trend adjusted curve is again line a and the real measured number of overnight stays by foreign visitors is line b. The following explains columns 1 to 5 and refers to foreign visitors only.
Column 1 shows the number of overnight stays by foreign visitors based on trend calculation from previous periods had the World Cup not been staged. Using the trend means that opportunity costs are considered.
Column 2 shows the number of overnight stays by those who did not come to South Africa during the period of the World Cup, including ‘Pre/Post switchers’ (E1 and E2).
Column 3 shows the absolute number of overnight stays during the World Cup period, but corrected by a percentage to cover the ‘Time switchers’ for more than the considered pre/post period (corr1). For simplicity, we assume that corr1 is compensated for by those who came in the pre/post period (corr2). The ‘Pre/Post switchers’ (E2) are factored in by number because column 3 represents the World Cup period and the pre/post period. Remember that area III is equal to area I and II (see ). The lowest boxes include visitors whose visit was unrelated to the World Cup (for example business travellers and normal tourists). Above these are the ‘Casuals’ (G), who are staying in South Africa for other reasons but also attending World Cup matches, and above these are groups A, B, H and E2, who replace the crowded-out overnight stays (E1).
Column 4 shows the gross number of overnight stays.
Column 5 explains the consumption pattern that needs to be considered for the impact calculation. Here, for all crowded-out nights (E1) and ‘Pre/Post switchers’ nights (E2), the difference in consumption between a normal tourist and a World Cup tourist must be considered. For all above line a the full consumption pattern is factored into the impact calculation.
To calculate the crowding-out effect, double counting must be avoided. The following equation helps to calculate the effect, using abbreviations for the visitor groups A, B, H, E1 and E2 from .
Δ(pre/post) = number of overnight stays by foreign visitors between line a and line b for the periods pre- and post-World Cup
corr1 = all overnight stays by foreign ‘Pre/Post switchers’ before and after the period under consideration
corr2 = additional overnight stays by foreign visitors before and after the event due to the World Cup who are not time switching
Δ(World Cup)= number of overnight stays between line a and line b for the period of the World Cup
E2 = Δ(pre/post) + H + corr1 – corr2 (1)
E1 = A + B + H + corr1 – (Δ(World Cup) + Δ(pre/post) + H + corr1 – corr2) (2)
E1 = A + B – Δ(World Cup) – Δ(pre/post) + corr2 (3)
For E1 it is important to interpret whether
A + B – Δ(World Cup) – Δ(pre/post) + corr2 < 0 (4)
or
A + B – Δ(World Cup) – Δ(pre/post) + corr2 > 0 (5)
If Equation 4 is correct, the number of overnight stays by foreign World Cup visitors and ‘Time switchers’ (H) does not compensate for the number of overnight stays by ‘Pre/Post switchers’ (E2). Thus line b must be below line a. Otherwise either the trend was not estimated correctly or other interventions increased the number of overnight stays. This does not necessarily mean there was no crowding-out, but it was probably low.
If Equation 5 is correct, the number of overnight stays represents the number of crowded-out overnight stays. For further calculation, this number multiplied by the consumption pattern of normal tourists must be subtracted from the calculation of the overall primary impact.
6. Conclusion
Even though many scholars claim that crowding-out must be considered in impact calculations, there has so far been no methodology available to factor this effect into impact studies. Fourie and Santana-Gallego Citation(2011) test crowding-out for the 2010 World Cup in South Africa using a gravity model and offer some evidence that major events in South Africa had an impact on the tourism sector but cannot calculate the level of impact from their findings. The missing consideration of crowding-out has constantly aroused concern and provoked criticism of impact studies conducted on mega-events. Critics have often estimated crowding-out to be equivalent to the number of foreign visitors coming to an event. However, this simply formulated criticism frequently disregards four facts:
| 1. | Crowding-out is limited to those individuals who entirely give up their serious intention to visit the country because of the World Cup. Critics disregard the group of ‘Pre/Post switchers’, which is potentially a huge group because the World Cup 2010 – after running so successfully – probably did not deter people from visiting South Africa but only made them change the time of their visit. Only the (perceived) limited capacities and price conditions in South Africa made them advance or postpone their trip. In fact, a successfully staged World Cup 2010 may have only increased their desire to visit the country at some other time. | ||||
| 2. | The foreign visitors who were crowded out and the ‘Pre/Post switchers’ would have had a normal tourist consumption pattern. Even if statistics do not show an increase in the number of overnight stays, World Cup tourists' consumption is often greater than that of normal tourists. Therefore a positive primary impact of the World Cup is still a given. | ||||
| 3. | All calculations of potential crowding-out must be limited to foreign visitors' overnight stays. Domestic tourists' shift in consumption and/or travel behaviour only results in differently induced effects due to the stimulation of other economic sectors attracting the consumption. | ||||
| 4. | The top-down data must be given for overnight stays by foreign visitors only. The number of incoming tourists, a parameter which is often used, does not consider the different travel behaviour of World Cup visitors (i.e. the duration of their stay in comparison to normal tourists). | ||||
The methodology described in this article calculates spending by tourists who stay in officially registered accommodation or those crowded out from official accommodation. A weakness of the model is that it is difficult to estimate the number of foreign overnight stays that would have been made in South Africa had it not been for the World Cup. In particular, the trend prediction cannot consider ‘wild card’ interventions such as the worldwide financial crisis in 2009 and its effect on South Africa's tourism industry. Each wrongly calculated trend will affect the calculation of the World Cup impact. This aspect must be taken seriously. We can calculate the impact more easily and precisely if we make the region under investigation smaller and the periods before and after the event shorter (defining the ‘Pre/Post switchers’). Doing this, however, means that we need to make higher corrections (corr1 and corr2, see Section 5, above).
The strength of the methodology introduced here is that it combines bottom-up field research with some reliable official statistics, making it possible to estimate crowded-out visitors without counting time switchers. Furthermore, opportunity costs are considered. The methodology discussed in this article focuses solely on calculating the primary impact of foreign visitors on the South African economy during the World Cup period and the direct pre/post period. The legacy effects of long-term tourism are not included (see Solberg & Preuss, Citation2007; Preuss, Citation2007). It should be noted that the same methodology can be used to calculate crowding-out in event-related infrastructure investments.
Acknowledgements
The author would like to thank Markus Kurscheidt for helpful discussions on improving the quality of major event impact measurements, Stefan Szymanski for valuable comments, and Norbert Schütte for modelling the 8000 interviews conducted in South Africa during the World Cup.
Notes
1For example, money might be used for stadium construction that might otherwise have been used for, say, mining. Because labour intensity differs, the same money has different impacts when invested in different economic sectors.
Related Research Data
References
- Ahlert, G, 2006. Auswirkungen des zusätzlichen Incoming-Tourismus während der FIFA WM 2006TM auf die gesamtwirtschaftliche Entwicklung. GWS Discussion Paper 2006/1, Gesellschaft für Wirtschaftliche Strukturforschung (GWS), Osnabrück.
- Allmers , S and Maennig , W . 2009 . Economic impacts of the FIFA Soccer World Cups in France 1998, Germany 2006, and outlook for South Africa 2010 . Eastern Economic Journal , 35 : 500 – 19 .
- Baade , R A and Matheson , VA . 2004 . The quest for the Cup: Assessing the economic impact of the world cup . Regional Studies , 38 ( 4 ) : 343 – 54 .
- Barclay , J . 2009 . Predicting the costs and benefits of mega-sporting events: . Misjudgement of Olympic proportions? Institute of Economic Affairs , 29 ( 2 ) : 62 – 6 .
- Bohlmann , H R and Van Heerden , JH . 2008 . Predicting the economic impact of the 2010 FIFA World Cup on South Africa . International Journal of Sport Management and Marketing , 3 ( 4 ) : 383 – 96 .
- CIA (Central Intelligence Agency), 2010. The world factbook. Country comparison: Distribution of family income – Gini Index. http://www.cia.gov/library/publications/the-world-factbook/rankorder/2172rank.html Accessed 28 May 2011.
- Coates , D and Humphreys , BR . 2000 . The stadium gambit and local economic development . Regulation , 23 ( 2 ) : 15 – 20 .
- Cobb , S and Weinberg , D . 1993 . The importance of import substitution in regional economic impact analysis: Empirical estimates from two Cincinnati area events . Economic Development Quarterly , 7 ( 3 ) : 282 – 6 .
- Crompton , J L . 1995 . Economic impact analysis of sports facilities and events: Eleven sources of misapplication . Journal of Sport Management , 9 ( 1 ) : 14 – 35 .
- Crompton , J L . 1999 . Measuring the Economic Impact of Visitors to Sport Tournaments and Special Events , Ashburn, VA : National Recreation and Park Association .
- Du Plessis , S and Maennig , W . 2010a . Ökonomische Wirkungen der Fußball-WM 2010. Eine erste ex-post-Analyse . Jb. f. Wirtschaftswissenschaften , 61 : 262 – 78 .
- Du Plessis, S & Maennig, W, 2010b. The 2010 World Cup high-frequency data economics: Effects on international awareness and (self-defeating) tourism. Hamburg Contemporary Economic Discussions 37. University of Hamburg, Hamburg.
- Du Plessis , S and Venter , C . 2010 . The home team scores! A first assessment of the economic impact of World Cup 2010 . Department of Economics, Stellenbosch University , http://www.ekon.sun.ac.za/wpapers/2010/wp212010/wp-21-2010.pdf Accessed 25 September 2010
- DZT (Deutsche Zentrale für Tourismus), 2007. Jahresbericht 2006. DZT, Frankfurt am Main.
- Fourie , J and Santana-Gallego , M . 2011 . The impact of mega-events on tourist arrivals . Tourism Management , 32 forthcoming
- Fourie , J , Siebrits , K and Spronk , K . 2011 . Tourist displacement in two South African sport mega-events . Development Southern Africa , 28 forthcoming
- Getz, D, 1994. Event tourism: Evaluating the impacts. In Ritchie, JRB & Goeldner, CR (Eds), Travel, Tourism and Hospitality Research: A Handbook for Managers and Researchers. John Wiley & Sons, New York.
- Grant Thornton, 2003. South Africa 2010 soccer World Cup bid executive summary. http://wiredspace.wits.ac.za/bitstream/handle/10539/5950/Appendix.pdf?sequence=2 Accessed 25 September 2010.
- Grant Thornton, 2004. 2010 Soccer World Cup facts you should know. http://www.gauteng.net/research/pdf/soccer1.pdf Accessed 25 September 2010.
- Hagn , F and Maennig , W . 2009 . Large sport events and unemployment: The case of the 2006 Soccer World Cup in Germany . Applied Economics , 41 ( 25 ) : 3295 – 302 .
- Késenne , S . 1999 . The impact of salary caps in professional team sports . Scottish Journal of Political Economy , 47 ( 4 ) : 422 – 30 .
- Kurscheidt , M . 2006 . “ The World Cup ” . In Handbook on the Economics of Sports , Edited by: Andreff , W and Szymanski , S . Cheltenham, , UK & Northampton, MA : Edward Elgar .
- Lee , C K and Taylor , T . 2005 . Critical reflections on the economic impact assessment of a mega-event: The case of 2002 FIFA World Cup . Tourism Management , 26 ( 4 ) : 595 – 603 .
- Loots , E . 2006 . Road map for Africa's recovery: Challenges and recommendations for structural reform . Africa Insight , 36 ( 3 ) : 3 – 4 .
- Matheson , V A . 2006 . Mega-events: The effect of the world's biggest sporting events on local, regional, and national economies . Research Series, No. 06–10, College of the Holy Cross, Worcester, MA
- Norman , W , Backmann , S and Backmann , K . The changing face of tourism impact analysis . Proceedings of the national extension tourism conference . September 16–19 . Traverse City, MI
- Oldenboom, E, 2006. Cost and Benefits of Major Sports Events. MeerWaarde Onderzoeksadvies, Amsterdam.
- PMG (Parliamentary Monitoring Group), 2010. National Assembly, Question No. 107, for oral reply, 25 August, asked by Rev. KRJ Meshoe, reply by Minister of Economic Development. http://www.pmg.org.za/node/22995 Accessed 3 June 2011.
- Polity, 2010. South Africa's hosting of FIFA World Cup brought economic benefits. Creamer Media, Garden View. http://www.polity.org.za/article/sas-hosting-of-fifa-world-cup-brought-economic-benefits-2010-07-30-1 Accessed 25 September 2010.
- Porter, P, 1999. Mega-sports events as municipal investments: A critique of impact analysis. In Fizel, JL, Gustafson, E & Hadley, L (Eds), Sports Economics: Current Research. Praeger, New York.
- Preuss , H . 1998 . Problemizing arguments of the opponents of Olympic Games Edited by: Barney , R K , Wamsley , KB , Martyn , S G and MacDonald , G H . Global and Cultural Critique: Problematising the Olympic Games. International Symposium for Olympic Research, London, Ontario, Canada
- Preuss , H . 2005 . The economic impact of visitors at major multi-sport events . European Sport Management Quarterly , 5 ( 3 ) : 283 – 305 .
- Preuss , H . 2007 . The conceptualisation and measurement of mega sport event legacies . Journal of Sport & Tourism , 12 ( 4 ) : 207 – 28 .
- Preuss, H, Kurscheidt, M & Schütte, N, 2009. Ökonomie des Tourismus durch Sportgroßveranstaltungen. Eine empirische Analyse zur Fußball-Weltmeisterschaft 2006. Gabler, Wiesbaden.
- Preuss, H, Siller, H, Zehrer, A, Schütte, N & Stickdorn, M, 2010. Wirtschaftliche Wirkungen und Besucherzufriedenheit mit der UEFA Euro 2008™. Eine empirische Analyse für Österreich. Gabler, Wiesbaden.
- Saayman , M and Rossouw , R . 2008 . The economic value of the 2010 Soccer World Cup . Acta Commercii , 8 : 1 – 14 .
- Saayman , A and Saayman , M . 2008 . Determinants of inbound tourism to South Africa . Tourism Economics , 14 ( 1 ) : 81 – 96 .
- Solberg , H A and Preuss , H . 2007 . Major sport events and long-term tourism impacts . Journal of Sport Management , 21 ( 2 ) : 215 – 36 .
- Solberg , H A , Andersson , TD and Shibli , S . 2002 . An exploration of the direct economic impacts from business travelers at world championships . Event Management , 9 ( 3 ) : 20 – 8 .
- Spronk , K and Fourie , J . 2011 . South African mega-sports events and their impact on tourism . Journal of Sport & Tourism , 16 ( 1 ) : 75 – 97 .
- Swart , K , Bob , U , Turco , D , Tichaawa , T , Preuss , H and Schütte , N . 2010 . Visitor data on the FIFA World Cup 2010 . Unpublished manuscript. University of Mainz, Mainz ,
- Swinnen, JFM & Vandemoortele, T, 2008. Sports and development: An economic perspective on the impact of the 2010 World Cup in South Africa. International Council of Sport Science and Physical Education Bulletin 53. LICOS Centre for Institutions and Economic Performance – Katholieke Universiteit Leuven, Leuven.
- Szymanski , S . 2002 . The economic impact of the World Cup . World Economics , 3 ( 1 ) : 169 – 77 .
- The Star, 2010. Hunting industry maimed by pricey tourism event. 23 June, p. 17.