Abstract
In Botswana, as in many developing countries, food fortification is a potential strategy for addressing the malnutrition of low income groups. This article examines the potential costs of mandatory fortification of sorghum and maize flour for firms in Botswana. The results indicate that unit average fortification costs in pula per metric ton of flour range from 183 to 271, 118 to 170 and 103 to 149 (US$1 = P6.4 in 2007), respectively, for a typical small, medium and large firm. It is argued that the imposition of mandatory fortification may be feasible for large and perhaps some medium firms. However, small and (some) medium firms, are likely to collapse and exit the industry as a result of such action. A potentially realistic and sustainable option for small firms would be to consolidate so as to increase their scale of operation and avoid absolute collapse. However, public funding may be required to support such consolidation.
1. Introduction
Until the 1980s, interventions for alleviating malnutrition in developing countries focused on protein-energy malnutrition (PEM) (Allen et al., Citation2006). However, since then micronutrient malnutrition, which is widespread in poor countries because of food shortages and lack of diet diversity, has received increasing attention. The most common forms of micronutrient malnutrition are iron, vitamin A and iodine deficiencies.
Several measures have been proposed to address malnutrition problems. Among these measures are ‘food fortification, dietary diversification, dietary supplementation, nutrition education, and public health measures to control internal parasites and other infectious diseases’ (Haas & Miller, Citation2006:1053). Although such measures are complementary, food fortification, which has been successfully implemented in industrialised economies for more than 80 years, may be the most feasible and cost effective (Haas & Miller, Citation2006; Rosenberg, Citation2007).
Food fortification has recently become an attractive strategy for addressing malnutrition in developing countries (Allen et al., Citation2006). Following the notable success in reducing the prevalence of vitamin A deficiency in Central America through sugar fortification, similar programmes are now emerging elsewhere. For example, an experimental phase for rolling out the sugar fortification programme to sub-Saharan Africa is taking place in Zambia (Allen et al., Citation2006). Furthermore, voluntary and mandatory cereal fortification programmes have recently gained prominence in sub-Saharan Africa, where maize meal is the most commonly used food vehicle (MOST, Citation2000).
If appropriate food vehicles are selected, food fortification can improve the nutritional status of a large segment of the population without requiring drastic changes in consumption patterns (Allen et al., Citation2006). According to the 1994 micronutrient survey in Botswana, most households consumed cereals, particularly maize and sorghum, every day regardless of the season and the consumer's social status (Belbase et al., Citation1996). Thus, for any fortification programme to be effective in combating malnutrition in Botswana it must consider maize and sorghum as potential food vehicles.
As with other developing countries, the most common forms of malnutrition in Botswana are PEM and deficiencies in micronutrients such as vitamin A, iron and iodine (Belbase et al., Citation1996). To help combat malnutrition, the Rural Industries Innovation Centre (RIIC) in Botswana recently developed a manually fed ribbon mixer intended for small-scale sorghum or maize fortification. The National Food Technology Research Centre (NFTRC), also in Botswana, is currently promoting voluntary sorghum flour fortification using the RIIC equipment and imported premix (from South Africa), which is used for maize fortification in South Africa.
This article examines the potential fortification costs for existing firms in the industry, assuming they adopt the NFTRC/RIIC technology. The rest of the article is organised as follows. Section 2 provides an overview of the state of malnutrition in Botswana. This is followed in Section 3 by a discussion of the state of cereal fortification in Botswana. Section 4 analyses the structure of the milling industry, using survey data collected in 2005. Section 5 presents the methodology for identifying fortification costs at the firm level. The fortification costs results are presented in Section 6 and their implications for mandatory fortification of staple cereals in Botswana are discussed. Section 7 concludes with policy recommendations.
2. State of malnutrition in Botswana
The extent and nature of malnutrition in Botswana has not been well researched. The most recent national study was conducted for the Ministry of Health in 1994 (Belbase et al., Citation1996). However, this study was not comprehensive in population coverage as it was restricted to women of child-bearing age and children since, according to Allen et al. Citation(2006), these sections of the population are at a higher risk. As is the case elsewhere, the study established that the most common forms of malnutrition were PEM and deficiencies in micronutrients such as vitamin A, iron and iodine.
With respect to PEM, nutrition surveillance reports indicate that 26% of children under five were stunted in 1993, compared to 23% in 2000 (MoH, Citation2005a). The incidence of wasting in children under five was estimated at 6% in 1993 and 5% in 2000. In 1994, 2% and 35% of the children respectively had deficient (severe) and moderate vitamin A status. Thus, vitamin A deficiency is a public health problem in Botswana, as the rate surpasses the World Health Organisation's cut-off point of 20% (WHO, Citation1996).
Anaemia prevalence has been used as a proxy for iron deficiency. In 1994, 38% of the sampled children under the age of six were anaemic, which was comparable to the general picture in developing countries (Belbase et al., Citation1996). In the same year, 33% of the women were anaemic, slightly lower than the developing country average of 40%. Goitre prevalence was reported at 16.5% in 1994, with a visible goitre rate of 0.8%; urinary iodine excretion ranged from 167 to 310 µl/l, with the exception of one district where it was estimated at 67.5 µl/l. Thus, iodine deficiency disorder (IDD) was considered to be mild in Botswana on the basis of standard cut-off points for IDD by the International Council for the Control of IDDs (Belbase et al., Citation1996). This may be because iodised salt is distributed through retail outlets in most parts of Botswana.
Since the 1994 study, new nutritional challenges have arisen because of an increase in the incidence of health problems such as tuberculosis, HIV/AIDS, diabetes, cardiovascular diseases, hypertension, gout and obesity (MoH, Citation2005b). Many of these diseases weaken the immune system, and so treatment must include special and monitored diets, which are often unaffordable for the poor. If not adequately treated, these conditions may cause premature deaths and various disabilities, particularly of the vulnerable in the population (Allen et al., Citation2006).
3. State of cereal fortification in Botswana
The 1994 micronutrient survey revealed that maize and sorghum were the most widely consumed commodities at a household level. provides production, trade and consumption statistics for sorghum, maize and millet for 1961 to 2007. While the annual average figure for 2000–07 is a little lower than the estimate for 1990–99, on balance there was an upward trend in consumption during the entire period.
Table 1: Cereal production, trade and consumption in metric tons
Generally, domestic production accounted for only a small proportion of total consumption, implying that the milling industry relied mostly on imports to procure raw materials. Most of the domestic production went into home consumption, rather than the retail market through the milling industry (CSO, Citation2007).
Decomposition of total consumption into the three staples shows that sorghum was consistently the leading commodity consumed, the exception being during 1990–99 when it was surpassed by maize. Millet production, trade and consumption are negligible, implying that sorghum and maize are the key staples to be considered in any food fortification programme in Botswana.
The Government of Botswana currently implements a targeted fortification programme for vulnerable groups using maize and sorghum flour as food vehicles. The programme provides, among other things, enriched soya or sorghum weaning food (tsabana) or enriched pre-cooked (fortified) maize meal to children under five, medically selected pregnant and lactating mothers, tuberculosis patients and community home based care patients. Each of these products provides nutrients such as protein, vitamins (A, B-complex, C and D), iron, calcium and iodine.
Commercial sorghum fortification does not exist in Botswana, which means that the sorghum flour sold to consumers through wholesale or retail outlets is not fortified. However, commercial maize milling by large firms involves voluntary fortification based on South African standards. The NFTRC is currently promoting voluntary fortification of sorghum using the ribbon mixer made by the RIIC and a premix imported from South Africa. The premix contains, among other things, dietary fibre, vitamins A, B1, B2, B3, B6 and B9, and minerals iron, sodium and zinc. While it requires government oversight, voluntary fortification should assume a business-oriented approach and its adoption should depend largely on whether it is technically and economically feasible for existing firms, whose primary motive is profit making. As an alternative to promoting voluntary fortification, industry players are now debating whether the government should impose mandatory fortification of sorghum and maize flour, as is the case for maize and wheat in South Africa.
4. Milling industry structure
4.1 Source of data
This section is based on the authors' survey of mills conducted during November and December 2005. At that time there were 57 registered sorghum, maize and millet mills countrywide, and a decision was made to administer the survey to all of them. However, 16 firms were not covered: seven because they had collapsed, six because they declined the interview, and three because they specialised in service milling only (i.e. processing raw grain for consumers at a fee), leaving 41 firms that participated in the survey. Data analysis on firm structure covered only 40 firms because the largest firm in the sample was much bigger and more technologically complex than the rest, and moreover was already involved in fortification activities on government contract.
The existing two large maize mills were among the firms that declined to respond to the survey. However, their inclusion would not have affected fortification cost analysis as they were already engaged in voluntary fortification based on South African standards. Thus, we would still have excluded these firms in analysing potential fortification costs.
4.2 Firm technology
The cereal milling process is simple, as it involves only de-hulling, milling and packaging, using manually fed systems. shows that most of the 40 firms surveyed owned one or two de-hullers, hammer mills and packaging equipment. The de-hullers and hammer mills used in the industry were supplied by the RIIC and therefore were of standard capacity. The quantity of each type of equipment owned per firm should be an indicator of firm size, assuming firms operate at full capacity. We can, on the basis of the number of each piece of equipment owned per firm, infer that most of the firms in the industry are small.
Table 2: Equipment ownership
Three kinds of millers can be distinguished, on the basis of the kind of milling they do: (1) those who purchase raw grain, and mill, package and sell the flour through wholesalers and retailers; (2) those doing only service milling; and (3) those engaged in both (1) and (2). Of the 40 firms interviewed, 10 belonged to category one and 30 to category three.
4.3 Type, number and size of firms
The 40 firms analysed were categorised according to the type of milling they did. Twenty-eight of them milled only sorghum, six milled both sorghum and millet, three milled sorghum and maize, and three of them milled all three: sorghum, maize and millet. confirms the relative importance of sorghum milling, showing that 38 of the 40 firms ranked it as the leading business activity. This is in contrast to maize milling, which was ranked as the leading activity by only two of the six firms. Of the nine firms engaged in millet milling, none ranked it as a leading enterprise, implying that commercial millet milling is not of major importance.
Table 3: Firm ranking of cereal milling activities
summarises the total monthly output by firm size. Firm sizes were defined as 0 < QS ≤ 20, 20<QM ≤ 100 and QL>100, where QS, QM and QL are monthly outputs (in metric tons) for small, medium and large firms, respectively. Note that the classification ‘small, medium and large’ was adopted only for the purpose of this study since, given their output levels and the technology they employ, all 40 firms in the survey are small in the context of the milling industry of Botswana as a whole. Only the small firms milled maize, collectively producing about 32 metric tons (mt) per month. A negligible amount of millet, about 3 mt per month, was milled, and only by some small firms whose core business is non-millet milling. The monthly outputs of sorghum by small, medium, and large firms collectively were 146, 666 and 873 mt respectively. Thus, most of the sorghum was milled by the seven large firms, followed by the 14 medium firms and finally the 19 small firms. We can conclude that most of the sorghum mills in Botswana are small, whereas maize milling is dominated by a few large firms (which did not participate in the survey).
Table 4: Total monthly output by firm size in metric tons
shows that typical small, medium, and large sorghum milling firms produced a monthly output of 8, 48 and 125 mt respectively. The average monthly outputs for maize and millet again indicate that the firms milling these are small. Sorghum milling is clearly the main activity for millers using manually fed RIIC technology.
Table 5: Minimum, maximum and mean monthly production per firm in metric tons
4.4 Employment levels and firm size
shows total employment levels by business activity. In total, all firms employed 300 people, or eight individuals per firm. The 28 firms that specialised in sorghum milling accounted for a total workforce of 234 people, which also averaged eight people per firm. Mean employment levels for other categories are comparable as they range from five to nine people.
Table 6: Total employment levels by business activity
further analyses employment levels. The 28 firms milling only sorghum were small: 11 of them employed only one to four people. The picture was similar for all firms: 16 of the 38 firms employed only one to four people, and nine employed only five to eight. Thus, about two thirds of the firms had only eight employees or fewer. These results reinforce the earlier findings that a large number of firms involved in the cereal milling industry in Botswana, particularly sorghum milling, are small.
Table 7: Decomposition of employment by range and business activity
5. Identification of fortification costs
We attempted to capture all potential fortification costs associated with the adoption of the NFTRC/RIIC technology at the firm level. While these costs are primarily relevant for sorghum fortification, the same costs would be applicable for maize (or even millet) fortification. We used partial budgeting, looking only at the cost side rather than both the cost and revenue sides. Partial budgeting is used ‘in analysing the relatively small changes in the business such as the purchase of a piece of equipment’ (Boehlje & Eidman, Citation1984:237). Therefore, rather than total milling costs, this study only computes additional costs that would be incurred by existing firms if they adopted the NFTRC/RIIC fortification technology.
Cost computations adopt two scenarios. The first scenario assumes that each firm produces its own diluted premix, while the second assumes that diluted premix production is centralised in the hands of a few large mills, which then sell the required quantities to other mills. Additional expenses include depreciation, interest, premix, electricity, packaging, labelling, and repairs and maintenance.
5.1 Depreciation cost
The RIIC electric ribbon mixer, which has the capacity to hold 150 kg of flour per run, costs P23 000. The RIIC charges P330 to deliver the equipment within a radius of 120 km, where millers are concentrated, and a fixed amount of P833 to train the operator to use it. Total equipment cost at the mill was computed by summing ribbon mixer, delivery and training costs. Each firm, irrespective of its size, would require only one ribbon mixer, as the largest firm in the sample would require 6.85 hours of mixing time per day. Thus, the total cost of the equipment per firm is estimated at P24 163. The RIIC estimated the lifespan of the equipment to be 10 years. We used the straight-line method to compute depreciation.
5.2 Interest charges
Two interest rate scenarios were considered. In the first scenario, we assumed that each firm would acquire a loan from a commercial bank to purchase the ribbon mixer. The prime rate was reported to be 16.5% by seven commercial banks in Gaborone in 2006. The same banks charged additional interest, over the prime rate, ranging from 4 to 16.5%. Thus, total interest rates ranged from 20.5 to 33%. The average of the seven banks was estimated at 26.5%. The second scenario assumed that firms would acquire loans at a subsidised interest rate (5%) from the Citizen Entrepreneurial Development Agency (CEDA), a public support programme (CEDA, n.d.).
5.3 Labour expenses
Introducing fortification would require additional labour as it involves an additional step in the milling process. This labour would be required to operate and monitor the fortification equipment and to add the micronutrient premix to the ribbon mixer. Moreover, where the firm produces its own diluted premix, some further additional labour would be required. A statutory manufacturing sector wage rate of P3.10 per hour was adopted. In addition, we assumed that a month has 25 work days and that a standard day has eight work hours. We further assumed that small, medium, and large firms would require one, two and three additional workers, respectively.
5.4 Cost of premix
According to the NFTRC, a two-step process is required to fortify flour. In the first stage, the diluted premix is formulated by mixing 0.15 kg of premix concentrate with 29.85 kg of unfortified flour. The diluted premix is then packaged into 3 kg bags. Each 3 kg bag of diluted premix therefore contains 0.015 kg of premix concentrate. In the second stage, 3 kg of diluted premix is mixed with 147 kg of unfortified flour to yield 150 kg of the final product. Thus, technically, 0.015 kg of the premix concentrate is mixed with 149.985 kg of unfortified flour. It follows then that the quantity of the premix concentrate required may be computed as: annual quantity of concentrate = 0.015*(annual firm output)/149.985. According to information from the NFTRC, the concentrate is packaged in 25 kg, 100 kg, 250 kg, 500 kg and 1000 kg bags at costs per kg of R342.06, R291.74, R281.42, R276.54 and R274.54 respectively. The concentrate has a shelf life of approximately six months according to the NFTRC, and thus the firms in our survey cannot use quantities larger than 25 kg. Thus, we computed the cost of the premix in pula as: annual cost of premix = (342.06*annual quantity of concentrate)/(rand per pula exchange rate). To arrive at a final figure we added a mark-up of 10%, to account for transport costs from South Africa to Botswana.
Where premix production is centralised, the cost of the diluted premix was approximated using 2006 sorghum flour retail prices for Gaborone and unit fortification cost estimates under decentralised diluted premix production. Retail prices in pula per 5 kg bag increased from P16.46 in January to P18.50 in September 2006 (CSO, various). We therefore assumed that the average price for 2007 was P20 per 5 kg bag, or P12.00 per 3 kg bag. If the diluted premix is produced by a large firm and sold to other firms in the industry, it would cost an additional P0.11/kg (based on the decentralised production results to be discussed later), or P0.33 per 3 kg. Adding fortification cost to the retail price yields P12.33 per 3 kg of diluted premix.
5.5 Electricity expenses
NFTRC trials showed that it takes from 5 to 10 minutes for the ribbon mixer to produce a uniform 150 kg mixture of the fortified product. Assuming that the process takes 10 minutes, then total annual mixing hours = (annual firm output + annual quantity of concentrate)/(6*150). The ribbon mixer has a 5.5 kilowatt motor. The Botswana Power Corporation (BPC) charges P0.35/kW.hr, P0.18/kW.hr and P0.16/kW.hr, respectively, for small, medium and large firms. Therefore, annual electricity expenses in pula = 5.5 kW*(pula/kW.hr)*total annual mixing hours.
Our classification of mills into small, medium and large was not consistent with BPC's classification, which is based on power usage, so we adopted the charge of P0.35/kW.hr for all firms, irrespective of size. For the decentralised diluted premix production, electricity costs were computed separately for the diluted premix preparation and for the final fortified product. For centralised diluted premix production, only the latter was applicable.
5.6 Packaging expenses
Two packaging processes are expected during fortification. In the first stage, the premix is prepared and packaged into 3 kg bags. In the second stage, the premix is mixed with unfortified flour to yield a fortified product, which is then packaged into 10 kg bags and sold to retailers for further resale to final consumers. A leading plastics manufacturer charges P550 for 1000 3 kg bags, or P0.55 per bag. The firm estimated that an opaque bag would cost 40% extra, i.e. P0.77 per 3 kg premix bag. The same firm charges P1.10 for a regular 10 kg sorghum flour packaging bag. An opaque bag would cost 40% extra, i.e. P0.44 per 10 kg bag. For centralised diluted premix production, where the diluted premix is purchased, the 3 kg bag is not required, so its cost is not applicable.
5.7 Labelling expenses
A labelling plate, for stamping nutritional information on the bags, would be required in addition to the current plate used by the firms. The plastics manufacturer quoted P1000.00 for a labelling plate, which can be used to stamp up to 300 000 bags. We computed the labelling cost as: annual labelling cost = (cost of labelling plate/number of bags per stamp)*(annual output)/10. For simplicity a standard quantity of 10 kg is assumed.
5.8 Repairs and maintenance
We assumed that annual repairs and maintenance costs stand at 5% of equipment cost. This is a relatively high figure, which was adopted because the RIIC equipment has not been tried and tested at the industry level, implying that the probability of breakdowns may be high initially. While this is so, reducing the percentage to zero, for example, did not alter the estimated unit fortification costs because repairs and maintenance costs are negligible.
6. Results and implications
6.1 Decentralised diluted premix production
shows key statistics used to compute fortification costs for typical firms. The second column presents the data for an average firm. This is a hypothetical firm producing an output calculated as the average of output of the 40 firms included in the analysis. The third, fourth and fifth columns present summary statistics for average small, medium, and large firms, respectively.
Table 8: Summary statistics for computing fortification costs
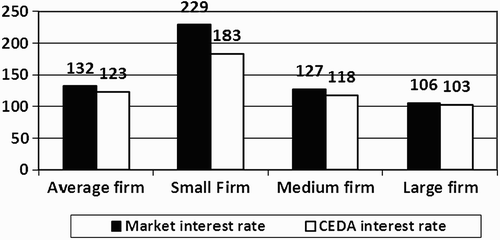
shows fortification costs for ‘typical’ firms, showing additional firm costs for the first year of introducing a fortification programme. The major cost items across firm sizes are labour, packaging and premix. An average firm would incur fortification costs of P132/mt. Similarly, an average small, medium and large firm would incur fortification costs of P229/mt, P127/mt and P107/mt, respectively. As a ratio of the retail price of sorghum, unit fortification costs range from 2.7 to 5.8% (). Under CEDA financing, unit fortification costs for each firm category are reduced (). However, cost reductions are only substantial for a typical small firm, and not for the other size categories.
Table 9: Fortification costs for decentralised diluted premix production in pula (year one)
Figure 1. Fortification costs in pula/mt of flour for decentralised diluted premix production
6.2 Centralised commercial production of premix
Most of the small firms would be unable to produce their own diluted premix. They cannot individually procure the premix concentrate, as it is supplied in a minimum quantity of 25 kg. The shelf life of the premix is only six months, but most of the existing firms would take many months to use up the 25 kg (see ).Therefore, existing firms, particularly small to medium firms, can only participate in a mandatory fortification programme if the diluted premix production is centralised and the diluted premix is sold to them in 3 kg bags. This section therefore examines fortification costs where diluted premix production is centralised.
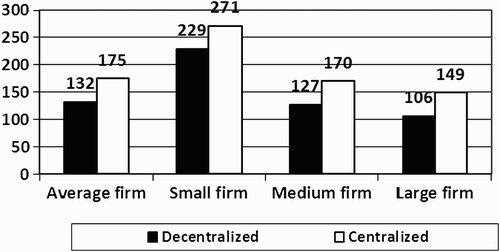
shows the results. The unit fortification cost for an average firm is now estimated at P175/mt, a significant increase from the P132/mt obtained under decentralised premix production. Unit fortification costs for average small, medium and large firms are now estimated at P271/mt, P170/mt and P149/mt, respectively. These translate into 3.7 to 6.8% of the sorghum retail price. compares unit fortification costs for the centralised and decentralised diluted premix production. Centralised premix production is costlier, although it is the more technically feasible option for small to medium firms. These firms can therefore participate in a mandatory fortification programme only if the diluted premix production is centralised. Even some of the large firms may find it difficult to operate under decentralised premix production.
Table 10: Fortification costs for centralised diluted premix production in pula (year one)
Figure 2. Fortification costs in pula/mt of flour for centralised and decentralised diluted premix production
Under CEDA financing, the unit fortification cost for an average firm is estimated at P165/mt. For average small, medium and large firms, unit costs are, respectively, estimated at P226/mt, P161/mt and P146/mt. As for decentralised diluted premix production, CEDA financing would cut fortification costs substantially for small firms (from P271/mt to P226/mt). However, such financing would not be adequate to ensure that these firms are sustained once a mandatory fortification programme is introduced.
6.3 Comparison of Botswana's unit costs with other developing countries
compares fortification costs in Botswana with those for Bangladesh, Guatemala, Central America, China, the Philippines and Zambia. For Bangladesh and Guatemala wheat flour fortification programmes, the nutrients added to the flour included thiamine, riboflavin, niacin, folic acid, iron, zinc, vitamin A and vitamin B12 (Dary, Citation2002; Dary & Rassas, Citation2004). Unit costs were strikingly different, with the Bangladesh programme costing US$7.00/mt (Dary & Rassas, Citation2004), compared to only US$0.73/mt for Guatemala (Bishai & Nalubola, Citation2002). Such a discrepancy cannot be explained from the existing information. The Central American programme, which involves sugar fortification with vitamin A, costs US$9.08/mt (Bishai & Nalubola, Citation2002). Fortification programmes in China and the Philippines used rice as a food vehicle. The premix used in China contains vitamin B1, niacin, folic acid, iron, zinc and pyrophosphate, while that for the Philippines contains only iron. The cost estimate was US$19.10/mt for China, compared to US$10.95/mt for the Philippines (Alavi et al., Citation2008). The Zambian programme involves maize fortification with vitamins A, B1, B3, B2, B6 and B9, and iron and zinc, and it costs US$15/mt (Philar & Johnson, Citation2005).
Figure 3. Unit fortification costs for selected developing countries
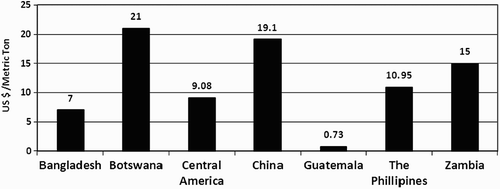
In sum, the unit fortification cost for Botswana is much higher than those for the other countries, except for that for China, which is only slightly lower than the Botswana estimate (). Botswana's average fortification costs are also higher when expressed as a ratio of the sorghum retail price. They range from 3.3 to 4.4% ( and ), which is higher than the estimates for Bangladesh (2.3%), Guatemala (<0.5%), the Philippines (1.8 to 2.6%) and Zambia (1.25 to 2%), but comparable to that for China (3.4 to 4.5%).
6.4 Implications for mandatory fortification of sorghum and maize
The findings of this study suggest a number of implications for the feasibility of mandatory fortification of maize and sorghum flour in Botswana. First, if mandatory fortification is implemented, the additional equipment recommended should be suitable for small firms. The technology should be simple, inexpensive and thus affordable, to enhance adoption by existing firms, which are predominantly small. If not, and a mandatory fortification programme is launched, most of the existing firms would collapse, and would be replaced by a few large firms with the capacity to operate more efficiently with sophisticated and expensive technology.
Second, since some sorghum milling firms also engage in service milling (Rohrbach et al., Citation2000), mandatory fortification would be difficult, if not impossible, to implement comprehensively. This situation would be compounded by the fact that most of the domestic output of cereals does not reach the formal food chain (it goes into home consumption), as the majority of primary producers are subsistence farmers and do not participate in the commercial grain market (CSO, 2007).
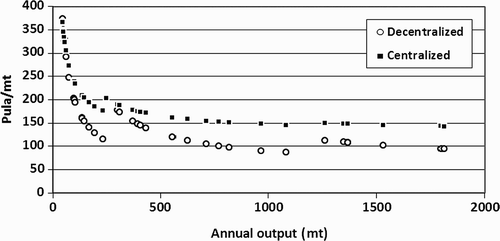
indicates the unit fortification costs for 37 of the 40 firms included in the analysis. Three firms which were excluded to improve graph readability had unit costs exceeding P1000/mt. These firms cannot participate in a mandatory fortification programme, and would have to exit the industry. Unit costs for the remaining 37 firms ranged from P87/mt to P374/mt (). It appears that those firms producing less than 500 mt of flour per year would generally experience difficulties if mandatory fortification was introduced. While some small firms would experience lower fortification costs for decentralised premix production (), this scenario would be technically infeasible for such firms, as discussed earlier. Hence, decentralised premix production would be unlikely to be applicable for firms producing less than 500 mt per year. This implies that 26 of the 40 firms in the study sample, more than half, would probably collapse in the advent of a mandatory fortification programme.
Figure 4. Unit fortification costs for individual firms in the industry
In the light of the foregoing, the most logical strategy would be for existing firms to consider merging and consolidating, if a mandatory fortification programme is introduced. Since such action could involve huge industry restructuring, a public programme to support the firms may be required.
Firms may also face cash flow problems once a mandatory fortification programme is introduced. Additional annual operating costs range from P24 000 to P221 000. Some of the firms may therefore face problems if they cannot access operating capital, since they may not have adequate equity to implement the programme. Thus, whether or not a mandatory fortification programme would be feasible depends not only on unit fortification costs but also on the effect of the programme on the cash flow position of existing firms.
The foregoing conclusions notwithstanding, some of the fortification costs would be passed on to consumers through increased retail prices. The extent to which this would occur depends on market supply and demand conditions. Introducing mandatory fortification would shift the short-run costs of individual firms upwards, leading to a decrease in market supply and an increase in the retail price of the final product, thus passing on some of the fortification costs to the consumers. If, in addition to this, the consumers perceive the fortified product to be of better quality than the unfortified one, the market demand for this product would increase, reinforcing the original market price increase due to the supply shift. However, the extent to which this would occur appears limited, since mandatory fortification is often a result of government policy rather than industry response to changes in consumer tastes and preferences.
7. Conclusions
As in many developing countries, malnutrition is a problem in Botswana. One of the interventions for addressing malnutrition is food fortification, using foods commonly consumed by the poor as vehicles. In Botswana, maize and sorghum flour are potential food vehicles as they are the main staple commodities for the poor.
For sorghum (and maize produced by small-scale millers), no commercial fortification activities are in place. However, the NFTRC is currently promoting voluntary fortification using the RIIC equipment and the imported premix concentrate. Cost analysis of this technology indicates that unit fortification costs are higher than those generally obtained for the developing countries for which data are available. Even as a percentage of the retail price of sorghum, costs in Botswana are higher than the general trends in developing countries. Thus, this study argues that the launching of a mandatory fortification programme would lead to the collapse of small to medium firms, which do not have the necessary scale to absorb fortification costs.
Moreover, if a mandatory fortification programme is introduced, the cash flow position of most of the existing companies would be highly compromised if they cannot access operating capital. It is further noted that a realistic option for small firms would be to consolidate so as to increase the scale of operation and avoid absolute collapse. However, public funding would be required to support such consolidation.
Acknowledgements
The research project leading to this publication was made possible through financial support from the United States Agency for International Development and ComMark Trust International. Their assistance is highly appreciated.
References
- Alavi , S , Bugusu , B , Cramer , G , Dary , O , Lee , T , Martin , L , McEntire , J and Wailes , E . 2008 . Rice Fortification in Developing Countries: A Critical Review of the Technical and Economic Feasibility . United States Agency for International Development, Washington, DC
- Allen , L , De Benoist , B , Dary , O and Hurrell , R . 2006 . Guidelines on Food Fortification with Micronutrients . FAO (Food and Agriculture Organisation), Rome
- Belbase , K , Khulumani , P , Maruapula , S , Mphathiwa , M and Phegelo , M . 1996 . Report on Micronutrient Malnutrition in Botswana: A National Survey to Assess the Status of Iodine, Iron and Vitamin A . UNICEF (United Nations Children's Fund), Gaborone
- Bishai , D and Nalubola , R . 2002 . The history of food fortification in the United States: Its relevance for current fortification efforts in developing countries . Economic Development and Cultural Change , 51 ( 1 ) : 37 – 53 .
- BoB (Bank of Botswana) . 2010 . Botswana Financial Statistics . Bank of Botswana, Gaborone
- Boehlje , M D and Eidman , VR . 1984 . Farm Management . John Wiley & Sons, New York
- CEDA (Citizen Entrepreneurial Development Agency) . n.d . CEDA Guidelines. Government Printer, Gaborone
- CSO (Central Statistics Office) . 2007 . 2004 Botswana Agricultural Census Report . Government Printer, Gaborone
- CSO (Central Statistics Office) . various. Consumer Price Statistics. Government Printer, Gaborone
- Dary , O . 2002 . Lessons learned with iron fortification in Central America . Nutrition Reviews , 60 ( 7 ) : S30 – S33 .
- Dary , O and Rassas , B . 2004 . Elements of a National Food-fortification Program in Bangladesh. MOST . USAID Micronutrient Program, Arlington
- FAO (Food and Agriculture Organisation) . 2010 . FAOSTAT . http://faostat.fao.org/ Accessed 2 March 2010
- Haas , J H and Miller , DD . 2006 . Overview of experimental biology 2005 symposium: Food fortification in developing countries . Journal of Nutrition , 136 ( 4 ) : 1053 – 4 .
- MoH (Ministry of Health) . 2005a . Botswana National Nutrition Surveillance System: June 2005 . Ministry of Health, Gaborone
- MoH (Ministry of Health) . 2005b . National Plan of Action for Nutrition (2005–2010) . Government Printer, Gaborone
- MOST (USAID Micronutrient Program) . 2000 . Fortification of Staple Foods in Developing Countries . MOST, Arlington. www.mostproject.org/fort.htm Accessed 10 June 2008
- Philar , R and Johnson , Q . 2005 . Small Scale Mill Fortification Manual . The Micronutrient Initiative, Ottawa
- Rohrbach , D , Mupanda , K and Seleka , T . 2000 . Commercialisation of Sorghum Milling in Botswana: Trends and Prospects . International Crops Research for the Semi-arid Tropics, Bulawayo
- Rosenberg , I H . 2007 . Further evidence that food fortification improves micronutrient status . British Journal of Nutrition , 97 ( 6 ) : 1051 – 2 .
- WHO (World Health Organisation) . 1996 . Indicators for Assessing Vitamin A Deficiency and their Application in Monitoring and Evaluating Intervention Programmes . WHO, Geneva