Abstract
Despite attempts to induce strong competitiveness in African manufacturing firms, poor productivity performances continue to hinder their ability to operate successfully in international markets. This paper argues that, while many plausible explanations can be put forward for this failing, analysis of the firms' social and institutional contexts can provide useful insights into why they have continued to perform badly. Adopting the technological catch-up framework proposed by Abramovitz Citation(1986), the paper uses the case of Lesotho garment producers to illustrate how an environment characterised by significant social capability deficits has a negative impact on local firms' competitiveness. Strategic interventions to improve the quality of infrastructural services deliveries are suggested as urgently needed remedial measures.
1. Introduction
From the mainstream analytical perspective, productivity improvement in developing countries can be explained by the logic of technological externality that allows national agents to adopt what constitutes international best practice. According to Nobel Prize winner Robert Solow's early neoclassical growth models (Solow, Citation1956, Citation1957), the technological progress that drives long-run productivity growth is basically a ‘free’ good that everyone can use. Though this idea was first used for analysing growth in a single country, subsequent researchers have applied it to cross-country studies by arguing that productivity-improving technological or knowledge externality is international in character.
Mainstream theory views the knowledge factor simplistically as exogenously driven. Other approaches, on the other hand, such as the ‘new growth theory’ and the ‘technological gap’ models, endogenise technology. Of relevance to the present paper is a strand of the latter category of arguments that successful international diffusion of technology, and by implication productivity improvement, in a developing economy depends on the adequacy of beneficiaries' social capability (Abramovitz, Citation1986). It follows then that a society with significant social capability deficits has no more than a weak potential for moving up the productivity ladder through successful adoption of international best practice in technology.
The concept of ‘social capability’ emerged in the context of the debate on economic growth and convergence. It is therefore understandable that the social capability argument has largely been confined to cross-country comparisons of growth performance. Very little has been done to explore its implications for firm-level performance in developing countries. For example, much of the research on manufacturing firms in Africa argues that their productivity is essentially influenced by factors within the control of the organisation, such as size, human capital and export orientation (see Lundvall & Battese, Citation2000; Mengistae & Pattillo, Citation2004; Soderbom & Teal, Citation2004, for some instances). While the findings of these investigations have undoubtedly yielded useful insights, it is important that the debate be informed through the lens of any different but potentially revealing analytical paradigm. Because the theory of social capability addresses issues outside the control of the organisation, this paper uses its insights to explain the productivity behaviour of African firms.
To do this the paper specifies and estimates Cobb-Douglas stochastic production frontier models for a cross-sectional sample of Lesotho garment firms. Particular contributions of this study are the theoretical framework, which is a departure from past approaches, and the focus on Lesotho's experience, which has not been previously reflected in the existing body of African evidence. The results to some extent support the hypothesis that significant deficiencies in national social capability inhibit the propensity of firms to behave efficiently. For instance, the proxy for inadequate physical infrastructural services to support businesses is found to be positively and significantly associated with the inefficiency scores of our sampled firms. A further finding is that the weak national infrastructure of financial intermediation, which constrains business access to credit, translates into inefficient performance on the part of these firms.
The following section describes recent performances of African garment firms and explains how they relate to the productivity issue. Section 3 discusses the concept of social capability and relates it to the socioeconomic conditions faced by African firms, Section 4 describes the context of the study, Section 5 presents the empirical methodology, Section 6 discusses the results, and Section 7 concludes and makes policy recommendations.
2. Recent performances of African garment firms and the productivity issue
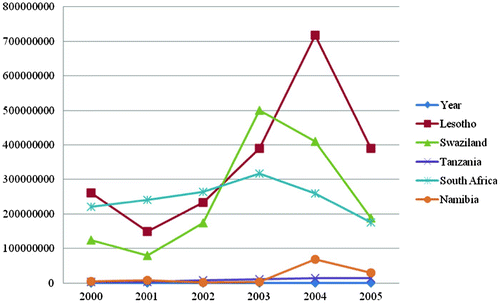
The Agreement on Textile and Clothing (ATC), which effectively lifted quota restrictions previously applied by some developed countries to their textile and clothing imports from developing countries, expired in December 2004. This exposed in no small measure the fragility of African competitiveness in the global garment market (Kaplinsky & Morris, Citation2006). Apparently anticipating stiffer competition from producers in supposedly more efficient economies like India and China, many African garment manufacturers and exporters opted for the exit route to prevent possible losses (see Bennett, Citation2006). shows the trend in export performances of some countries where the ATC quota removal apparently had immediate and significant impact.Footnote1 It is clear from the figure that the rising values of these countries' garment exports from 2001 could not be sustained beyond 2004, when the ATC ended.
Figure 1: Garment exports from selected sub-Saharan African countries to rest of the world (2000–05) (US$)
One might ask why productivity performance should be an issue of concern in relation to the export crisis just described. Firstly, it must be noted that many of these African countries became significant exporters of garment as a result of tariff concessions they enjoyed under the African Growth & Opportunity Act (AGOA) preferential trade scheme (Shapouri & Trueblood, Citation2003). A major aim of preferential trade schemes like AGOA is to create market access opportunity for producers who might otherwise be unable to access international markets because of relatively high production costs at home (Prebisch, Citation1964). By removing or substantially reducing the tariffs they pay on their exports, a preferential trade scheme confers a competitive cost advantage on beneficiaries and makes access to large external markets possible. Access to large markets in turn allows producers to reap the benefits of economies of scale (Hoekman & Ozden, Citation2005). A successful internalisation of scale economies is expected to improve productivity performances and assure sustained international competitiveness on the part of beneficiary producers.
Secondly, before it expired the ATC enhanced the value of these AGOA preferences by placing quota restrictions on the export of third country competitors' products to the same market. Therefore, if its expiry and its erosive effect on AGOA benefits are observed to be causing problems in the export market for beneficiaries, then the issue of how their productivity has responded to preferential treatment becomes a matter for serious concern. This concern was the motivation for this research.
3. The social capability hypothesis in the context of African socioeconomic conditions
In a simple but elegant demonstration of the potential for catch-up by developing countries, Skonhoft Citation(1995) performs a growth accounting exercise to illustrate the importance of Abramovitz's social capability argument. Signalling a major departure from the mainstream neoclassical tradition, he works out the catch-up arithmetic in terms of three main deterministic elements: the technology gap, research and development (R&D) and social capability. He demonstrates that the prospects for closing the time lag of operating best practice technology and hence catching up in efficiency terms with the leader are bright not only when a country faces a large or modest technology gap but also when it has a heavy investment in R&D together with well-developed social capability for exploiting new technology. Although Skonhoft does not supply much detail about what constitutes social capability, one can get a clearer idea of the concept from other contributors to the literature. The following definitions of ‘social capability’ offer some useful insights:
| • | A nation's attitude to managing its resources in order to contribute to overall economic growth (Baussola, Citation1997). | ||||
| • | The institutional factors such as educational systems (which supply the human capital necessary for assimilating spillovers), the banking system (which supplies financial capital for catch-up related investment), the political system, etc. (Verspagen, Citation1999). | ||||
| • | The attributes and qualities of people and organisations that influence the responses of people to economic opportunity which originate in social and political institutions (Abramovitz & David, Citation1996). | ||||
| • | The array of factors, including levels of human capital, economic infrastructure, and institutional capacities, that affect the country's ability to adopt available technology and promote economic efficiency (Taylor, Citation2005). | ||||
Advocates of the social capability argument suggest that these variables should be present in some satisfactory form before local agents can successfully exploit the kind of advanced technology that obtains in developed countries. If they are present, then a developing country can learn, adopt, imitate or copy the latest production techniques of developed countries and in the process close the technology or efficiency gap between the two. But if they are not, it will be difficult for the country to internalise advanced knowledge and improve its efficiency.
This may especially be the case for many African producers who face significant social and institutional barriers to doing business. Africa lags behind the rest of the world in both quality and quantity of the institutions and socioeconomic factors that drive productivity and enhance regional competitiveness.
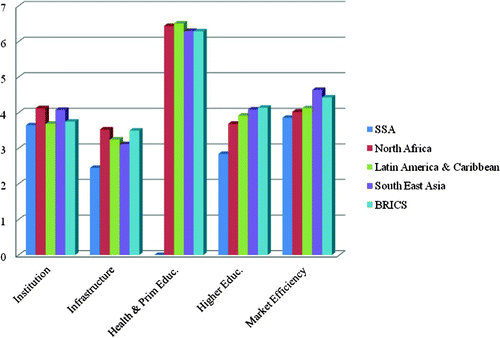
compares the competitiveness of sub-Saharan Africa with a number of other developing countries such as North Africa, South East Asia, Latin America and the Caribbean, and the BRICS group of rapidly developing large countries, Brazil, Russia, India, China and South Africa. As the figure shows, these developing countries outperform sub-Saharan Africa in all the five critical drivers of productivity identified by the Global Competitiveness Index: institution, infrastructure, primary education, higher education and market efficiency (financial, goods and labour).
Figure 2: Global Competitiveness Index 2007
Many experts agree that institutional development in sub-Saharan Africa is poor by international standards (Azam et al., Citation2002). Although there is still debate about the reasons for this, there appears to be broad consensus that it is one of the main factors responsible for the region's underdevelopment (Collier & Gunning, Citation1999; Azam et al., Citation2002). North Citation(1990) is informative about the role of institutions in economic performance. Efficient institutions reduce transaction costs and make it possible to capture the gains from trade that are needed to make investments more profitable. On the other hand, inefficient institutions create uncertainty and increase the transaction costs of investment and consequently reduce its attractiveness. Manufacturers facing institutionally induced high costs of transacting business will have little to show in terms of productivity. This can be stated as the following empirically verifiable hypothesis:
Hypothesis 1: Resident African manufacturers' technical inefficiency is positively associated with measures of institutional weaknesses.
Efficient infrastructure is important for the business of manufacturing. Power supply is virtually indispensable to modern day production, transport is needed for intermediate and finished goods, and businesses can hardly survive without good communication and sufficient water supplies. Firms operating where the infrastructure is poor may have to spend more on overheads, since they may have to acquire their own generators or resort to alternative but less efficient transport and communication methods. The consequences for performance and operational efficiency in African firms can be stated as the following hypothesis:
Hypothesis 2: Resident African manufacturers' technical inefficiency is positively associated with measures of poor public infrastructure.
The importance of education to economic growth is already well recognised in economics (see Easterlin, Citation1981). Well-educated workers are able to adopt modern production technology efficiently, while the ill-educated will inevitably find it difficult. This can be stated as a third hypothesis:
Hypothesis 3: Resident African manufacturers' technical inefficiency is positively associated with measures of poor skill level of the workforce.
A financial environment like this will achieve very little in terms of efficient mobilisation of savings from the surplus units to the deficit units. As early as Schumpeter Citation(1934) the foundation had been laid for the argument that efficient financial intermediation is important for economic growth. A well-developed and vibrant system of financial intermediation helps increase growth by channelling savings to highly risky but equally rewarding productive activities. A repressed financial system, on the other hand, has negative consequences for domestic productivity because it raises the cost of capital for investors in two main ways. First, because of the repression, the internal cost of funding will be higher than its market determined efficient equilibrium value as many potential demands will be left unsatisfied by the inefficient internal facilities. Second, since some of these finance-constrained investors may now be forced to resort to external sources, the cost of transaction and consequently overall cost of funding will increase. The association between the high cost of capital and the efficiency of operations can be stated as a fourth and final hypothesis:
Hypothesis 4: Resident African manufacturers' technical inefficiency is positively associated with economy-wide financial repression.
4. Productivity behaviour in African manufacturing firms
There has been noticeable research interest in the issue of manufacturing inefficiency in Africa. Explanations as to why productivity falls below its potential have included size, export orientation, human capital, trade policy regimes and other variables.
Size has been found to be positively associated with the productive performance of firms in Kenya (Lundvall & Battese, Citation2000) and Côte d'Ivoire (Chapelle & Plane, Citation2005). Another analytical model postulates that an export oriented strategy improves efficiency (Krugman, Citation1987; Grossman & Helpman, Citation1991). This was tested and confirmed at firm level for three sub-Saharan African countries (Mengistae & Pattillo, Citation2004). Soderbom & Teal Citation(2004) investigated the effect of human capital on performance and found that observable skills are not quantitatively important as determinants of productivity among manufacturing firms in Ghana. Tybout Citation(2000) and Chete & Adenikinju Citation(2002) present evidence that trade liberalisation has a positive impact on industrial productivity. While all these competing explanations offer interesting insights, studies that focus on institutional variables represent a kind of analytical departure that is similar in spirit to the social capability argument.
Theoretical models of institutional failures and firm performance such as that advanced by Hall & Jones Citation(1999) argue that the observable differences in cross-country levels of output per worker can be explained by differences in the quality of social infrastructure. McArthur & Teal Citation(2002) tested this hypothesis for a cross-section of 27 African countries. In their empirical model, corruption is used as a proxy for social infrastructure and their estimation finds significant evidence of negative correlation with performance. In similar vein, Chapelle & Plane Citation(2005) studied the efficiency behaviour of firms in Côte d'Ivoire using various indicators of institutional profile as explanatory variables and found affirmative evidence that the presence of trade unionism is positively associated with technical inefficiency.
Like the above studies, the present study acknowledges the social capability argument's emphasis on these elements of the social and institutional environment. It differs, however, in its analytical approach (which allows for better analysis and modelling of the social capability elements) and in the subject matter of its empirical case study.
5. Methodology
5.1 Modelling technique
Following the seminal work of Farrell Citation(1957), analysis of technical efficiency has attracted significant attention from researchers and policy makers alike. Several approaches to measuring efficiency have been developed, the two principal ones being data envelopment analysis (DEA) and stochastic frontiers. The DEA approach is a non-parametric form of analysis that relies on a linear programming technique to estimate production function. It is mainly attractive because it requires neither parametric assumptions nor assumptions about the functional relationship between input and output. However, because of its deterministic nature all deviations from the frontier are taken to reflect inefficiencies. This means that the computed inefficiency scores may be sensitive to measurement errors or other statistical noise that may be present. Its usefulness especially with respect to survey data is therefore limited (Soderbom & Teal, Citation2004).
The stochastic frontier approach proposed independently by Aigner et al. Citation(1977) and Meeusen & Van den Broeck Citation(1977) was used in this study because it is able to overcome these problems. Its framework is built around the assumption that firm-level efficiencies are affected by both random and inefficiency factors. While the random component expresses the influences on productivity of factors that are outside the firm's control, the inefficiency component expresses deviations from frontiers that are attributable to influences from firm-specific factors. A typical formulation of its model will present a production function augmented in an econometric design fashion by an error term that is composed of two elements. The first component captures the random effect while the second accounts for the unobservable inefficiency. This basic specification has been altered and extended in a number of ways to take account of different situations. In this study Battese & Coelli's (1995) approach was used to model the influences of environmental variables on technical efficiency scores and the development of the model proceeds as follows.
Assume the following expresses the relationship between output and input for a given firm:
The estimation of equation Equation(3) above can be carried out by specifying a production frontier of an appropriate functional form.
Recognising that certain factors may operate at the level of the firm to hinder efficient operation is of little practical policy significance if we cannot identify the actual mechanism of this relationship. In other words, from a policy perspective it is important that we reveal the way an organisation's efficiency performance responds to variations in these firm-specific variables.
Fortunately, a model of the inefficiency effect can be developed to address this issue. There are a number of different approaches in the literature on stochastic frontier analysis. Earlier empirical works use a two-stage estimation procedure to identify the various reasons for differences in the predicted efficiency of firms in the same industry. In the first stage, stochastic frontier estimates are derived and in the second stage the predicted efficiencies are regressed on firm-level explanatory variables of interest. There has been much criticism of this approach. It is argued for instance that the firm-level characteristics may be correlated with the structure of the production frontier so that the two-stage procedure will yield inefficient estimates (Reifschneider & Stevenson, Citation1991; Battese & Coelli, Citation1995). To overcome this problem, a single-stage estimation technique has been suggested. Among the various approaches that have emerged in response is the one proposed by Battese & Coelli Citation(1995). Its argument can be expressed in the combined form of equations Equation(1) and Equation(2)
above by modelling the mean of u
i
as a function of a host of firm-specific explanatory variables thus:
Various hypotheses can be tested to verify the validity of the model's assumptions. For instance, the test to check that technical inefficiencies are not present in the model can be conducted under the null hypothesis given by H 0: γ = 0 with the γ parameter defined as γ = σ2 u / (σ2 v + σ2 u). If we fail to reject this hypothesis then the model approximates to the deterministic or average response function, which can be effectively estimated using the ordinary least squares technique.
Another hypothesis, that the inefficiency effects are not influenced by changes in the explanatory variables included can be tested with the null specified as H 0: δ1 = δ2 = δ3 = … … … δ n = 0. The test with respect to the appropriateness of the functional specification can also be carried out, for instance to ascertain whether a Cobb-Douglas specification with constant returns to scale is preferable to, say, a Translog form with variable elasticity of factor input.
All these hypotheses can be tested by using the generalised likelihood ratio test with test statistics given by:
This statistic is asymptotically distributed as a chi-square with degrees of freedom equal to the difference between parameters of the hierarchically nested models. Critical values for the test are obtainable from the appropriate chi-square distribution table.
5.2 Data and variables
From the database supplied by the Lesotho Bureau of Statistics, 29 garment producing firms provided information on their operational performance for 2004 (LBOS, Citation2006). These data made it possible to obtain information on key variables of interest to the research. However, since some data were missing and information on some important variables (especially social capability deficit variables) could not be extracted from this source, a fieldwork survey was conducted between April and October 2006 to gather such other data as might be needed. A research questionnaire was administered to establishment officials, and other secondary sources were consulted. Of the 29 questionnaires administered, just over half (17) were finally used in the analysis. This response figure also approximates to roughly half of the 38 garment firms that the LNDC (Lesotho National Development Corporation) reported were in existence and the World Bank reckoned accounted for the bulk of the country's garment manufacturing sector.
5.2.1 Production technology variables
In the production function whose descriptive statistics are given in the dependent variable is proxied by a firm's gross output for the year 2004. While gross value added rather than gross output is often the preferred choice of many empiricists, the available data did not offer us this option.
Table 1: Summary of production technology attributes of sampled garment firms, 2004
Table 2: Summary statistics of main social capability deficit variables introduced in inefficiency model
Three input variables, labour (l), capital (k), and energy (engy) were introduced. Consistent with approaches used in previous attempts, the three explanatory variables which were expected to be positively related to output were calculated as follows: labour input is measured as the total number of employees, capital is defined as gross fixed assets, and energy input is captured by the total cost incurred for electricity, fuel and related items. All values are reported in the local currency (loti).
5.2.2 Social capability deficit variables
Five measures were introduced to proxy for this deficiency in accordance with the hypotheses specified earlier: poor public infrastructural services deliveries (infr), skills shortages (skl), poor access to institutional credit (crdt), bureaucratic impediments (brc), and official corruption (crp). The last two variables are alternative measures of weaknesses in regulatory capacity (institutional weakness). provides summary statistics for these variables, while their histograms, which also contain information on how they were captured, are given in Appendix A.
5.3 Model specification
Because of its widespread popularity among previous researchers of similar empirical disposition the Cobb-Douglas production framework was adopted for this study. With respect to industrial data especially, this restricted form of Translog specification has more often than not been adopted in practice (Desai, Citation1976). Thus the estimated Cobb-Douglas stochastic frontier production function for our sample of Lesotho garment firms is assumed to be defined as:
Where
Infr i captures the likely impact of poor public infrastructural services on the i-th firm's performances, skl i defines the level of education of the i-th firm's employees and its potential influence on productivity, and crdt i stands for the possible impact that poor access to credit has on the i-th firm's operations. Finally, both brc i and crp i represent our different measures for the influences on performances of the i-th firm of institutionally related bureaucratic impediments and corruption respectively.
Two other reality checks were further conducted to verify the validity of our empirical approach. The first was to ascertain whether or not the stochastic frontier model was really a better representation of the data than the average response function with no technical inefficiency, and the second was to investigate the effects of all the explanatory variables in the inefficiency model to establish their significance as possible sources of technical inefficiencies. Both checks and the hypotheses deriving from them were tested using the generalised likelihood ratio tests suggested earlier. The results, together with the maximum likelihood estimates for the parameters of the Cobb-Douglas stochastic frontier production function with embedded inefficiency effect factors, are presented in the following section. All the models were estimated with the aid of the computer software package ‘Frontier 4.1’ (Coelli, Citation1996).
6. Results and analyses
By and large, the most significant problem with our estimation was the low degree of freedom arising from few observations. In addition, capital and labour are not exogenous to total factor productivity, suggesting possible biases in our estimates. Furthermore, if our fear that firms' responses to inquiries on social capability issues could be endogenous turns out to be justified, another dimension is introduced into the problems associated with estimations. Given that the nature of our data did not allow us to deal with these issues in some acceptable ways, we lay claim only to a suggestive relationship between social capability deficits and firm productivity, not to any robustness in the findings. With this caveat in mind we proceed to discuss the results.
In , the values of the generalised likelihood ratio statistics that were obtained using the restricted and the full model are reported in the first column and their respective critical values in the second. Given our null hypothesis that all firms operate on their efficiency frontier, i.e. with no technical inefficiency, it can be seen from the table that this hypothesis is easily rejected in favour of the alternative assumption that inefficiency is a defining attribute of production. The generalised one-sided LR statistics were significant at the 5% level. The value of the estimated γ-parameter reported in also lent strong support to this conclusion. With a significance value at 5% level, the γ-estimate revealed that about 52% of total variability was associated with inefficiency of production. A deterministic model that assumed that production behaviour was fully efficient could not therefore serve our purpose as well as a frontier specification could.
Table 3: Generalised likelihood ratio tests of hypotheses for parameters of the stochastic frontier production function
Table 4: Maximum likelihood estimates for parameters of Cobb-Douglas Stochastic Frontier Production Function with embedded inefficiency model for Lesotho garment firms
Similarly, the second row of the table provides evidence against the null hypothesis that the coefficients of all explanatory variables in the inefficiency model were simultaneously equal to zero. Therefore, it can rightly be argued that all our speculated causes of inefficiency were collectively significant in explaining the variation in efficiency among the sampled firms.
Table 4 shows the maximum likelihood estimates of the parameters of production factors and the inefficiency effect variables. All the three input factors not only displayed the expected positive signs but were also statistically significantly related to output. The higher value of labour elasticity relative to other inputs should be expected given that clothing firms use labour intensive production technology.
The lower half of the table models inefficiency as a function of a number of explanatory variables. It is instructive to note that the mean technical efficiency figure is about 53%. This implies that garment firms in Lesotho were operating well below their technically feasible capacity during the study period. According to the value of our estimated y-parameter, these inefficiency effects were significantly attributable to the impact that environmental variables exerted on firms' ability to behave efficiently. Of the five proxies for different manifestations of social capability deficits that were fitted, only two displayed the expected signs in statistically significant ways.
As the table shows, the coefficient on infrastructural obstacles (δ1) is positive and statistically significantly associated with technical inefficiency, suggesting that there were productivity losses as a result of poor delivery of public infrastructural services. This result serves to confirm the earlier hypothesised relationship, and a similar finding was reported in a previous study. A 2002 study of the garment sub-sector commissioned by the Government of Lesotho revealed that inadequate water supply and poor deliveries in some other public infrastructural service areas constituted some of the most serious challenges to the continued growth of the country's garment sub-sector (Salm et al., Citation2002).
Further evidence that an inefficient social and institutional environment has a negative impact on manufacturing firms' productivity is provided by the value of the estimated coefficients on access to credit (δ3). The fact that this figure is negative and statistically significant shows that lack of easy access to credit was a key contributor to firms' technical inefficiency. In other words, better access to credit would have helped reduce the sampled firms' operational inefficiency. On the basis of this evidence there is some support for our earlier argument that Lesotho garment firms' productivity suffers from the economy's weak financial intermediation. This argument is again consistent with the findings of a recent World Bank Investment Climate Assessment exercise, which cited lack of access to capital as one of the major obstacles to doing business in Lesotho (World Bank, Citation2005).
Seemingly inconsistent, however, with Hypothesis 3 above and the social capability argument is the finding that the proxy for employees' skill level (δ2) had a statistically significant positive sign. Given the way the variable was captured (see Appendix A), this means that a higher skill level as measured by the level of employees' education was positively associated with declining productivity (inefficiency). Obviously, this is a surprise finding as theoretical arguments support the notion that better trained workers are more productive and an inverse relationship between inefficiency and level of education is a more plausible outcome. But in the context of our research, the failure to observe a negative relationship between skill level and inefficiency may be rationalised on the grounds that garment production is essentially a labour intensive activity and there is a threshold beyond which higher skills will no longer improve efficiency. A somewhat similar argument can be made with respect to the observed positive association between skills and inefficiency. It may also be reasonable to suspect that firms with a more highly skilled workforce built up excessive wage bills that were not compensated for by commensurate efficiency gains. The consequence would thus be that such unproductive expenditure would have a positive effect on the firm's technical inefficiency.
Finally, although both bureaucratic bottleneck (δ4) and corruption (δ5) variables showed the anticipated positive signs it is difficult to accept any suggestion implied by Hypothesis 1 that these institutional variants of social capability deficits have any explanatory power for operational efficiency, since their associated t-statistics were not significant at any conventional level of test.
7. Conclusions and recommendations
Against the backdrop of declining export performances, this paper addresses the issue of the productivity behaviour of manufacturing firms in Africa with particular emphasis on the experience of Lesotho garment producers. The major contribution of the study is that it was analytically inspired by Abramovitz's social capability argument and empirically situated in the context of Lesotho garment manufacturing. These two attributes represent important contributions to the literature on the productivity performance of African firms.
The paper argued that some manifestations of social capability inadequacy, such as poor physical infrastructure, a weak financial system and corruption exert a negative influence on the productivity performance of the sampled firms. The stochastic frontier model was the preferred choice of method for investigating the validity of all hypothesised relationships because it is able to overcome many of the empirical and statistical shortcomings of some other techniques. The main findings from the model affirm the general view that there is a negative association between social capability deficit variables and firm efficiency. Specifically, inefficient public infrastructure is found to be positively associated with technical inefficiency at firm level. The study also showed empirically that poor access to credit as imposed by the weak national system of financial intermediation translates into inefficient performance at firm level. However, given that this analysis suffered from some data-related methodological problems, it is suggested that further research using more sophisticated data will be required to overcome the limitations of the exercise.
Finally, the policy implications of our findings deserve mentioning here. Competitiveness in the international market is an outcome that requires strategic intervention from all relevant angles. While market access opportunities like those granted by trade preferences can help, they are not sufficient unless the relative cost of doing business in beneficiary locations compares reasonably well with what obtains in the least possible cost location elsewhere. Particularly worth emphasising is this study's finding that factors beyond the control of the organisation are quite important. Lesotho government officials need to do more to improve in key infrastructural areas such as the electricity, transport and water supply services. Current problems of frequent power outages and insufficient water supply and the associated high costs must be resolved. Furthermore, interventions are needed to make the financial system more efficient in channelling savings to more productive uses. The present situation where manufacturers have poor access to bank lending is undesirable. To this end, the development finance institutions can be made more responsive to the needs of manufacturers. Putting these measures into action now will go a long way towards enhancing Lesotho garment firms' productivity.
Notes
1While we are mindful of the fact that other factors may have played a role in the drop in these countries' export performances, evidence that the ATC quota removal played a key role can be found in some reports (see for instance Kaplinsky & Morris, Citation2006).
References
- Abramovitz , M . 1986 . Catching up, forging ahead and falling behind . Journal of Economic History , 46 ( 2 ) : 385 – 406 .
- Abramovitz , M and David , P A . 1996 . “ Convergence and deferred catch-up: Productivity leadership and the wanting of American exceptionalism ” . Edited by: Ralph , L , Timothy , T and Gavin , W . Stanford : The Mosaic of Economic Growth. Stanford University .
- Aigner , D , Lovell , C and Schmidt , P . 1977 . Formulation and estimation of stochastic frontier production function models . Journal of Econometrics , 6 ( 1 ) : 21 – 37 .
- Azam , J P , Fosu , A and Ndung'u , N S . 2002 . Explaining slow growth in Africa. Paper prepared for the ‘Can Africa Claim the 21st Century’ conference . African Development Bank , 6–10 July, Abidjan, Côte d'Ivoire
- Battese , G E and Coelli , T J . 1995 . A model for technical inefficiency effects in a stochastic frontier production function for panel data . Empirical Economics , 20 ( 2 ) : 325 – 32 .
- Baussola , M . 1997 . Social capability and long term economic growth. Book review . Economic Journal , 107 ( 444 ) : 1575 – 6 .
- Bennet , M . 2006 . “ Lesotho's export: textile and garment industry ” . Edited by: Jauch , H and Traub-Merz , R . Future of the Textile and Clothing Industry in Sub-Saharan Africa. Friedrich-Ebert-Stiftung, Bonn
- Chapelle , K and Plane , P . 2005 . Technical efficiency measurement within the manufacturing sector in Côte d'Ivoire: A stochastic frontier approach . Journal of Development Studies , 41 : 1303 – 24 .
- Chete , L N and Adenikinju , A F . 2002 . Productivity growth in Nigerian manufacturing and its correlation to trade policy regimes/indexes (1962–85) . AERC Research Paper 127, African Economic Research Consortium, Nairobi
- Coelli , T J . 1996 . A guide to FRONTIER version 4.1: A computer program for stochastic frontier production and cost function estimation. CEPA Working Paper No. 7/96, Centre for Efficiency and Productivity Analysis, Australia
- Collier , P and Gunning , J W . 1999 . Explaining African economic performance . Journal of Economic Literature , 37 ( 1 ) : 64 – 111 .
- Desai , M . 1976 . Applied Econometrics , Oxford : Phillip Alan .
- Easterlin , R E . 1981 . Why isn't the whole world developed? . Journal of Economic History , 41 ( 1 ) : 1 – 19 .
- Farrell , M J . 1957 . The measurement of productive efficiency . Journal of the Royal Statistical Society Series A , 120 : 253 – 81 .
- Grossman , G and Helpman , E . 1991 . Innovation and Growth in the Global Economy , Cambridge : MIT Press .
- Hall , R E and Jones , C I . 1999 . Why do some countries produce so much more output per worker than others? . Quarterly Journal of Economics , CXIV ( 1 ) : 83 – 116 .
- Hoekman , B and Ozden , C . 2005 . “ Trade preferences and differential treatment of developing countries: A selective survey ” . In Policy Research Working Paper 3566 , Washington , DC : World Bank .
- Jefferis , K and Smith , G . 2005 . The changing efficiency of African stock markets . South African Journal of Economics , 73 ( 1 ) : 54 – 67 .
- Jerome , A . 1999 . Infrastructure in Africa: The record. Economic Research Paper No. 46. www.agirn.org/documents/Infrastructure_Africa.pdf Accessed 23 June 2010
- Kaplinsky , R and Morris , M . 2006 . The Asian drivers and SSA: MFA quota removal and the portents for African industrialisation? http://asiandrivers.open.ac.uk/documents/Kaplinsky_Morris_ADs_and_SSA_OECD_Final_May_06.pdf Accessed 12 June 2010
- Krugman , P . 1987 . The narrow moving bank, the Dutch disease and the competitive consequences of Mrs Thatcher: Notes on trade in the presence of dynamic scale economies . Journal of Development Economics , 27 ( 1–2 ) : 41 – 55 .
- LBOS (Lesotho Bureau of Statistics) . 2006 . Industrial Database , Lesotho : Maseru .
- Lundvall , K and Battese , G E . 2000 . Firm size, age and efficiency: Evidence from Kenyan manufacturing firms . Journal of Development Studies , 36 ( 3 ) : 146 – 63 .
- McArthur , J and Teal , F . 2002 . “ Corruption and firm performance in Africa. CSAE WPS/2002-10 ” . In Centre for the Study of African Economies Oxford
- Meeusen , W and Van Den Broeck , J . 1977 . Efficiency estimation from Cobb-Douglas production functions with composite error . International Economic Review , 18 ( 1 ) : 435 – 44 .
- Mengistae , T and Pattillo , C . 2004 . Export orientation and productivity in sub-Saharan Africa . IMF Staff Papers , 51 ( 2 ) : 327 – 53 .
- NEPAD (New Partnership for Africa's Development) . 2001 . The NEPAD framework document. www.nepad.org/2005/files/documents/inbrief.pdf Accessed 22 January 2008
- North , D . 1990 . Institutions, Institutional Change and Economic Performance , Cambridge : Cambridge University Press .
- Prebisch , R . 1964 . Towards a New Trade Policy for Development , New York : United Nations .
- Rau , N . 2004 . Financial intermediation and access to finance in African countries south of the Sahara. www.commerce.uct.ac.za/Research_Units/DPRU/DPRU-Conference2004/Papers/Financial_Intermediation_Neren_Rau.pdf.pdf Accessed 23 June 2010
- Reifschneider , D and Stevenson , R . 1991 . Systematic departures from the frontier: A framework for the analysis of firm inefficiency . International Economic Review , 32 ( 3 ) : 715 – 23 .
- Salm , A , Grant , W J , Green , T J , Haycock , J R and Raimondo , J . 2002 . Main report on Lesotho garment industry sub-sector study. www.commark.org/files/publications/Lesotho_Garment_Industry_Subsector_Report.pdf Accessed 12 August 2006
- Schumpeter , J . 1934 . The Theory of Economic Development , Cambridge , MA : Harvard University .
- Shapouri , S and Trueblood , M . The African growth and opportunity act (AGOA): Does it really present opportunities? . Paper presented at the International Conference on Agricultural Policy Reform and the WTO: Where are we Heading? . June 23–26 , Capri , Italy.
- Skonhoft , A . 1995 . Catching-up, and falling-behind: A vintage model approach . Journal of Evolutionary Economics , 5 ( 3 ) : 285 – 95 .
- Soderbom , M and Teal , F . 2004 . Size and efficiency in African manufacturing firms: Evidence from firm level panel data . Journal of Development Economics , 73 ( 1 ) : 369 – 94 .
- Solow , R M . 1956 . A contribution to the theory of economic growth . Quarterly Journal of Economics , 70 ( 1 ) : 65 – 94 .
- Solow , R M . 1957 . Technical change and the aggregate production function . Review of Economic Statistics , 39 ( 3 ) : 312 – 20 .
- Taylor , T G . 2005 . Export diversification in Latin America and the Caribbean . The International Trade Journal , XVII ( 2 ) : 101 – 28 .
- Tybout , J R . 2000 . Manufacturing firms in developing countries: How well do they do, and why? . Journal of Economic Literature , 38 ( 1 ) : 11 – 44 .
- UNComtrade (United Nations Comtrade), 2008. Comtrade database. http://comtrade.un.org/ Accessed 10 June 2008.
- Verspagen , B . 1999 . “ A global perspective on technology and economic performance, and the implications for the post socialist countries ” . In Innovation and Structural Change in Post-Socialist Countries: A Quantitative Approach , Edited by: Dyker , D A and Radosevic , S . Dordrecht : Kluwer .
- World Bank, 2005. Lesotho investment climate assessment: Summary. www.worldbank.org/afr/aftps Accessed 26 July 2007.
- World Economic Forum, 2007. The Africa competitiveness report. www.weforum.org/en/initiatives/gcp/Africa%20Competitiveness%20Report/index.htm Accessed 12 June 2008.
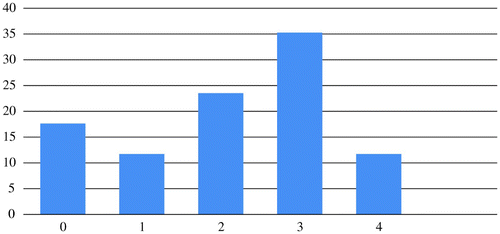
Appendix A. Histograms of responses to questions on different manifestations of social capability deficits
Figure A1: Public infrastructural service delivery as an obstacle* (%)
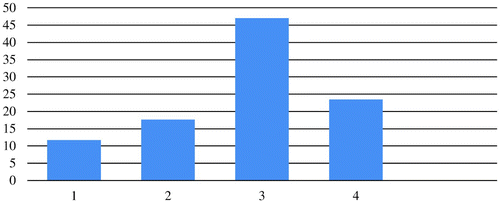
Figure A2: Skills shortage as an obstacle (%)
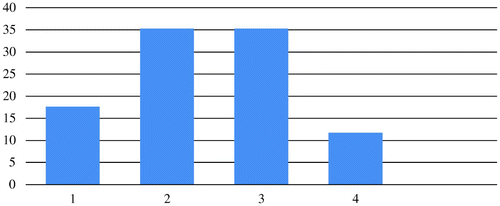
Figure A3: Efficiency* of financial institutions (%)
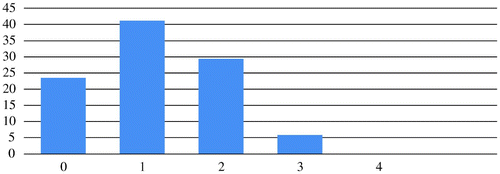
Figure A4: Bureaucracy* as an obstacle (%)
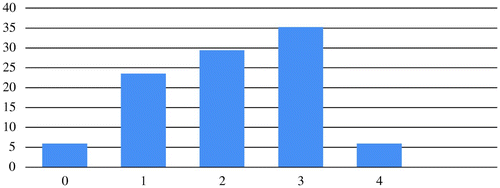
Figure A5: Corruption as an obstacle* (%)