Abstract
In this paper, we revisit ‘what and who’ is middle class in South Africa using data collected in the 2008 National Income Dynamics Study. First, we consider how to identify the middle class based on two broad definitions adopted in the international economics literature: a middle class defined by the middle share of the national income distribution; and a middle class defined by an absolute level of affluence and lifestyle. We explore alternative ways of capturing the ‘middle income strata’ and we suggest an approach for identifying threshold levels of income associated with middle-class affluence. Second, we show that the size and the composition of the middle class in South Africa are both very sensitive to how the middle class is defined. In particular, we demonstrate that there is very little overlap between the two broad definitions, a finding which reflects very high levels of poverty and inequality in the country.
1. Introduction
The development of a middle class holds promise for the development of the rest of an economy. Studies from a number of countries suggest that a sizable middle class may help to foster higher levels of economic growth (cf. Easterly Citation2001, Citation2007), be it through: attitudes and behaviours specific to the middle class (cf. Landes, Citation1998; Doepke & Zilibotti, 2008); stimulating optimal levels of effective demand (cf. Brown, Citation2004); higher overall rates of human capital accumulation (cf. Galor & Zeira, Citation1993; Perotti, Citation1996; Sokoloff & Engerman, Citation2000); or the promotion of democracy and political stability (cf. Bollen & Jackman, Citation1985; Barro, Citation1999; Easterly, Citation2001).
A focus on the middle class also provides another window through which progress in development can be measured and the effects of redistributive economic policy can be assessed. Although there is a large literature which investigates how poverty and inequality have changed in post-apartheid South Africa, there has been relatively little work that interrogates the nature of the middle class during this time. Those studies that have been conducted typically identify the middle class in terms of level of income or occupational status, which makes it possible for people to enjoy a life of ‘middle-class’ affluence (Rivero et al., Citation2003; Schlemmer, 2005; Udjo, Citation2008; StatsSA, Citation2009; Van der Berg, Citation2010).
In this paper, we revisit ‘what and who’ is middle class in South Africa using data collected in the first wave of the National Income Dynamics Study (NIDS). The paper has two key objectives. First, we consider how to identify the middle class based on two broad definitions adopted in the international economics literature: a middle class defined by the middle share of the national income distribution; and a middle class defined by an absolute level of affluence and lifestyle. We explore alternative ways of capturing the ‘middle strata’ of the national income distribution; and we suggest an approach for identifying threshold levels of income associated with middle-class affluence. Second, we show that the size and composition of the middle class in South Africa is very sensitive to how middle class is defined. In particular, we show that there is very little overlap between the two broad definitions, a finding which reflects the country's high levels of poverty and inequality. A sizeable share of those in the middle income strata in South Africa live in poverty; while a middle class identified by affluence corresponds to the upper tail of the national income distribution. Furthermore, although Africans are considerably under-represented in the affluent middle class, this is not the case in the middle income strata. Competing measures of class status, therefore, have ramifications for policy design and the assessment of policy targets. For example, the redistributive components of a policy that seeks to promote the middle class will differ according to which definition of middle class is adopted.
The paper is structured as follows. Section 2 reviews the literature on the middle class in South Africa. Section 3 discusses the NIDS 2008 data and reviews two approaches to conceptualising the middle class; namely, by the middle strata or by affluence. Section 4 contrasts the size, racial composition and economic profile of the middle class in South Africa using these two approaches. This includes descriptions of average income, sources of income, asset levels, the labour market and educational attainment. The final section summarises the main findings of the study.
2. Review: The middle class in South Africa
There are different conceptions of middle class. Being middle class may refer to having attained a certain absolute level of affluence or a particular lifestyle. Middle class may also refer to the relative economic position of the average citizen in society. In studies from developed countries in the international economics literature (cf. Thurow, Citation1987; Horrigan & Haugen, Citation1988; Davis & Huston, Citation1992; Pressman, Citation2007; Palma, Citation2011), the middle class is typically identified as those individuals who occupy the middle strata of the income distribution, a group which is also likely to be affluent in absolute terms. In contrast, in developing countries, where the average citizen may be poor or not far from poverty, these two conceptions of the middle class may differ considerably.
Most of the research in the economics literature that has investigated the middle class in South Africa has defined middle class in terms of an absolute level of ‘affluence’, with the main objective being to explore how the size and composition of this group has changed in the post-apartheid period. The threshold level of affluence which identifies the middle class, however, varies across studies. Furthermore, studies differ according to whether middle class is defined in terms of individual or household access to resources. Studies which use the individual to identify class status, typically use individual earnings income (sometimes filtered by occupation) to identify the class status of economically active adults. Consequently, it is not possible to determine the class status of non-economically active adults (housewives, students and pensioners) as well as children. Identifying class status at the level of the individual may also classify individuals of the same household (who arguably share the same lifestyle, resources and social status) into different class categories. The more common approach is to identify the middle class in terms of household well-being. In other words, an individual is identified as being middle class if he or she lives in a household in which total household income, or per-capita household income, lies within a certain range.
Rivero et al. Citation(2003) examine the development of the middle class in South Africa between 1994 and 2000 in light of the positive association between the size of the middle class and a stable democracy. Using the Human Sciences Research Council February Omnibus Surveys, they define middle class at the level of the individual and they measure class status by occupation. The self-employed are filtered further by an earnings criterion (between the second and fourth earning quintiles of the white population). The study suggests that the middle class in South Africa grew from 8.8% of the total adult population in 1994 to 11.9% in 2000. This growth was characterised by an increase in the number of Africans in high-level occupations (particularly professionals). However, relatively small sample sizes (approximately 2500 individuals) for each survey, compromised the ability to identify statistically significant trends across specific occupation groups.
Schlemmer (Citation2005:3) uses the 1993 and 2003 All Media Product Survey (AMPS) to examine the growth of ‘the core African middle class’. The study does not distinguish this middle class from an upper class. Rather, the core African middle class is defined as African households which received a total household income (unadjusted for household size) in excess of R12 000 per month (in 2003 prices) and fell into the South African Advertising Research Foundation's top two Living Standard Measures 9 and 10. Schlemmer Citation(2005) finds that this ‘core African middle class’ grew from some 19 000 individuals in 1993 (0.11% of the African population aged 16+) to 129 000 individuals in 2003 (0.58% of the African population aged 16+) – an impressive average growth rate of 20% per annum, albeit from a very low base.
Udjo (Citation2008:9) also uses the South African Advertising Research Foundation's Living Standard Measures with AMPS data, but he examines the ‘emerging’ middle class. This is defined as households which fell within Living Standard Measures 5 to 7 and refers to individuals who typically live in households with an income of R2436 to R6437 per month in 2000 prices (again unadjusted for household size). The study estimates that the emerging African middle class grew from 6.31 million individuals in 2001 (amounting to 14.0% of the population) to 9.32 million individuals in 2007 (or 19.2% of the population), representing a more modest average annual growth rate of 6.5%.
StatsSA (2009:1) investigates the growth of households with a ‘middle-class standard of living’ using a number of datasets, including the October Household Surveys 1998–2009, the Labour Force Surveys 2000–01 and the General Household Surveys 2002–06. In this study, the middle class is not defined in terms of household income but rather by those households:
residing in formal housing, having a water tap in the residence, having a flush toilet in the residence, having electricity as the main lighting source, having electricity or gas as the main cooking source, and having a landline or a household member having a cell phone. (StatsSA, 2009:1)
Van der Berg Citation(2010) includes an analysis of changes in the size of the African middle class, in a paper which examines inequality trends in the post-apartheid period more generally. The study also makes use of AMPS data, but in contrast to the earlier studies it defines the middle class in terms of household income adjusted for household size. As in the study by Schlemmer Citation(2005) and StatsSA (2009), Van der Berg Citation(2010) does not specify an upper threshold for the middle class, but identifies two different base thresholds: R25 000 per capita per annum and R40 000 per capita per annum (in 2000 prices). The study estimates that the percentage share of Africans in the middle class increased from 21.1% to 44.0% using the R25 000 per annum threshold and from 12.3% to 36.4% using the R40 000 per annum threshold. This represents an increase in the relative size of the African middle class from 13.5% to 20.6% of the total population between 1994 and 2008 using the R25 000 threshold and from 8.1% to 11.7% of the population using the R40 000 threshold.
3. Data, definitions and methods
We contribute to the literature on the middle class in South Africa by considering alternative ways of defining middle class, and by showing that the size and composition of the middle class differ considerably, depending on whether it is identified by some absolute level of affluence or by the middle position in the income distribution. In this section, we describe how we derive these two definitions of middle class, using data from the first wave of NIDS 2008.
NIDS is a nationally representative household survey which collects detailed information on both total household income and expenditure. In contrast to many other nationally representative surveys in South Africa, NIDS captures a wide array of individual and household sources of income, including not only labour-market income but also government grant income, other government income, investment income, remittance income and agricultural income. To identify the middle class, we use per-capita total household income to measure economic status. Total household income is estimated by aggregating across all the income sources excluding implied rental income.Footnote3 A per-capita income measure is derived by dividing this income by the number of resident household members.
3.1 The middle income strata: A relative approach
To identify the middle class as the middle income strata, we consider three possible definitions, following methodologies that are commonly adopted in the international economics literature on class status. The first definition involves dividing households into income quantiles with the middle quantiles selected as the middle class (cf. Easterly, Citation2001; Solimano, 2009). We identify the middle third of households from the per-capita household income distribution and call this the ‘middle tercile’ definition.
The second and third definitions identify the middle class in terms of a range of income centred on median income (cf. Pressman, Citation2007; Ravallion, Citation2010). Following an influential paper by Thurow Citation(1987), studies of developed countries typically use an income threshold of between 75% and 125% of median income in the per-capita household income distribution, which we refer to as the ‘75 to 125% median’ definition. Some authors have widened the threshold, arguing that 75 to 125% of the median may create too large an upper class (cf. Davis & Huston, Citation1992; Brandolini, Citation2010). For the third definition we follow Davis & Huston Citation(1992), who adopt an income range of between 50% and 150% of median income and call this the ‘50 to 150% median’ definition.
These three ways of conceptualising the middle class as the ‘middle strata’ in the income distribution are shown in the kernel density estimation of the log of income in and the corresponding . The figure clearly shows how each definition includes a group of households in the middle of the per-capita household income distribution. Nonetheless, the exact boundaries identifying the middle class vary.
Table 1: Lower and upper bound ranges for households in the middle class by definition
Figure 1: Kernel density estimation of log income
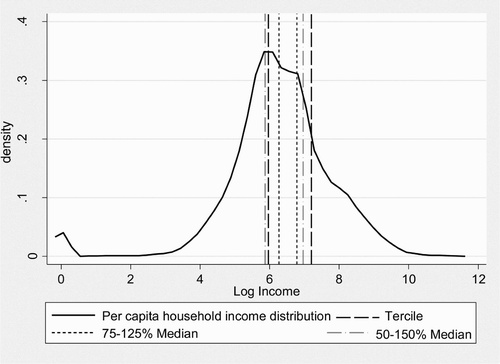
indicates that the ‘middle tercile’ definition has the widest income boundary for the middle class, with 4.56 million households falling within this income threshold. This includes some 1.19 million households that fall below a commonly adopted poverty line of R515 per capita per month in 2008 prices (see Hoogeveen & Özler, Citation2006; Leibbrandt et al., Citation2010; Posel & Rogan, Citation2012). The ‘50 to 150% median’ definition uses a narrower range of income to identify households as middle class and also selects households which are generally poorer. More specifically, the ‘50 to 150% median’ definition selects a total of 4.25 million middle class households of which 1.52 million households fall below the poverty line. The ‘75 to 125% median’ definition identifies the smallest income range for the middle class, selecting only 1.96 million households into the middle class. There are no households which fall below the poverty line as the lower bound for the ‘75 to 125% median’ definition of R529 is above the R515 per capita poverty line (although only just). Although the ‘75 to 125% median’ definition differs notably from the other two definitions in terms of the number of households identified as middle class, it includes a narrower range of households rather than a different subset of middle-class households.
For the remainder of the analysis in this paper, we use the 50 to 150% median definition of the middle class as a summary measure of the middle-income approach. This definition specifies an upper income threshold that falls between those of the other two definitions, and provides a measure of middle class comparable with the middle tercile definition which is less restrictive than the 75 to 125% median definition. Identifying the South African middle class by the middle income strata selects households which are generally close to, and even below, the poverty line. The implications of this finding for the description of the middle class are highlighted throughout the remainder of the paper.
3.2 Affluence and lifestyle: An absolute approach
The second approach to identifying the middle class is in terms of an absolute standard of affluence or lifestyle; that is, what would normatively be considered to be a ‘middle-class' standard of living. In the international economics literature, middle-class affluence is typically identified using a threshold of household income, adjusted for household size. One of the difficulties of this approach is that the choice of income threshold is inherently subjective (particularly in developing countries where household incomes vary widely).
In their multi-country studies of the middle class in the developing world, Ravallion Citation(2010) and Banerjee & Duflo Citation(2008) select individuals into the middle class who fall between $2 to 13 (2005 prices) and $2 to 10 (1993 prices) per capita per day, respectively. The middle class defined in these terms has barely escaped poverty (and aligns closer to the middle class defined by the middle income strata). This is in contrast to other studies of the middle class in developing countries that select absolute income thresholds well above the poverty line (more in line with the level of affluence of the middle class in developed countries). For example, Milanovic & Yitzhaki Citation(2002) as well as Bussolo et al. Citation(2008) identify the middle class using an income threshold of $303 (the average income of Brazil) to $611 (the average income of Italy) per capita per month in 1993 prices. That is some 10 to 20 times the international poverty line of $1 per day. Wilson & Dragusanu Citation(2008) employ an even higher and wider threshold of $500 to 2500 per adult equivalent per month in 2007 prices. Bhalla Citation(2007) as well as Kharas & Gertz Citation(2010) use an income threshold of $10 to 100 per capita per day (in 2006 and 2005 prices, respectively), while Birdsall Citation(2010) also uses a lower income threshold of $10 per day in 2005 prices but caps the upper boundary at the income level of the individual at the 95th percentile.
Studies of the middle class in South Africa similarly adopt a wide range of income thresholds. Schlemmer Citation(2005) uses a total household income threshold of R12 000 per month and above in 2003 prices, unadjusted for household size. This converts into R3399 per capita per month if adjusted by the average size of households with a total income in excess of R12 000 per month (3.55 individuals per household in the NIDS 2008). Van der Berg Citation(2010) uses two base thresholds of R2083 and R3333 per capita per month in 2000 prices, respectively, with no upper income threshold. Although Udjo Citation(2008) does not use income to identify the middle class directly, he nevertheless describes middle-class households as possessing a total household income of between R2436 and 6437 per month in 2000 prices. This converts into a per-capita monthly income (assuming an average of 3.55 individuals per household) of R686 and R1813, respectively.
describes the diversity in income thresholds used by studies of the middle class in the local and international literature. These are adjusted to 2008 purchasing power parity (PPP) monthly Rand values for comparability.Footnote4 The table clearly shows the wide range of income boundaries used to identify the middle class across different studies of developing countries. The extent of this divergence reflects whether or not middle-class affluence is made ‘appropriate to what that term means in developing countries rather than developed ones’ (Ravallion, Citation2010:446). The studies of the middle class in South Africa in particular (with the exception of Udjo, Citation2008) appear to measure middle-class affluence at the level of affluence suitable for developed countries. In this regard, Schlemmer Citation(2005) and Van der Berg Citation(2010) do not distinguish between the middle and upper class, perhaps because the size of the upper class would be too small.
Table 2: Per-capita monthly income boundaries to identify the middle class in developing countries by various authors (2008 PPP Rand values)
In an attempt to identify a plausible income range associated with ‘middle-class affluence’, we consider the earnings of individuals working in occupations that are typically associated with the middle class. We identify middle-class occupations as including managers, senior officials, legislators, professionals, associate professionals, technicians and clerks. These occupations correspond to major groups 1 to 4 in the International Standard Classification of Occupations. We further delineate between upper and lower middle-class occupations.
Section A of describes average monthly earnings for all individuals employed in these occupations. For purposes of comparison, the table also includes monthly earnings for those employed in typically working-class occupations. The rankings of broad occupational categories according to earnings are ordered, as one would expect. Earnings of individuals in upper-middle-class occupations are higher than those in lower-middle-class occupations, which are above earnings in working-class occupations (this is seen by comparing mean incomes across occupational groups or by comparing earning percentiles). Mean earnings in middle-class occupations range from R4221 per month for clerks to R12 738 per month for legislators, senior officials and managers. This is in comparison to mean earnings for working-class occupations, which range between R1254 for individuals in elementary occupations to R3835 for craft and related trade workers.
Table 3: Earnings (Rands) and occupational status
An analysis of individual earnings by occupation, however, fails to take into account that resources are shared at household level. In order to assess affluence adjusted for household size, Section B of reports the mean per-capita income for households using the occupational status of the highest income earner in the household to represent the occupational status of the household.
The mean per-capita household incomes reported in Section B of are understandably lower than the mean earnings of individuals viewed in isolation. However, mean household size does not change significantly by occupation, and the income rankings by class grouping therefore remain unchanged: upper-middle-class occupations are the most affluent, followed by lower-middle-class occupations and then working-class occupations. Mean per-capita incomes for households in middle-class occupations range from R2749 per month for clerks to R8228 per month for legislators, senior officials and managers. Considering that the median income in household per-capita income distribution is only R705 per month, the average household with a middle-class occupation is clearly relatively affluent in our society. At the 20th percentile, however, households in lower middle-class occupations (specifically clerks, technicians and associate professionals) come close to the median per-capita monthly income receiving R795 and R763 per capita per month, respectively. Nevertheless, such households are still considerably better off than households with working-class occupations at the 20th percentile, all of which (with the exception of craft and related trade workers) fall below the poverty line of R515 per capita per month.
For international comparability, we use a lower income threshold of R1400 per capita per month to identify the middle class by affluence. This falls above the 20thh percentile for the poorest of middle-class occupations (namely, clerks) and corresponds to $10 per capita per day in 2005 PPP prices commonly used in the international literature. For the upper income threshold, we use R10 000 per capita per month, which is below the 80th percentile for the wealthiest of middle-class occupations (namely, managers) and is the equivalent of $70 per capita per day in 2005 PPP prices. The upper threshold income of R10 000 per capita per month falls between the 96th and 97th percentiles of the per-capita household income distribution. This is in line with studies from the international literature, which typically restrict the upper class to the top 1 to 5% of households in the national income distribution (cf. Birdsall, Citation2010).
4. Findings: What and who is middle class?
We use the NIDS 2008 data to compare the size and composition of the middle class in South Africa, depending on whether the middle class is defined by the middle of the national income distribution (the ‘middle strata’: 50 to 150% of the median household income) or by an absolute level of affluence (‘middle-class affluence’: R1400 to 10 000 per capita per month). The lower class and upper class from both approaches are also included for purposes of comparison.
4.1 The size of the middle class
reports the size of the middle class as well as the proportion of total income accruing to it, whether defined by the middle income strata or by an absolute standard of middle-class affluence.
Table 4: Size of the middle class
The size of the middle class varies significantly across the two approaches: the middle class comprises approximately 15.4 million individuals (31.6% of population) when defined by the middle strata in comparison with only 9.9 million individuals (20.4% of the population) when defined by middle-class affluence.
Comparing the size of the middle class without comparing the lower and upper classes, however, masks the extent to which class structure in South Africa fundamentally differs across these two approaches. Whereas the upper class identified by the upper income strata (income above 150% of the median) comprises 27.6% of the population, the upper class corresponding to the affluence definition (above R10 000 per capita per month) comprises only 2.1% of the population. At the bottom of the income distribution, the lower class defined by the lower income strata (income below 75% of the median) comprises some 40.8% of the population, whereas the lower class identified by an affluence approach (less than R1400 per capita per month) accounts for 77.4% of the population.
The large difference in the class structure between these two approaches is also shown by the percentage of total household income accruing to the lower, middle and upper classes, respectively. In particular, the middle class defined as the middle strata receives only 13.2% of total household income, whereas the middle class defined by middle-class affluence receives some 49.6% of total household income.
The fundamental difference in class structure between these two approaches has important ramifications for policy-makers who seek to promote the growth and status of the middle class. If the middle class is conceptualised by middle-class affluence, then growing the relative size of the middle class would amount to supporting economic policies which would increase income polarisation by favouring the rich, thereby increasing income inequality. In contrast, if the middle class is defined by the middle income strata, then increasing the relative size of the middle class would imply supporting economic policies that decrease income polarisation, thereby decreasing income inequality.
4.2. The racial composition of the middle class
presents the racial composition of the middle class in South Africa defined by the middle income strata as well as by middle-class affluence. Individuals who reside in households which fall in the middle income strata (between 50 and 150% of the median) are predominantly African (83.4%), followed by coloureds (11.1%), whites (2.8%) and Indians (1.8%). The middle class defined by affluence (R1400 to 10 000 per capita per month), however, is far less dominated by Africans, who comprise just under 50% of individuals in the middle class, followed by whites (31.1%), coloureds (11.7%) and Indians (6.7%). The racial composition of the middle class defined by the middle strata therefore reflects the same ordering and similar racial shares of the population (with the exception of white individuals who are under-represented); while in the middle class defined by affluence, whites are considerably over-represented and Africans are considerably under-represented.
Table 5: Racial composition of the middle class
The lower classes across the two approaches are most similar, being made up mostly of Africans, but the upper classes are vastly different. Using an income strata approach to define class status, the upper income strata comprises a majority of Africans (51.3%) although Africans are considerably under-represented relative to their population share, followed next by the share of whites at 29.2% (who are over-represented). Using an absolute affluence approach to identify class status, however, produces an upper class where whites form the majority at 65% (and are hence heavily over-represented) and Africans are in the minority at only 20.3% (and are therefore significantly under-represented).
The racial composition of the middle class therefore clearly depends on the definition of middle class being used. This in turn has implications for evaluating the scope of equity policy in South Africa, as contained for example in Broad-Based Black Economic Empowerment initiatives. Adopting a middle income strata definition of middle class would suggest that the middle class is already racially transformed, with Africans comprising more than 80% and whites less than 3%. However, the middle class identified by affluence strongly under-represents Africans and over-represents whites (although Africans comprise almost 50% of individuals in this middle class in percentage terms).
4.3. The economic status of the middle class
Mean per-capita monthly household incomes of middle-class households, and their sources of income, are reported in . These differ significantly across the two definitions of middle class.
Table 6: Mean income (Rands) and sources of income of the middle class
The mean income for middle-class households according to the middle strata definition is only R646 per capita per month, some 25% above the R515 per capita per month poverty line. In fact, it is estimated that 42.8% of individuals in the ‘middle’ of the income distribution fall below the R515 per capita per month poverty line. This is in stark contrast to the mean income of the middle class defined by middle-class affluence of R3656 per capita per month (which is some 5.7 times higher than the mean income of the middle class identified by the middle income strata).
Income differences between the two conceptions of middle class are further highlighted by comparing the average share of income received by households across the sources of income. The middle class identified by affluence relies primarily on labour-market income (85.3%), followed by income from investments (8.8%). Although the middle class defined by the middle strata also relies mostly on labour-market income (58%), this is heavily subsidised by income from government grants (30.9%) as well as a component from remittances (8.3%). A comparison of the lower classes, across definitions of middle class, shows that the lower class identified by the lower income strata is dependent primarily on income from government grants (52.7%) followed by the labour market (32.9%), whereas for the lower class defined by affluence, labour market income is the modal income source (49.5%) followed by government grants (38%).
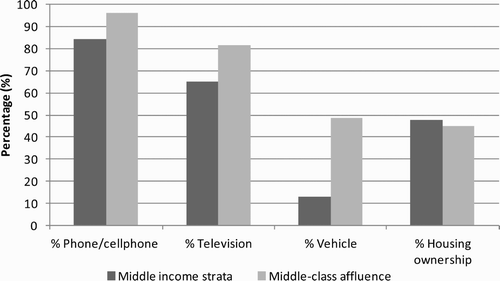
The level of asset ownership similarly differs significantly across the two definitions of middle class. shows that the percentage of households which own a telephone, television or vehicle is significantly higher for households in the middle class defined by affluence compared with the middle strata (these differences are significant at the 95% level of confidence). This is most pronounced in terms of vehicle ownership, which rises from only 12.9% of households in the middle strata to 48.5% of households defined by middle-class affluence. Home ownership (of a formal structure), however, shows no statistical difference between the alternative definitions of the middle class at the 95% confidence level. This is a surprising finding but may reflect ownership of government-subsidised houses among poorer households.
Figure 2: Asset ownership and the middle class
The divergence in the economic status of the middle class across these two approaches reveals the sensitivity of class composition to its definition, particularly in a developing economy context such as South Africa. Average income and asset ownership for households in the middle of the national income distribution typically fall much below that of households defined by an absolute threshold of middle-class affluence. In this context, measuring the economic status of the middle-class affluent without taking cognisance of the middle income strata gives an unbalanced picture of economic development. Rather, the economic status of households in the ‘middle’ of the income distribution can provide a key litmus test for evaluating ‘inclusive growth’ as targeted in macroeconomic policy.
4.4 Labour market status and educational attainment of the middle class
highlighted the importance of the labour market as the largest single contributor to total household income for middle-class households, whether identified by the middle strata or by affluence. examines the labour market in greater detail, presenting the average earnings and employment status of the working-age population (aged 15 to 62 years) by class status. The upper threshold for the working-age population is based on age eligibility for receipt of the state old-age pension for men. This age was 63 years at the time fieldworkers were collecting the NIDS 2008 data.
Table 7: The labour market and the middle class (working-age population, 15 to 62 years old)
The mean wage of employed working-age individuals in the middle class, as defined by the middle strata, is relatively very low, at R1321 per month, and the broad unemployment rate is high at 31%. Such unfavourable labour-market outcomes for individuals in the middle strata are very different from the above-average earnings (of R5657 per month) and the comparatively low unemployment rate (of 10%) facing working-age individuals in the middle class defined by affluence.
also reports the average number of adults in employment per household (whether wage or self-employed) by class status. The table shows that there are significantly more employed adults per household for the affluent middle class (an average of 1.25 adults per household) compared with the middle class defined by the middle strata (0.93 adults per household). Further, the last row of shows that a significantly higher proportion of the employed in the middle income strata are in casual employment compared with the affluent middle class (0.15 versus 0.07).
These differences in labour-market outcomes across the two definitions of middle class correspond to significant differences in educational attainment, as seen in . The average years of education for individuals aged 15 to 62 years (working-age population) in the affluent middle class is 11.2 years (i.e. just short of matriculation or Grade 12 education) compared with 8.6 years (approximately Grade 9) for the middle class conceptualised by the middle strata. Approximately 40% of individuals in the affluent middle class have less than a matriculation education, compared with approximately 75% of individuals in the middle income strata. Further, the percentage share of individuals in the middle strata who have a matriculation or tertiary-level education is 17.2% and 2.4% respectively, compared with far higher percentages of individuals in the affluent middle class (30.7% and 23.2% of individuals with matriculation and tertiary education, respectively). The upper ‘affluent’ class is particularly well educated, with 60.7% of individuals having tertiary-level education. Hence, part of the difference in earnings and employment outcomes across the two conceptions of middle class is likely to result from considerable differences in education.
Table 8: Educational attainment and the middle class (working-age population, 15 to 62 years old)
5. Conclusion
There are two approaches to defining the middle class in the international economics literature: a relative definition of middle class as the middle income strata; or an absolute definition of middle class based on a middle-class lifestyle or level of affluence. This study has demonstrated that the size, composition and economic profile of the middle class in South Africa are very different across these two broad definitions. Given extensive poverty and income inequality in South Africa (Hoogeveen & Özler, Citation2006; Leibbrandt et al., Citation2010; Posel & Rogan, Citation2012), individuals living in households which are ‘middle of the road’ in the national income distribution do not possess the socio-economic status typically associated with middle-class affluence.
The size of the middle class defined by affluence is significantly smaller than the size of the middle class identified by the middle income strata at 20.4% and 31.6% of the population, respectively. Furthermore, the racial composition of the middle class differs considerably across the two approaches. Whereas the racial profile of the middle income strata broadly reflects the racial shares in the total population (over 80% of households in the middle strata are African), the racial composition of the affluent middle class over-represents whites and under-represents Africans. Mean incomes also differ significantly across the two approaches. The mean monthly income for the middle strata is only R646 per capita per month in 2008 prices (of which 58% is derived from the labour market and 30.9% from government grants) compared with R3656 per capita per month for households defined by middle-class affluence (of which 85.3% is derived from the labour market and 8.8% from investments). Differences in mean incomes correspond to differences in labour market status and educational attainment. In comparison with the middle income strata, the affluent middle class reports significantly higher earnings, is less likely to be casually employed or unemployed and is more likely to possess a matriculation or tertiary education.
In light of these competing descriptions of the middle class, the obvious question to ask is whether one definition is more appropriate than the other? We suggest that both definitions of the middle class are useful, as is a comparison of the economic status of individuals across the two definitions. The middle class conceptualised by a middle-class level of affluence draws attention to those in society who have achieved a standard of living associated with economic stability and prosperity. Given South Africa's history of racial exclusion and discrimination, this definition of middle class typically is used to assess racial transformation in opportunities and access to resources. The middle class conceptualised by the middle income strata draws attention to the status of the ‘average’ or ‘regular’ South African. This is a useful measure for assessing progress at the median and the inclusivity of economic growth. In addition, the difference in the economic well-being and composition of these two middle classes provides another window through which economic development and changes in income inequality can be viewed.
Notes
3 We exclude implied rental income from the aggregate measure because non-response rates in NIDS 2008 exceeded 40%. Moreover, implied rental income is infrequently included in any analysis of household income in South Africa.
4 We use the US Bureau of Labor Statistics Consumer Price Index (All Urban Consumers) to adjust into 2008 dollar prices,and convert to PPP Rand values following Leibbrandt et al. Citation(2010) who use a parity exchange rate of 4.25 Rands to the dollar in 2008.
References
- Banerjee , A and Duflo , E . 2008 . What is middle class about the middle classes around the world? . Journal of Economic Perspective , 22 ( 2 ) : 3 – 28 . (doi:10.1257/jep.22.2.3)
- Barro , R . 1999 . Determinants of democracy . Journal of Political Economy , 107 ( 6 ) : 158 – 83 . (doi:10.1086/250107)
- Bhalla , S . 2007 . Second Among Equals: The Middle Class Kingdoms of India and China , Washington , DC : Peterson Institute for International Economics .
- Birdsall , N . 2010 . “ The (indispensable) middle class in developing countries ” . In Equity and Growth in a Globalizing World , Edited by: Kanbur , R and Spence , M . Washington , DC : The World Bank .
- Bollen , K A and Jackman , RW . 1985 . Political democracy and the size distribution of income . American Sociological Review , 50 : 438 – 57 . (doi:10.2307/2095432)
- Brandolini , A . On the identification of the ‘middle class’ . Luxembourg Income Survey Conference on Inequality and the Status of the Middle Class . 28–30 June 2010 . Luxembourg
- Brown , C . 2004 . Does income distribution matter for effective demand? Evidence from the United States . Review of Political Economy , 16 ( 3 ) : 291 – 307 . (doi:10.1080/0953825042000225607)
- Bussolo , M , De Hoyos , R and Medvedev , D . 2008 . Is the developing world catching up? Global Convergence and National Rising Dispersion. The World Bank Policy Research Working Papers No. 4733. Development Economics Prospects Group, The World Bank, Washington, DC
- Davis , J and Huston , J . 1992 . The shrinking middle-income class: A multivariate analysis . Eastern Economic Journal , 18 ( 3 ) : 277 – 85 .
- Easterly , W . 2001 . The middle class consensus and economic development . Journal of Economic Growth , 6 : 317 – 35 . (doi:10.1023/A:1012786330095)
- Easterly , W . 2007 . Inequality does cause underdevelopment: Insights from a new instrument . Journal of Development Economics , 84 : 755 – 76 . (doi:10.1016/j.jdeveco.2006.11.002)
- Galor , O and Zeira , J . 1993 . Income distribution and macroeconomics . Review of Economic Studies , 60 35– (doi:10.2307/2297811)
- Hoogeveen , J and Özler , B . 2006 . “ Not separate, not equal: Poverty and inequality in post-apartheid South Africa ” . In Poverty and Policy in Post-Apartheid South Africa , Edited by: Bhorat , H and Kanbur , R . Cape Town : HSRC Press .
- Horrigan , M and Haugen , S . 1988 . The declining middle class thesis: A sensitivity analysis . Monthly Labor Review , 111 ( 5 ) : 3 – 13 .
- Kharas , H and Gertz , G . 2010 . “ The new global middle class: A cross-over from west to east ” . In China's Emerging Middle Class: Beyond Economic Transformation , Edited by: Li , C . Washington , DC : Brookings Institute Press .
- Landes , D . 1998 . The Wealth and Poverty of Nations Norton, New York
- Leibbrandt , M , Woolard , I , Finn , A and Argent , J . 2010 . Trends in South African income distribution and poverty since the fall of apartheid. Organisation for Economic Co-operation and Development Social, Employment and Migration Working Papers 101, OECD, Paris
- Milanovic , B and Yitzhaki , S . 2002 . Decomposing world income distribution: Does the world have a middle class? . Review of Income and Wealth , 48 ( 2 ) : 155 – 78 . (doi:10.1111/1475-4991.00046)
- Palma , J . 2011 . Homogeneous middles vs. heterogeneous tails, and the end of the ‘inverted-U’: It's all about the share of the rich . Development and Change , 42 ( 1 ) : 87 – 153 . (doi:10.1111/j.1467-7660.2011.01694.x)
- Perotti , R . 1996 . Growth, income distribution, and democracy: What the data say . Journal of Economic Growth , 1 : 149 – 88 . (doi:10.1007/BF00138861)
- Posel , D and Rogan , M . 2012 . Gendered trends in poverty in the post-apartheid period, 1995–2006 . Development Southern Africa , 29 ( 1 ) : 97 – 113 . (doi:10.1080/0376835X.2012.645645)
- Pressman , S . 2007 . The decline of the middle class: An international perspective . Journal of Economic Issues , 41 ( 1 ) : 181 – 200 .
- Ravallion , M . 2010 . The developing World's bulging (but vulnerable) middle class . World Development , 38 ( 4 ) : 445 – 54 . (doi:10.1016/j.worlddev.2009.11.007)
- Rivero , C , Du Toit , P and Kotze , H . 2003 . Tracking the development of the middle class in democratic South Africa . Politeia , 22 ( 3 ) : 6 – 29 .
- Schlemmer , L . 2005 . Lost in transformation? South Africa's emerging middle class. Centre for Development and Enterprise Focus Papers 8, Centre for Development and Enterprise, Johannesburg
- Sokoloff , K L and Engerman , SL . 2000 . Institutions, factor endowments, and path of development in the new world . Journal of Economic Perspectives , 14 ( 3 ) : 217 – 32 . (doi:10.1257/jep.14.3.217)
- StatsSA (Statistics South Africa), 2009. Profiling South Africa middle class households, 1998–2006. Statistics South Africa Report 03-03-01, Statistics South Africa, Pretoria.
- Thurow , L . 1987 . A surge in inequality . Scientific American , 256 : 30 – 7 . (doi:10.1038/scientificamerican0587-30)
- Udjo , E O . 2008 . The demographics of the emerging black middle class in South Africa. University of South Africa Bureau of Market Research Reports Paper 375, Bureau of Market Research, Pretoria
- Van der Berg , S . 2010 . “ The demographic and spatial distribution of inequality ” . In Poverty and Inequality: Facts, Trends and Hard Choices. Centre for Development and Enterprise Round Table Paper Number 15 , Edited by: Bernstein , A . Johannesburg : Centre for Development and Enterprise .
- Wilson , D and Dragusanu , R . 2008 . “ The expanding middle class: The exploding world middle class and falling global inequality ” . In Goldman Sachs Economic Research Global Economics Papers Issue 170 , New York : Goldman Sachs .