
Abstract
Migration, important for many areas in development, is strongly related to employment. Debate over labour supply in developing countries frequently hinges on labour migration. This paper examines the determinants of spatial mobility of working-age adults in South Africa, using the first nationally representative longitudinal survey – the National Income Dynamics Study – for 2008–10. The paper outlines the unique advantages of these data for the study of individual mobility – data that open the possibility of a new research project. Specifically, it asks how policy-relevant programmes, such as social transfers and housing assistance, affect migration. This paper finds, on balance, that transfers are negatively correlated with subsequent relocation. Previous migration is also predictive of future migration and both are tightly related to attrition, while there is an increasing but strongly non-linear relationship between income and mobility. Further, we highlight potential pitfalls – including attrition, and definitional difficulties – in the study of migration and illustrate possible solutions.
1. Introduction
Why do people migrate, often over vast distances, within developing countries? Mass rural-to-urban migration, today prevalent in the modern world, is associated with rapid socio-economic growth and political change. Migration has been shown to be linked to poverty reduction, employment, and wealth creation (Adams & Page, Citation2005; Adams Citation2011). It has been used frequently in poor rural households as a means of diversifying income, reducing risk, increasing child health, and escaping rural underemployment (Stark & Bloom, Citation1985; Hildebrandt & McKenzie, Citation2005; Posel & Casale, Citation2006; Ardington et al., Citation2009).
South Africa is a country with vastly differing rates of regional development – a legacy inherited from its apartheid history of separate development based on race. Yet we know very little about what makes people move across the country or the effect of government policies on such relocations: even when migration is fundamental to the re-integration of South African society. Given this history of restricted mobility, together with the current context of extremely high unemployment, inequality, and targeted social welfare, the importance of an improved understanding of migration and its policy-drivers is critical.
Past economics literature that focuses on the association between South Africa's social transfers (in particular the non-contributory Old Age Pension) and labour supply has suggested that whether the pension's effect is positive or negative hinges on its relation to labour migration – an area that remains unsettled. Preliminary evidence from new data suggests that relocation is related to gains in, and maintenance of, employment. This is a ‘fertile area for investigation’ (Woolard & Leibbrandt, 2012; Finn et al., 2012), yet according to one migration economist, in South Africa migration is a highly neglected research area (Posel, Citation2010).
Until the National Income Dynamics Study (NIDS) there had been no nationally representative and longitudinal study of mobility in South Africa that used high-quality individual-level panel data. Recently, NIDS released its second wave, which tracked individuals as they relocated across the country – thereby allowing researchers to examine a range of outcomes and determinants not previously possible. This study exploits these rich data for the first time to look at trends in, and determinants of, spatial mobility focusing primarily on African adults. Additionally, NIDS allows comparisons of migration to be drawn using a variety of definitions to better elucidate the trends and patterns of overall migration in South Africa. While the paper does not seek to uncover causal relations, it lays the groundwork for future study of migration, including its relation to social transfers and labour supply.
The paper proceeds as follows. Section 2 discusses related literature. Section 3 describes the data, definitions, sample selection, and the empirical strategy. In Section 4 descriptive characteristics and comparisons of migration in origin locations are presented. Section 5 presents estimates of the baseline determinants of migration. Section 6 provides a summary of results and concludes.
2. Related literature
2.1 International evidence
Migration is closely linked with the effective functioning of labour markets. The movement of labour to where it is most required and its returns are highest is essential to the efficient functioning of modern capitalist economies (Lucas, Citation2006; Fields, Citation2007). It is therefore unsurprising that a large number of theoretical and empirical studies suggest that the primary motivation for migration is employment and wages (for Africa, see an excellent review by Lucas, Citation2006). The international literature is consistent with this, as are studies of developing countries (Harris & Todaro, Citation1970; Borjas, Citation1992; Grogger & Hanson, Citation2011; Mishra, Citation2007; Carletto et al., Citation2011).
2.2 Evidence from South Africa
There has been very little research on general migration in South Africa (Posel, Citation2010). The 2001/02 South African Migration Survey of 3618 individuals nationally indicates that the primary reasons for migration are, firstly, employment related and, secondly, housing and education (Collinson et al., Citation2006; Posel & Casale, Citation2006; Collinson, Citation2007). The survey also provides evidence that the migration of women is often not directly employment oriented and is often related to marriage, social ties or co-movement. Overall, internal mobility has risen in the post-apartheid period – particularly movement to, and within, urban centres –but there has also been significant circular migration within rural areas and between rural and urban regions (Collinson et al., Citation2006; Posel & Casale, Citation2006; Collinson, Citation2007).
While migration has been under-researched, there is an extensive literature on the effects of South Africa's social transfers on employment, as well as both labour supply and, relatedly, labour migration. Specific attention has been given to the Old Age Pension, hereafter referred to as ‘the pension’: an unconditional, means-tested, transfer – of considerable value at 1.75 median African income with high penetration rates – to adults aged over 60. It has well-documented antipoverty impacts. The labour supply effects of the pension rest on how it affects migration behaviour of non-eligible co-resident adults: relaxing credit constraints and funding the labour migration of co-resident non-recipients or via pure income effects, thus allowing lower household labour supply and associated labour migration (Posel et al., Citation2006; Ardington et al., Citation2009). This literature highlights the difficulty of uncovering the causal role of the pension: whether the pension has a positive or negative effect on overall labour supply remains unknown. Sienaert (Citation2008) notes this will only be settled with individual-level panel data – now possible with the availability of NIDS.
3. Data, definitions and sample selection
3.1 The advantages of the National Income Dynamics Study for the study of migration
The NIDS is South Africa's first nationally representative individual-level longitudinal study (SALDRU, 2012). Existing data are either cross-sectional in nature, household-level, or longitudinal, limited to both small geographic regions and to basic demographic and socio-economic characteristics. In contrast, NIDS contains detailed data on income, education, employment and other factors likely to influence individual mobility decisions.Footnote3 Wave 1 was conducted in 2008 and surveyed approximately 7300 households and 28 247 individuals. Wave 2 was carried out in 2010/11 and the same individuals were tracked across the country and re-interviewed. Hereafter we refer to Wave 1 from 2008 as W1 and Wave 2 from 2010/11 as W2. Furthermore, NIDS collects information on non-resident household members as well as reasons for absence, thus making it possible to identify non-resident labour migrants.
Given that migration is an inherently longitudinal phenomenon, NIDS's biggest advantage is its longitudinal nature. Woolard & Leibbrandt (Citation2006) provide a review of the usefulness of longitudinal data. Having data on migration decisions, individual characteristics and how these change over time allow one to get closer to a causal explanation for both why people migrate and what outcomes are affected (Posel & Casale, Citation2006; Woolard & Leibbrandt, Citation2006). In seminal work that helped develop the standard economic models of migration, Borjas (Citation1987) argues that a single cross-section is wholly inadequate for the study of migration. Further benefits of NIDS include unique expectations and preference data on the likelihood of migration as well as retrospective migration information.
3.2 Migrant definitions
NIDS is a panel of individuals, which means all household residents who were questioned in W1 were tracked and re-questioned where possible in W2. Residency in NIDS is defined by presence in the household for at least four nights per week. In keeping with the complexity of living arrangements in South Africa, household membership is defined to include individuals spending more than 15 days per year at the household and sharing food and resources (SALDRU, 2012). Only limited information on non-residents is collected and these individuals do not have full questionnaires. The main focus in this paper will therefore be determining which individuals, resident in W1, subsequently move between W1 and W2.
depicts the definitions of migration used in this paper where the size of the balloon is proportional to the number of migrants. Migrants and retrospective migrants intersect to represent the fact that many migrants were previously retrospective migrants. Migrants and retrospective migrants have full questionnaires and form part of the NIDS panel. Absent labour migrants do not.
Figure 1: Migrant definitions and household residency
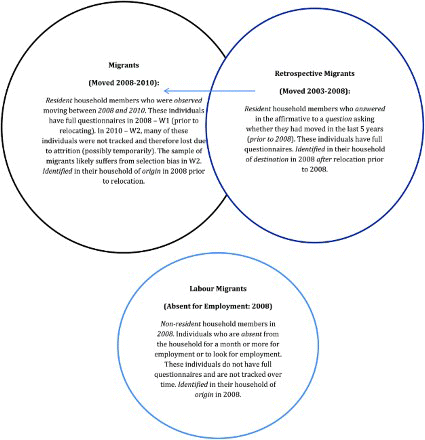
Migrants, or spatial movers, are defined throughout in a broad way, as individuals who were observed relocating between W1 and W2.Footnote4 One caveat in this definition is that, as location data are not released for reasons of anonymity, it is impossible to determine how far individuals moved and therefore to distinguish residential mobility – movement within suburbs – from more significant spatial mobility without utilising W2 data on migrants. It should be noted that of the much reduced W2 sample of movers not lost to attrition, we find a substantial majority moved across at least one district, urban–rural, or provincial line. These individuals can be considered ‘true migrants’. However, attrition bias aside, it is not clear that a definition which is restricted to such movements is more useful. Districts are largely accidental: some are large while others are only centred on a particular city – such as the metropolitan districts of large cities. Ideally a variable ‘distance-moved’ would be available to see whether the results are robust to different distances. However, the determinants we uncover are not overly sensitive to the definition of migration. It should be clear from the above that when we refer to a migrant, this definition incorporates all forms of spatial mobility within South Africa's borders.
This outcome is largely free of measurement error, well defined, and physically observed by survey teams. It does not rely on retrospective questions, or on the subjective and changing perceptions of who is or is not considered to be absent but still part of the household –which defines labour migration in the South Africa literature (Posel & Casale, Citation2003, Citation2006; Posel et al., Citation2006; Sienaert, Citation2008; Ardington et al., Citation2009; Ranchhod, Citation2010b).
The focus, therefore, is not on labour migration per se but on ‘general migration’ (Posel, Citation2010). Migrants, according to our definition, may have migrated for employment reasons and even be employed; however, to be consistent with prior research we define labour migrants as non-resident individuals absent from the household for at least one month per year to work or look for work (Posel, Citation2010).
Following Posel (Citation2010), retrospective migrantsFootnote5 are defined as those individuals who answered a retrospective question that asked when they moved to this location. The question emphasises a change of ‘place and not residence within a suburb or city’. This is restricted to moves in the five years prior to W1 in 2008. Retrospective migrant is an incredibly useful outcome as it is a measure of previous migration, and therefore migrant networks, strength-of-ties, attitude-to-risk, and a ‘taste’ for migration including a host of unobservable variables on which migrants were selected (McKenzie & Rapoport, Citation2007; Gibson & McKenzie, Citation2011). Additionally, in some cases retrospective migration could be measuring the first movement in a circular migration pattern that has traditionally been a characteristic of migration in South Africa.
Most previous research on migration in South Africa focused on labour migration of household members who are or become non-resident. Yet, typically, information on migrant outcomes is captured by asking origin household residents about absent labour migrants determining subjectively whether an individual is considered ‘part of the household’. This is the first analysis, to our knowledge, which utilises a precise and narrow definition of household residency as a base from which to follow migrants. This measure which observes relocation and follows residents who answered full questionnaires over time is likely to be more accurate. Moreover, it is possible to determine outcomes: whether movers are employed or have left the labour force – something impossible to do in the case of ‘labour migrants’ as previously studied. Naturally this makes direct comparisons with estimates of labour migration in previous studies impossible. Nonetheless, the primary goal of this paper is to uncover the correlates of spatial mobility itself – not to analyse the subset of migration categorised as labour migration in previous work.
3.3 Sample selection
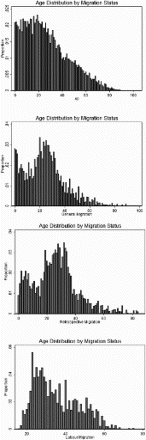
For most analyses the sample is restricted to black Africans. Africans comprise a large majority of the population, are disproportionately poor (and therefore the predominant target for state transfers), and, conditional on age eligibility, are very likely to receive a pension (Ardington et al., Citation2009; Ranchhod, Citation2010b). Given that the literature on labour migration and supply is focused on working-age African adults, we narrow the sample similarly to include only individuals between 18 and 56 years in W1. This ensures neither pension recipients nor children – who are unlikely to be a migration decision-maker – are captured, yet includes the important class of adults over 50 (Ranchhod, Citation2010b). The distribution of age by migration status is presented in . These distributions provide further justification for narrowing the sample in this way as only a very small proportion of individuals above the age of 60 migrate.
Figure 2: Age distribution by migrant status
3.4 Empirical strategy, migration and selective attrition
The empirical strategy used is motivated by panel attrition – when individuals are interviewed in W1 but not in W2, due to fieldwork error, death, non-contact or refusal. The majority of survey non-response in developing countries occurs through the inability to track individuals and households as they relocate (Maluccio, Citation2004). This is closely related to migrant self-selection, which is generally the key difficulty in migration research as the seminal work of Borjas (Citation1987) clearly demonstrated (Borjas, Citation1992; Chiquiar & Hanson, Citation2005). NIDS is no exception. Indeed, the main reason for attrition in NIDS is migration or change in residence and subsequent failure to locate that individual or household (SALDRU, 2012). Of the 4480 movers in NIDS, over one-half attrite between W1 and W2 (in W3, attrition is considerably reduced). These individuals do not drop out randomly; rather, there is selection on observable characteristics. Yet research has shown that this selective attrition need not result in bias depending on the particular structural relation under study – known as the neutrality of attrition (Baigrie & Eyal, Citation2012).
However, before research is conducted using the panel that includes outcomes related to mobility observed in W2, it is necessary to test for attrition bias in the particular specification being analysed. It is not clear that ignoring this problem and presenting results without correcting for both attrition and self-selection bias will tell us anything of value. Relatedly, even if attrition bias was not present, there remains the fundamental problem of selection bias. Movers or migrants will typically differ in many important and unobservable ways to non-migrants, making naïve comparisons of migrant and non-migrant outcomes, such as comparisons of W2 employment and wages, largely meaningless (McKenzie et al., Citation2006). (For example, because migrants are highly self-motivated they may have had more success at gaining employment even if they had chosen not to migrate.)
Our strategy, therefore, is to sidestep attrition bias entirely as well as self-selection related to W2 migrant outcomes such as employment, by focusing on W1 data only. The W2 outcome variable migrant, defined above, is merged into W1. This outcome is observed for all individuals including those lost to attrition for whatever reason in W2. We then estimate regressions of migration on characteristics from the full unbiased sample of W1 resident prime-age individuals. These individuals are the only ones that make up the potential migrant pool.
4. Comparative analysis of trends and characteristics of migration
This section presents descriptive statistics of households and individuals by migrant status and further makes comparisons between the typologies of migration. The estimates throughout are characteristics in 2008. They are the characteristics of migrants at origin prior to migration occurring, the characteristics at destination of retrospective migrants who migrated in the five years before 2008, and the origin household characteristics of labour migrants who migrated at some unknown previous date but are currently absent from the household. Throughout this section it is important to note that our primary interest is general migration. Therefore, variables are defined with this outcome in mind but are displayed for other migrant types for greater nuance and understanding where applicable.
presents densities of age by migration status. First, although a large number of children move, a definite decline in mobility can be seen for the ages 6 to 18, when children attend school. This is pertinent because of stability necessary for children attending school: evidence suggests that frequent changes of residence are detrimental to outcomes such as grade completion (Ginsburg et al., Citation2011). Second, there is a local maximum for young children not yet of school age. Third, the largest proportion of migrants (using all definitions) is aged 20 to 30. This declines rapidly for adults. Fourth, the distributions are remarkably similar for migrants and retrospective migrants, which, if we think of retrospective migration as a lagged outcome, is encouraging. There is a slightly heavier tail for migration, which could be because this measure is probably capturing some migrants who are of the labour migrant type, the distribution of which, unlike others, has a high proportion of migrants between the ages of 40 and 60.
describes the distribution of migration in South Africa. While panel A presents unweighted counts of migration, all subsequent estimates will be weighted. In Panel B we see that almost seven million Africans, 4.2 million of which are prime-aged, migrated during 2008–10. Over one-fifth of prime-aged Africans relocated in this period, suggesting substantial mobility in the post-apartheid African population. This matches evidence from other developing countries undergoing rapid socio-economic transformations (Maluccio, Citation2004; Ping & Shaohua, 2005; Lucas, Citation2006; Zenou, Citation2011). When one considers that this has taken place between 2008 and 2010 – the space of only two years – it is more startling. Interestingly the proportion of labour migrants in the African population is considerably lower, and, as Posel (Citation2010) has noted, substantially lower than in 1993.
Table 1: Distribution of African migration in South Africa in 2008
The majority of migrants of all types, 37%, 40%, and 37% respectively, are located in the Gauteng province – home to South Africa's richest urban centre, Johannesburg – while KwaZulu-Natal (KZN) province has the second highest proportion. In the case of retrospective migrants, Gauteng and KZN are the provinces relocated to, or within, in the five years up to 2008, while for labour and general migrants these are the provinces of origin. An especially high proportion of labour migrants (29%), relative to other migrant types, originate from the KZN province. Overall, the evidence presented is in accordance with the findings from census data in Rogan et al. (2009) that migration patterns differ markedly by province.
In and household and individual characteristics by migrant status are presented. Virtually all characteristics are statistically significantly different by migrant status for both labour and retrospective migrants. Moreover, they differ in the opposite way. For instance, retrospective migrants come from households with fewer resident members than non-migrant households – three as opposed to 3.83, respectively – whereas households that contain labour migrants have more resident members – 4.7 as opposed to 3.4. Given that retrospective migrant characteristics are measured in destination households, this is consistent with new findings from NIDS that moving involves household formations leading to smaller households (Grieger et al., Citation2013). Finally, retrospective migrants moved to, or within, provinces that had higher growth rates, and districts with higher income and rates of employment; while for labour migrants the reverse is true. This makes intuitive economic sense, both in terms of moving towards wealthier and higher employment regions, as well as migrants' being better off after relocating since retrospective migration represents destination outcomes while labour migrant households' give origin characteristics.
Table 2a: Household characteristics of prime-age African migrants and non-migrants
Table 2b: Individual characteristics of African prime-age migrants and non-migrants
The opposing characteristics of labour and retrospective migrants hold for all variables that are statistically different at the 5% level. In all there are 27 out of 39 characteristics that differ. This suggests stark disparities between these two groups of households and adds to the evidence, presented in , that labour migrants are qualitatively different from retrospective migrants, including at least a substantial fraction of migrants.
On the other hand, this contrasting relationship does not carry over as well when one compares migrants with labour migrants. Although migrants are indeed typically more similar to retrospective migrants, even though they represent origin characteristics and not destination ones as the latter do, not nearly as many factors are statistically different from non-migrants and some are closer to labour migrant households. For instance, migrants originate from larger households (3.8 members) – which more closely match labour migrant households. This could be explained by the fact that both are characteristics of origin households from which future migration occurs. Yet migrant origin households still match retrospective migrant destination households quite closely. Migration is thus probably bimodal, or at least substantially heterogeneous, making the task of finding robust determinants, as well as identifying the effect of policy relevant variables, all the more complex.
showed that labour migrants make up a substantially smaller share of prime-age Africans, and even though retrospective migration is meant to capture all considerable relocations in the past five years, this still only represents the same proportion of the population as migrants do (21%). Clearly our migrant category is overestimating ‘true’ migration because of the inclusion of residential mobility. However, given that retrospective migration does not seem to be capturing all labour migration, whereas migrant definitely includes all forms of migration, this could explain why the proportions of those migrating in a five-year period match those in a two-year period. It is also possible this could represent measurement error and recall bias in the retrospective question. Finally, this difference might reflect real increases in spatial mobility.
Turning to state transfers, evident from is that migrant households are not more or less likely to receive a pension. Yet migrant households do have significantly lower transfer income and fewer have received a government housing subsidy. The latter is intuitive, especially for cases where whole households are migrating, given that subsidies are frequently used to build new residences. Besides the negative association with the subsidy, consistent with recent research on the labour supply effects of housing assistance in the United States (Jacob & Ludwig, Citation2012), all other grants are not significantly associated with general migration. This is not the case for other migrants: labour migrant households are more likely to receive a pension – consistent with previous findings (Posel et al., Citation2006; Ardington et al., Citation2009) – as well as a Child Support GrantFootnote6 (CSG), including a housing subsidy. The opposite is true for retrospective migrants. This further illustrates the heterogeneity among migrants.
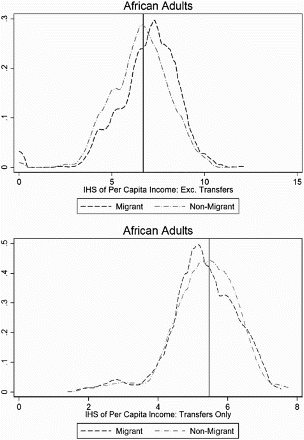
displays kernel densities of inverse hyperbolic sine (IHS) transformed income, excluding transfers as well as transfers only, by migrant status and is consistent with the results in , which show respectively that migrants have lower transfer income but higher non-transfer.Footnote7
Figure 3: Transfer and non-transfer income, by migrant status in 2008
To summarise important ways general migrant households differ from non-migrant households: migrant households are larger – as are labour migrant households; they have significantly more individuals aged 18 to 30; they contain more retrospective migrants; and they are less likely to be located in rural areas – like retrospective migrants but not labour migrants possibly. At the individual level: fewer migrants are females but the difference is small relative to labour migrants – a much lower proportion of which are female; they tend to be younger – similar to retrospective migrants yet unlike labour migrants; they have lower body mass index measures;Footnote8 more stated they are likely to migrate in the future; a very large proportion (40%) had already moved at least once in the five years prior to 2008, which could reflect the initial movement prior to return migration; they have significantly more years of education – as do retrospective migrants; and unlike both retrospective and labour migrants there is no statistically significant difference in employment between migrants' origin households and non-migrant households. Last, note the significant difference in attrition behaviour: roughly one-half of migrants attrited compared with just 16% for non-migrants.Footnote9
5. The determinants of migration
Throughout this section, linear probability models are estimated, which aid in comparability between other similar studies. These models relate the W2 outcome migrant to W1 factors that affect migration.
The regressions take the following form:
For individual i, in household h, in wave t, where the outcome is migrant status, if the individual migrated between W1 and W2, = 0 otherwise.
is a matrix of characteristics that probably determine migration.
5.1 What factors best predict future migration?
Expectations data are beginning to be used more frequently in the estimation of choice-models in empirical microeconomics (e.g. McKenzie et al., Citation2012; Van der Klaauw, Citation2012). We demonstrate that individual expectations data, unique in South Africa to NIDS, allows one to more accurately specify a predictive migration model with which it is possible to more precisely forecast migration – and therefore attrition. Past migration is even more strongly predictive of subsequent mobility between W1 and W2.
presents the coefficients on these variables while omitting a full set of controls. Retrospective migration is associated with a 20 percentage point higher probability of migration, holding all else constant, while expectations are also predictive of migration. Adding a full set of controls reduces the size of the coefficients, but they remain robust predictors.
Table 3: Predicting migration from baseline in 2008
McKenzie & Rapoport (Citation2007) argue that past migration can be a measure of the ‘cost’ of migration whereby potential and previous migrants face reduced costs because of established migrant networks. Previous migrants probably have a ‘taste’ for migration, a more risk-seeking outlook, and better connections, among other characteristics, which led to their migration. For example, Gibson & McKenzie (Citation2011), find that standard attitude-to-risk measures are positively associated with international migration.Footnote10 The variables on which migrants are selected are plausibly still present, thus raising the likelihood of further relocations contributing to the predictive power of previous migration on future migration in NIDS. Given South Africa's history of temporary migration, much of this may be return migration – retrospective migrants may migrate back to their previous residence.Footnote11 Further analysis of this relationship, particularly using the dynamics of the full NIDS panel, is a fruitful topic for future research but is beyond the scope of this paper.
In the next section we exclude the expectations and retrospective migration variables from our regressions. Given that we are primarily interested in the determinants of the migration choice, the difficulty in including these variables is that: first, while the expectations data are good predictors of future behaviour, they do not tell us why an individual migrates; and second, retrospective migration may be considered roughly analogous to a lagged dependent variable, and thus if included will probably absorb the significance of other determinants (Achen, Citation2001). One should note that these are some of the strongest and most robust predictors of migration.
5.2 What factors are associated with the choice of migration?
The literature suggests a non-linear relationship between migration and income (McKenzie & Rapoport, Citation2007; Gibson & McKenzie, Citation2011). At low levels of income, individuals and households cannot finance migration costs; and at higher levels, no strong incentive to relocate exists. To capture this, quadratic and cubic forms of income are included.Footnote12 These fit the data well. In Sections 2.1 and 2.2 we saw that wages and employment were the primary motivations for migration. We therefore include wages, as well as a dummy for the lack of employment in 2008. Various measures of a wage gap across source locations were generally insignificant.
All regressions include a quartic in age, which, as in the literature, we find to capture the non-linearity of the age–migration relationship as illustrated in (Posel et al., Citation2006; Ardington et al., Citation2009). Presented in are those coefficients of particular interest for the full sample, for Africans, and for South Arica's other main population groups, included here for the sake of interest. These results are by construction immune from attrition bias. Additional controls include gender, household size, province dummies, and, in the first three columns, race dummies.Footnote13 Gender is insignificant in all specifications. Not shown but included are the education categories completion of high school and any post-secondary schooling. These are insignificant. In all regressions, age is highly significant and the likelihood of migration rises sharply initially before declining. As found in the descriptive section, the presence of school-age children – seven to 17 years inclusive – has a robustly negative association with migration. The presence of such children reduces the likelihood of relocation, on average, by approximately 10 percentage points.
Table 4: Determinants of migration for adults aged 18 to 56 at baseline in 2008
A higher wage is correlated with an increased probability of migration for both the full and African samples. Further, the effect is seen for men but not women, which is in accordance with the qualitative data from SAMS (South African Migration Survey) (see Section 2.2) that show women frequently migrate for reasons other than employment. However, lack of employment is a significant determinant of migration for African women who are six percentage points more likely to migrate by W2 if they were not employed in W1. The findings are consistent with the above and with migration as a search for work and preliminary panel findings produced by NIDS that indicate migrants are more likely to obtain, and maintain, employment than non-migrants (Grieger et al., Citation2013). As the literature would suggest, we find evidence of an inverse-U relation in the full sample. In general, however, migration is increasing with income in a non-linear fashion. These results are the first we are aware of for South Africa, which test models that predict a non-linear migrant–income relationship, as well as the importance of wages.
Residence in a rural area is associated with a roughly three to four percentage point and five to six percentage point lower probability of migration on average. These results are similar but not directly comparable with standard ones for employment and labour-force participation in South Africa (see for instance Ranchhod, Citation2010a).
As can be seen in the bottom panel of , state transfers are universally indicative of a lower probability of migration of resident prime-age adults. The CSG is only significant in the full sample, however, and is more probably an indicator of low socio-economic status. Household pension receipt is negatively associated with migration. Holding all else constant, residing in a household that receives a pension reduces the probability of future migration for prime-age adults by 3% for the full African sample. For males and females separately the coefficients are not significantly different from zero, and while the magnitude declines somewhat, the sign remains unchanged. In regressions that restrict outcomes to young adults aged 18 to 35, not reported, as well as those that ignoring selective attrition use the narrower migrant definition, this relationship is stronger. This does not imply causality, however. For instance, it could be that the presence of older adults in the household – rather than pension income itself – a group significantly less likely to migrate, results in co-residents not migrating. Moreover, households that receive the pension are poor, and poorer households are less likely to be spatially mobile.
These findings, while not especially robust nor directly comparable, are in contrast to the positive association between pensions and female labour migration found in Posel & Casale (Citation2003), Posel et al. (Citation2006) using 1993 Project for Statistics on Living Standards and Development cross-sectional data, and Ardington et al.'s (2009) longitudinal estimates from rural KZN. They are more in line with the panel results in Ranchhod (Citation2010b) and Sienaert (Citation2008) that find both a negative effect on employment and participation for resident prime-age individuals as well as the well-known negative cross-sectional relation results (Bertrand et al., Citation2003; Ranchhod, Citation2010a). A control for the presence of older adults not yet age eligible is insignificant – pointing to the fact that the association is not driven by the presence of older adults alone. Bear in mind our estimates are stronger than ones based on a strict cross-section, such as Posel et al. (Citation2006), which also do not control for the vital group of older adults not yet age eligible for the social pension, as we predict future migration from baseline characteristics. Nevertheless they are considerably weaker than an estimate that made effective use of the dynamic panel and dealt with various forms of selection bias. This is an area worth studying further.
The most robust finding is that receipt of state housing assistance is negatively associated with future migration – ranging from a low of five percentage point reduction in migration for African women, to a high of 13 percentage points for men. This result is intuitive and also consistent with recent findings in the United States that housing assistance reduces labour supply – although our results do not imply lower labour supply (Jacob & Ludwig, Citation2012). However, it should be noted that, more so than other state transfers considered, the effect of the housing subsidy is probably subject to considerable selection bias. For example, those most likely to migrate in future may also choose not to invest in fixed property.Footnote14
Estimates are presented in of the determinants of migration for prime-age Africans divided into three income terciles. Interesting dynamics are present and it is clear that the determinants differ by income. Households that receive the pension are still less likely to migrate, but this effect is only significant for those in the middle of the African income distribution – although it is marginally significant for men in the upper group. The indicator for the presence of individuals aged 52 to 56 is also negative, although mostly not statistically different from zero. Neither of these factors is significantly associated with migration of prime-age Africans in the poorest group, where the coefficients are small, positive, but highly insignificant. However, it is unlikely that the bottom tercile receives significant transfer income (Woolard & Leibbrandt, Citation2010).
Table 5: Determinants of migration by income tercile for Africans aged 18-56 in 2008
The housing subsidy is again significant and negative but only for men in the top two terciles. Interestingly, the CSG has a strong negative effect on migration for men in the high group. Furthermore, the driving force behind the negative association between rural residence and migration comes only from the top third of the distribution. Last, wages for men, and lack of employment for women, are only significant in the top two terciles.
6. Discussion and conclusion
The relationship between migration and development, and employment in particular, is an essential one to understand. This is especially so in South Africa, a country with some of the highest current unemployment and inequality in the world. South Africa has the most modern and developed urban centres on the continent; yet former non-white regions are very poor, and the country has a history of tightly restricted movement. Yet we know very little about what makes people move across the country and the effect of government policies on such relocations. Furthermore, understanding migration is crucial to understanding the labour supply effects of social transfers. Using the first national individual-level longitudinal study, we analyse determinants of migration in South Africa. In this descriptive paper we outline the unique benefits of these data for the study of spatial mobility and labour migration, highlight the two primary challenges in studying migration, selection and attrition bias, and lay a foundation for further research.
We find the CSG, and to a greater extent the pension, to be negatively associated with migration of co-resident non-eligible adults controlling for children and adults not yet eligible for the pension. The context is important to note, including the well-known positive contributions that state transfers have on the poorest individuals and low labour demand.
Residence in a rural region and receipt of a housing subsidy are both strongly associated with not moving. The effect of baseline income is non-linear, but mobility is generally increasing with income at a declining rate leading to an approximate inverse-U-shape relation consistent with research from Mexico. Previous migration is also strongly predictive of future migration and both are tightly related to attrition, as is subjective expectations of relocation. Moving is strongly age related, and adults aged 18 to 30 are the most likely group to migrate, while the presence of school-age children markedly reduces the likelihood of migration, but younger children raise it.
Uncovering the correlates of the migration choice is not an easy task, as the decision to migrate is an ‘extremely complex combination of microeconomic and social motivations’ (Mansoor & Quillin, Citation2006:75). There are very few factors that are robustly associated with migration for all age groups, genders, income groups, and regions. It is also conceivable that the Global Recession and the resulting major economic dislocation had profound implications for migration, given the period of this study. These would probably be temporary in nature, providing caution in drawing too strong a conclusion from results presented here.
In this paper we uncover the baseline predictors of future migration. We stress that none of the characteristics found to be related to migration should be interpreted in a causal fashion. Nevertheless, prediction is a first step, and any research that analyses the causal role of particular determinants of migration or labour supply would benefit from due cognisance of the determinants presented here. To obtain a clearer picture of causal relationships, a theoretically motivated and empirically grounded identification strategy using the full dynamics of the balanced panel should be used – with careful attention paid to the presence of attrition and selection bias. This area is a fruitful area for future research.
Acknowledgements
The authors would like to thank four anonymous referees, the editor, James Clarke, Ingrid Woolard, Sharon Campbell, and Ni Baigrie. Grateful acknowledgement of financial assistance and support is made to NIDS, the National Research Foundation, the John Davidson Educational Trust, the Sheila Van Der Horst Trust, the University of Cape Town, and the Claude Leon Foundation. Opinions expressed and conclusions arrived at are those of the authors and are not necessarily attributed to any of the above sources of funding. All remaining errors are the authors' own.
Notes
3An in-depth examination of data available in Appendix A shows NIDS is a significant milestone.
4Variable name, w2_mover: a NIDS panel member is a ‘mover’ if that individual resides in W2 at a location more than 100 m from their original location in W1 (SALDRU, 2012). Or they are no longer in their original location and survey teams were unable to track these individuals.
5Posel (Citation2010) calls this ‘General Migration’.
6The CSG is a means-tested unconditional cash transfer to eligible female caregivers of children under 18. A large number of low-income African households receive the CSG.
7IHS is the inverse-hyperbolic sine transformation which is roughly equivalent to a logarithmic transformation except it is defined at 0 (Burbridge et al., 1988).
8Body mass index is a proxy for well-being (Wittenberg, Citation2011), although here probably driven by age.
9For whites it is 66%, another reason to exclude this group.
10NIDS does not include such questions.
11Thanks to anonymous referees for comments on return migration and selected variables still operating.
12IHS-transformed per-capita income excluding transfers.
13Whites are most likely to migrate.
14Thanks to an anonymous referee for raising this example.
References
- Achen, CH, 2001. Why lagged dependent variables can suppress the explanatory power of other independent variables. Paper prepared for the Annual Meeting of the Political Methodology Section of the American Political Science Association. http://www.princeton.edu/csdp/events/Achen121201/achen.pdf Accessed 5 May 2012.
- Adams, R, 2011. Evaluating the economic impact of international remittances on developing countries using household surveys: A literature review. The Journal of Development Studies 47(6), 809–28. doi: 10.1080/00220388.2011.563299
- Adams, R Jr & Page, J, 2005. Do international migration and remittances reduce poverty in developing countries? World Development 33(10), 1645–69. doi: 10.1016/j.worlddev.2005.05.004
- Ardington, C, Case, A & Hosegood, V, 2009. Labor supply responses to large social transfers: Longitudinal evidence from South Africa. American Economic Journal: Applied Economics 1(1), 22–48. doi: 10.1257/app.1.1.22
- Baigrie, N & Eyal, K, 2012. An evaluation of the determinants and implications of panel attrition in the National Income Dynamics Survey (2008–10). South African Journal of Economics, forthcoming.
- Bertrand, M, Mullainathan, S & Miller, D, 2003. Public policy and extended families: Evidence from pensions in South Africa. The World Bank Economic Review 17(1), 27–50. doi: 10.1093/wber/lhg014
- Borjas, GJ, 1987. Self-selection and the earnings of immigrants. American Economic Review 77(4), 531–53.
- Borjas, G, 1992. Self-selection and internal migration in the United States. Journal of Urban Economics 32, 159–85. doi: 10.1016/0094-1190(92)90003-4
- Burbidge, J, Magee, L & Robb, L, 1988. Alternative transformations to handle extreme values of the dependent variable. Journal of the American Statistical Association 83, 123–27.
- Carletto, C, Covarrubias, K & Maluccio, JA, 2011. Migration and child growth on rural Guatemala. Food Policy 36(1), 16–27.
- Chiquiar, D & Hanson, G, 2005. International migration, self-selection, and the distribution of wages. Evidence from Mexico and US. Journal of Political Economy 113(2), 239–81.
- Collinson, M, 2007. Migration, settlement change and health in post-apartheid South Africa: Triangulating health and demographic surveillance with national census data. Scandinavian Journal of Public Health Supplement 69, 77–84. doi: 10.1080/14034950701356401
- Collinson, M, Kok, P & Ganenne, M, 2006. Migration and changing settlement patterns. Multilevel data for policy. Report 03-04-01, Statistics South Africa, Pretoria.
- Duflo, E, 2003. Grandmothers and granddaughters: Old-age pensions and intra-household allocation in South Africa. World Bank Economic Review 17(1), 1–25. doi: 10.1093/wber/lhg013
- Fields, GS, 2007. The Harris–Todaro model. Discussion Paper, Department of Economics, Cornell.
- Finn, A, Leibbrandt, M & Levinsohn, J, 2012. Income Mobility in South Africa: Evidence from the First Two Waves of the National Income Dynamics Study. SALDRU Working Paper Number 82/NIDS Discussion Paper 2012/5SALDRU, University of Cape Town, Cape Town.
- Gibson, J & McKenzie, D, 2011. The microeconomic determinants of emigration and return migration of the best and brightest: Evidence from the Pacific. Journal of Development Economics 95(1), 18–29. doi: 10.1016/j.jdeveco.2009.11.002
- Ginsburg, C, et al., 2011. An analysis of associations between residential and school mobility and educational outcomes in South African urban children: The Birth to Twenty cohort. International Journal of Educational Development 31(3), 213–22. doi: 10.1016/j.ijedudev.2010.03.006
- Grieger, L, Williamson, A, Leibbrandt, M & Levinsohn, J, 2013. Moving out and moving in: Evidence of short-term household change in South Africa from the National Income Dynamics Study. A Southern Africa Labour and Development Research Unit Working Paper Number 106, SALDRU, University of Cape Town, Cape Town.
- Grogger, J & Hanson, GH, 2011. Income maximization and the selection and sorting of international migrants. Journal of Development Economics 95(1), 42–57. doi: 10.1016/j.jdeveco.2010.06.003
- Harris, J & Todaro, M, 1970. Migration, unemployment and development: A two-sector analysis. The American Economic Review 60(1), 126–42.
- Hildebrandt, N & McKenzie, DJ, 2005. The effects of migration on child health in Mexico. Economía 6(1), 257–28.
- Jacob, B & Ludwig, J, 2012. The effects of housing assistance on labor supply: Evidence from a voucher lottery. American Economic Review 102(1), 272–304. doi: 10.1257/aer.102.1.272
- Lucas, REB, 2006. Migration and economic development in Africa: A review of evidence. Journal of African Economies 15, 337–95.
- Maluccio, 2004. Using quality of interview information to assess nonrandom attrition bias in developing-country panel data. Journal of Human Resources 8(1), 91–109.
- Mansoor, A & Quillin, B, 2006. Migration and Remittances: Eastern Europe and the Former Soviet Union (Europe and Central Asia Reports). World Bank Publications, Washington, DC. http://siteresources.worldbank.org/INTECA/Resources/257896-1167856389505/Migration_FullReport.pdf Accessed 5 May 2012.
- Mckenzie, D & Rapoport, H, 2007. Network effects and the dynamics of migration and inequality: Theory and evidence from Mexico. Journal of Development Economics 84(1), 1–24. doi: 10.1016/j.jdeveco.2006.11.003
- McKenzie, D, Gibson, J & Stillman, S, 2006. How important is selection? Experimental vs. non-experimental measures of the income gains from migration. Policy Research Working Paper No. 3906, The World Bank, Washington, DC.
- McKenzie, D, Gibson, J & Stillman, S, 2012. A land of milk and honey with streets paved with gold: Do emigrants have over-optimistic expectations about incomes abroad? Journal of Development Economics 102, 116–27.
- Mishra, P, 2007. Emigration and wages in source countries: Evidence from Mexico. Journal of Development Economics 82(1), 180–99. doi: 10.1016/j.jdeveco.2005.09.002
- Posel, D, 2010. Households and labour migration in post-Apartheid South Africa. Journal of Studies in Economics and Econometrics 34(3), 129–41.
- Posel, D & Casale, D, 2003. What has been happening to internal labour migration in South Africa 1993–1999. South African Journal of Economics 71(3), 455–79.
- Posel, D & Casale, D, 2006. Migration and remittances in South Africa. NIDS background document on migration and first set of draft questions for inclusion in the National Income Dynamics Study. http://www.nids.uct.ac.za/publications/background-papers/117-migration-and-remittances-in-south-africa/file Accessed 5 May 2012.
- Posel, D, Fairburn, J & Lund, F, 2006. Labour migration and households: A re-consideration of the effects of the social pension on labour supply in South Africa. Economic Modelling, September 23(5), 836–53. doi: 10.1016/j.econmod.2005.10.010
- Ranchhod, V, 2010a. Labour force participation and employment in South Africa: Evidence from Wave 1 of the National Income Dynamics Study. Journal of Studies in Economics and Econometrics 34(3), 111–27.
- Ranchhod, V, 2010b. Household responses to adverse income shocks: Pensioner out-migration and mortality in South Africa. Working Paper, University of Cape Town, Cape Town.
- Rogan, N, Lebani, L & Nzimande, M, 2006. Internal migration and poverty in KwaZulu-Natal: Findings from censuses, labour force surveys and panel data. SALDRU Working Paper Series Number 30. http://www.saldru.uct.ac.za/home/index.php?/component/option,com_docman/Itemid,123/gid,258/task,doc_download/ Accessed 5 May 2012.
- SALDRU (Southern Africa Labour and Development Research Unit), 2012. National Income Dynamics Study Wave 2 User Manual, Southern Africa Labour and Development Research Unit, Cape Town.
- Sienaert, A, 2008. The labour supply effects of the South African state old age pension theory, evidence and implications. SALDRU Working Paper Series Number 20, University of Cape Town, Cape Town.
- Stark, O & Bloom, DE, 1985. The new economics of labour migration. American Economic Review 75(2), 173–8.
- Van der Klaauw, W, 2012. On the use of expectations data in estimating structural dynamic choice models. Journal of Labor Economics. 30(3), 521–54. doi: 10.1086/664929
- Wittenberg, M, 2011. The weight of success: The body mass index and economic well-being in South Africa. Southern Africa Labour and Development Research Unit Working Paper Number 65, University of Cape Town, Cape Town.
- Woolard, I & Leibbrandt, M, 2006. Planning for the South African National Income Dynamics Study (NIDS): Lessons from the international experience. Report produced for the Presidency and the Joint Economic AIDS and Poverty Programme (JEAPP), February.
- Woolard, I & Leibbrandt, M, 2010. The evolution and impact of unconditional cash transfers in South Africa. Southern Africa Labour and Development Research Unit Working Paper Number 51, University of Cape Town, Cape Town.
- Woolard, I & Leibbrandt, M, eds, 2012. National Income Dynamics Study: Wave 2 Overview. http://www.nids.uct.ac.za/documents/wave-2-documents-and-questionnaires/123-nids-wave-2-overview-document/file
- Zenou, Y, 2011. Search, migration, and urban land use: The case of transportation policies. Journal of Development Economics 96(2), 174–87. doi: 10.1016/j.jdeveco.2010.11.001
- Wave 1 data: National Income Dynamics Study 2008, Wave 1 (dataset). Version 4.1. Southern Africa Labour and Development Research Unit (producer), Cape Town, 2012. DataFirst (distributor), Cape Town, 2012. http://www.datafirst.uct.ac.za/catalogue3/index.php/catalog/428
- Wave 2 data: National Income Dynamics Study 2010–11, Wave 2 (dataset). Version 1.0. Southern Africa Labour and Development Research Unit (producer), Cape Town, 2012. DataFirst (distributor), Cape Town, 2012. http://www.datafirst.uct.ac.za/catalogue3/index.php/catalog/429
Appendix A
A1. Previous data
Until recently South Africa had a paucity of nationally representative data with detailed and consistent information on migration and its link to outcomes and determinants such as income, employment, wages, schooling, transfers, and geographical location (Posel & Casale, Citation2006). Most national surveys do not collect and identify information on non-resident household members (Posel, Citation2010). The only survey that does collect this information at a national level is the 1993 Project for Statistics on Living Standards and Development (PSLSD). The PSLSD provides the first window into the life of Africans in South Africa since during apartheid no data were collected for this population group. The PSLSD was, however, only cross-sectional. These data have been extensively used and vetted for the study of labour migration and for other topics (Bertrand et al., Citation2003; Duflo, Citation2003; Posel et al., Citation2006).
While the KwaZulu-Natal Income Dynamics Study (KIDS) is an offshoot of the PSLSD, it does not include the relevant information on non-residents (Posel & Casale, Citation2006). The only other potentially useful panel survey is the Cape Area Panel Survey (CAPS) and this does not include questions on labour migration (Posel & Casale, Citation2006).
Finally, there are the Agincourt DSS and the KZN DSA, which are longitudinal demographic and health surveys of two poor rural regions. These surveys have the advantage that they are panel data which record non-resident household members; however, they have a number of drawbacks when it comes to studying economic phenomena. These include: they are located in small geographic regions so results are unlikely to generalise; they do not collect detailed data on incomes and wages, crucial for studies of migration (Mckenzie & Rapport, 2007; Lucas, Citation2006; Posel & Casale, Citation2006); last, they are not individual level and thus on leaving the geographic location, no data are collected on outcomes for these migrants.
A2. Further discussion of migrant definitions
A caveat with defining migration as we do is that some individuals who died or emigrated between waves could conceivably be coded as migrants. However, the number incorrectly categorised as above is probably exceedingly small. Estimates are available on request.
Because migrants and retrospective migrants are defined only for residents, individuals can at different points in time fall under both categories. Labour migrants, which are defined only for non-residents, cannot be categorised as either of the above two migrant types at any point in time. We specifically define labour migration to include only non-residents as outlined in and in the text. We do this for reasons of consistency with the literature on labour migration in South Africa. There, labour migrants are defined as individuals absent for employment or job search and thus non-resident. These individuals appear on the household roster and do not have full questionnaires. Therefore the information we have on these individuals is limited and specific to a certain class of migrant – those that remain attached to their household of origin and for which limited data are collected. Because of non-residency, labour migrants do not form part of the NIDS longitudinal study. Therefore, the information gathered on this type of migrant is vastly different to that gathered on retrospective and general migrants who form part of the NIDS study. This is not to say that that the migrant and retrospective migrant definitions will not be netting individuals who are in fact labour migrants – they will. So while it is feasible in theory that current labour migrants could be classified as retrospective migrants at their 2008 destination, the way the NIDS survey is conducted and therefore the way we define labour migration excludes these definitions intersecting.