
Abstract
Modelling approaches are utilised to understand complex and dynamic issues, which are characteristic of the South Africa power sector, especially since the sector has been at the centre of green economy debates. This paper thus draws on a system dynamics approach that captures and represents the dynamic behaviour of transforming the power sector with a green economy framework. This was done utilising the South Africa Green Economy Model and investigating whether current policies and strategies can improve economic growth, while at the same time reducing the impact on the environment and providing more employment. In general, the paper shows that green economy investments in the power sector provide opportunities for achieving the diversification of the energy mix, job creation, as well as CO2eq emissions reduction. However, more aggressive investments are necessary if all of the targets, as laid out in the National Development Plan, are to be achieved.
1. Introduction
Modelling and simulation are not only important for academic purposes but already very well established in energy policy-making and decision-making; in particular, to provide support in the formulation of energy efficiency, energy security, energy access and climate change policies. As an illustration, energy policies are often formulated with the need to contribute to the global effort of reducing greenhouse gas through increased development of renewable energy in the power sector (Pina et al., Citation2011). This is even becoming more relevant in recent discussions where renewable electricity initiatives are embedded within wider ideological debates on the green economy.
The green economy is viewed as a new way of capital allocation. Conceptually, it refers to the improvement of human well-being, the reduction in inequalities, and the protection of future generations' ecological scarcities and related environmental risks (UNEP, Citation2011). According to Barbier (Citation2010), there are three main objectives that are relevant in the context of the green economy, namely: economic recovery; poverty reduction; and reduced carbon emissions and ecosystem degradation. With these three essential policy-relevant objectives, the green economy concept has moved beyond environmental economics boundaries and is currently mainstreamed in politics and business (Borel-Saladin & Turok, Citation2013). In South Africa, the green economy becomes important given the two main challenges of, first, the high level of unemployment, which in 2013 was 24.5%, and, second, the high carbon impact of the economy (Borel-Saladin & Turok, Citation2013).
In determining the sectors with the potential for achieving green economy objectives, various studies (e.g. Cai et al., Citation2011; Matthews, Citation2012; Musango et al., Citation2014; Winfield & Dolter, Citation2014) have shown that governments around the globe have embedded energy sectors, and specifically power sectors, within the broader green economy agenda. Carley et al. (Citation2011, 282–295) have even defined the green economy from the perspective of energy-based economic development, where it is considered ‘a process by which various policy actors in a given region work to promote clean energy in ways that contribute to job creation, job retention, and regional [country/ city] wealth creation’. Three potential strategies for greening the economy are: linking strategies; transformational strategies; and leapfrogging strategies (Fitzgerald, Citation2010). One can thus argue that the basic characteristics of a green economy are as follows (Yi, Citation2013): specific sectors of the economy that will play a key role in driving the green economic development, such as renewable energy; the development encompasses a job creation goal; the development is driven by strategic actions that are relevant to policy actors, implying that government action to develop relevant policies is essential; and the development encompasses both low carbon transitions and resource efficiency.
In South Africa, the need to transition the energy sector as part of the overall green economy agenda is articulated in various government documents (e.g. Maia et al., Citation2011; DEA & UNEP, Citation2013). The main goals for greening the economy include transitioning the country to a low-carbon path, pro-poor job creation and resource efficiency. The benefit of ‘job creation’ is becoming utilised more and more to promote the goals of greening the economy as observed in the ‘one million climate jobs campaign’.Footnote4
Clearly, if one has to investigate how investment in a particular sector would contribute to the green economy objectives for any country, province or even city, there is a need to analyse its interdependences with the broader spheres of economy, society and environment. This is because the green economy goal touches into these three spheres. For instance, when considering the energy sector as a whole, it is highly interdependent with the economy, society and environment (Bassi, Citation2009). This means that any changes occurring in the energy sector would have influence on, as well as be influenced by, the dynamics in the economy, society and environment. With the power sector, as an example, the generation of electricity relies on natural resources (conventional or renewable). Electricity is an important driver of the economy, and society cannot exist without energy (including electricity). And, from the environmental perspective, certain electricity generation technologies impose more environmental damage, while others can contribute to improving the burden of the economy on the environment through, for example, less carbon emissions. Electricity technology development also creates jobs in the society, which is essential for economic growth, and, in turn, increases demand for electricity and, hence, more demand on energy resources.
It is therefore the interdependence of the power sector with the spheres of economy, society and environment that makes sustainable policy-making and decision-making a challenging task. This is because, on one hand, policy-makers have to make policies with competing goals of economic growth, job creation and low carbon transition – in the midst of financial crises, environmental protection crises, and poverty and widening inequality. On the other hand, the complexity of the power sector primarily comes from the existence and interactions of non-linear and dynamic variables. These variables include, among others, electricity generation capacity, restrictive and regulatory regimes, price dynamics, advancement and challenges in technologies for electricity generation, jobs created from various technologies, contributions to the economic growth (factors of production, i.e. agriculture, industry and services), and contribution to the reduction of greenhouse gas emissions.
With the above background, understanding complex issues relating to the power sector within a green economy framework necessitates the use of systems simulation that sufficiently accounts for interdependencies in the spheres of economy, society and environment. This paper therefore utilised the South Africa Green Economy Model (SAGEM), which is a system dynamics-based simulation model. The primary purpose of SAGEM was to test the effects of investing in technology options for a green economy in South Africa (see DEA & UNEP, Citation2013; Musango et al., Citation2014). SAGEM includes cross-sector dynamics between the economy, society and environment, and was thus considered appropriate for use to closely examine the power sector. The key question addressed was whether the current policies and strategies with respect to the power sector can improve economic growth, while at the same time reducing environmental impact and creating more employment. In doing so, this is deemed useful for informing policy in designing effective measures to achieve indicated targets in the power sector.
2. Why system dynamics to analyse the power sector within green economy development?
System dynamics was developed by Jay Forrester in the 1960s, and is based on feedback control theory (Forrester, Citation1961; Sterman, Citation2000). It is a well-established framework for describing, modelling, simulating and analysing dynamically ‘real-world’ complex issues (Pruyt, Citation2013). Several authors have developed guidelines for the system dynamics modelling process (Forrester & Senge, Citation1980; Randers, Citation1980; Richardson & Pugh, Citation1981; Roberts et al., Citation1983; Wolstenholme, Citation1990; Sterman, Citation2000; Sterman, Citation2000). All of the guidelines include similar iterative activities that involve qualitative and quantitative modelling. Qualitative modelling involves problem identification and conceptualisation, where the issue being investigated is mapped out using qualitative tools such as causal loop diagrams and influence diagrams (Sterman, Citation2000). Quantitative modelling involves model building in a system dynamics software, model testing and, finally, policy testing and analysis (Sterman, Citation2000).
System dynamics has been utilised in diverse fields. Focusing on the energy sector, it has been used to study national energy policy evaluation (Naill, Citation1992), energy security management (Shin et al., Citation2013) and energy technology sustainability assessment (Musango & Brent, Citation2011), among others. In the power sector, specifically, it has been utilised to understand the privatisation of the electricity industry (Assili et al., Citation2008); inter-fuel substitution, energy efficiency and electricity substitution (Moxnes, Citation1990; Assili et al., Citation2008); energy investments and uncertainty (Bunn & Larsen, Citation1992); electricity-related emissions assessments (Feng et al., Citation2013); and analysing electricity generation capacity dynamics (Qudrat-Ullah, Citation2013). While these analyses of the dynamics of the power sector are very useful, they do differ from the analysis in this paper in that they do not endogenously account for the interdependence of the sector with the spheres of economy, society and environment. Additionally, they are not developed within the framework of the green economy context. Indeed, there are currently limited studies utilising system dynamics to demonstrate how green economy investments in the power sector could impact the green economy agendas of job creation, emission reduction and economic growth. The existing studies focus on one green static model that may not be appropriate to show dynamic linkages and projections on the long-term developments. Borel-Saladin & Turok (Citation2013) point out that the challenge in the existing studies in South Africa is that they tend to ignore investment costs of various technologies and the projections are linearly extrapolated. They argue that this may pose the risk of not adequately determining the feasibility of implementing certain technologies.
While it is recognised that the bulk of the investment would obviously originate from the private sector, one way of demonstrating the investment requirements in the long term is to assume allocating a proportion of the growth domestic product (GDP) on green economy electricity generation activities. In this situation, GDP is endogenously estimated in the model. Using the proportion of GDP, it is then possible to determine, in a dynamic manner, how much investment would actually be required in the future and whether current planned targets would be achieved. This in turn is useful for informing policy in understanding how best policies could be revised or developed in a more relevant and practical manner.
In summary, modelling and simulation – and specifically system dynamics – are thus considered appropriate for the analysis of the power sector for a number of reasons. Firstly, models built in system dynamics are simple in that they make use of four basic building blocks. These building blocks are stocks, flows, auxiliaries and constants, which are linked as shown in . A stock represents the accumulation of materials or information that has built up over time; a flow is the material that enters or leaves the stock over a period of time and affects the stock (Meadows, Citation2008); an auxiliary represents an instantaneous effect; and a constant is an exogenous parameter. Links are utilised to represent information flow from a stock, auxiliary or constant.
Figure 1: Model building blocks in system dynamics
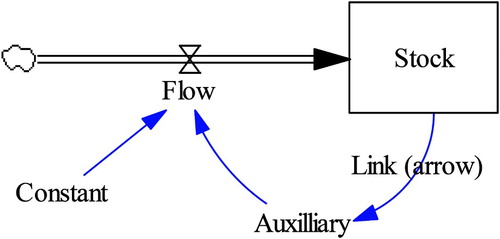
Secondly, using the four building blocks, it is possible to capture systems that are sufficiently complex in order to include diverse viewpoints. The structural transparency of the system dynamics building blocks facilitates communication between stakeholders. This is of great value for discussions; especially in situations where an analysis has been obtained using theoretical models, or applications have only been made to single systems and do not account for a holistic view. In doing so, system dynamics simulation models are able to organise discussions, making critiques constructive rather than destructive.
Thirdly, it is also possible to develop scenarios that can investigate the impact of investment capacities on the key green economy agendas. This also provides the potential for supporting the coordinating of various green economy related policies in the power sector, many of which are developed by different government departments in isolation. This can increasingly be used for broader support of policy-making and decision-making.
In the following section, the SAGEM is introduced and specific emphasis is made of these three benefits in the analysis of the power sector.
3. South Africa Green Economy Model
SAGEM was developed to explore the green economy transition for South Africa, with attention given to meeting low carbon growth, resource efficiency and pro-job development targets (DEA & UNEP, Citation2013; Musango et al., Citation2013, Citation2014). SAGEM was developed on the same basis as the model that underpins the UNEP (Citation2011) Green Economy Report by utilising the system dynamics approach.
The modelling process began with stakeholder engagements in September 2011, whereby eight sectors that have the potential to contribute to the green economy in South Africa were identified: energy; agriculture; manufacturing; recycling (waste management); tourism; transport; water; and ecosystem services (fauna and flora) (DEA & UNEP, Citation2013). This was followed by a stakeholder workshop in January 2012, which prioritised four out of the eight sectors: natural resource management (ecosystem services), energy, transport and agriculture. These four sectors were then analysed in the first phase of the modelling – using the Vensim DSS software package. Given the data availability at a national scale, the time horizon for SAGEM begins in 2001 and extends to 2030, which is in line with the current National Development Plan (NDP) time horizon.
The data utilised for developing SAGEM were obtained from various sources covering all of the modelled sectors. Stellenbosch University, the Sustainability Institute and the Millennium Institute collected the data in consultation with, and assistance from, the Department of Environmental Affairs, the National Treasury, the Department of Trade and Industry, and the Development Bank of Southern Africa, among others. More information on the data is provided elsewhere (DEA & UNEP, Citation2013; Musango et al., Citation2013).
While the model consists of 31 sub-models, the specific focus of this paper is the power sector, which consists of various sub-modules that can broadly be grouped as: electricity supply (which is further categorised into coal, nuclear, wind, pumped storage, hydro and solar); electricity generation share; electricity prices; and electricity demand. The benefit of using SAGEM is that the model already incorporates various complex dynamics that cut across the spheres of economy, society and environment. This paper is thus able to specifically analyse the dynamics and impact of the power sector in a green economy framework by elaborating on a number of issues.
Firstly, the dynamic interactions and feedbacks between the electricity system variables, such as production capacity, electricity capacity investment costs, price of the electricity, impacts on the environment (CO2eq emissions) and jobs, are analysed (see ). One should note that does not represent all of the feedback loops because it only serves the purpose of illustrating various variables and aspects considered in the power sector analysis within the green economy framework. For instance, in estimating the impact of the power sector on green economy goals, it becomes essential to consider the dynamics of investment costs into the future. Additionally, considering the potential to invest a proportion of GDP in the green economy provides the potential of estimating how much capacity is capable of being developed.
Figure 2: Schematic representation of power sector analysis within a green economy framework
Secondly, variability and substitution among competing electricity generating technologies are taken into account. This is represented in the production capacity, which includes both conventional (e.g. coal) and renewable (e.g. solar and wind) electricity generation technologies. The variability and substitution is influenced by green economy investments in specific electricity generation technologies.
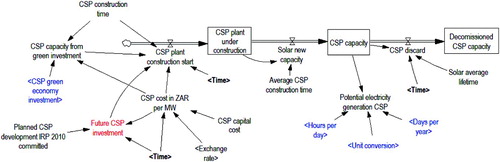
Thirdly, time delays of the expected electricity capacity development processes and generation efficiencies of the electricity system for the various technologies are explicitly accounted for. As an illustration, shows a stock and flow diagram for concentrating solar power. Similar sketches are made for all of the different technologies.
Figure 3: Stock and flow sketch of concentrating solar power (CSP) development
Finally, non-linearities between variables in the power sector that are specific to the green economy agenda are explicitly represented. These are the effects of green economy investments, which influence the technologies developed in the production capacity, in turn influencing the share of technology in electricity generation, jobs created and CO2eq emissions.
Looking broadly at the electricity sector, production capacity (shown in ) is represented by installed capacity of different electricity generation technologies. The amount of installed capacity influences the electricity generated. As an illustration, the amount of electricity generated from coal is estimated from the total capacity of coal electricity plants, the capacity factor, and the potential for coal capacity reduction with given energy-efficiency measures. Using similar variables specific to each technology, electricity generation from other technologies, mainly hydro, nuclear, pumped storage, solar and wind, were estimated. Electricity production is influenced by investments (via installed capital capacity) and was computed by taking into account the electricity demand and electricity production capacities. Gross electricity demand is the sum of retail sales and distribution, distribution and transmission losses, and electricity net exports. The difference between the gross electricity demand and the electricity generation from renewables, nuclear, hydro and pumped storage yielded the demand for electricity generation from coal.
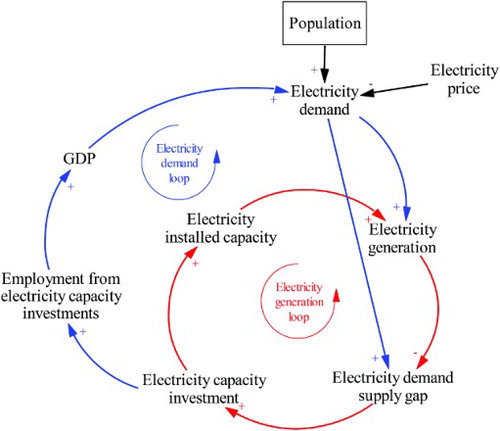
Electricity demand estimates future electricity dynamics by different electricity users, which is driven by GDP, population and electricity prices. The electricity users that are included in the analysis are: residential, industry, transport, commerce and agriculture. The dynamics of electricity demand and supply can conceptually be illustrated by the causal loop diagram in . This diagram shows the key variables that were endogenously determined in the electricity generation and electricity demand feedback loops.
Figure 4: Causal loop diagram illustrating the main feedback loops for the power sector
The electricity generation share was estimated as the proportion that each generation technology contributes to the total electricity supply. This was important in showing how the changes occur over time, as investment and development in capacities takes place for the different electricity generation technologies.
In the case of electricity prices, this was exogenously projected based on the determination of the National Energy Regulator of South Africa on electricity growth after 2013 (NERSA, Citation2012). This assumption seemed reasonable given that the electricity prices are regulated by NERSA. Relative electricity prices have a major influence on the production sectors, which in turn influence GDP and green economy investment allocations in electricity capacity development.
4. Scenarios
There were two categories of scenarios analysed in SAGEM, which were used to present the results of the power sector. The first comprised business-as-usual scenarios, which assumed a general continuation on the current investment in the economy in the areas of natural resource management, energy, agriculture and transport sectors. These scenarios were defined as business-as-usual (BAU) and business-as-usual two per cent (BAU2%). The BAU2% allocates an additional 2% of GDP investments to the business-as-usual activities.
The second category comprised the green economy scenarios, which assumed an active government intervention in the identified four sectors in order to encourage shifts towards low carbon, resource efficient and pro-employment development. Two green economy scenarios were defined as green economy target specific scenario (GETS) and green economy two per cent (GE2%). These two green economy scenarios represent priority-driven investment and an additional investment of 2% of the total real GDP respectively in the four selected sectors. The GE2% assumed that the investment was allocated equally across the four selected sectors. GETS was developed based on the target expenditure and goals for the different sectors of interest. In this scenario, all the options are weighted differently based on their investment prioritisation and targets in various policy and strategy documents. For the case of the energy sector, and specifically the power sector, the Integrated Resource Plan 2010 electricity capacity targets were used. As a note, the proportion of green investment in GETS varied over time, and differed across the prioritised sectors, with the allocation driven on the prioritisation of targets.
5. Results
5.1 Share of renewable electricity generation
Transitioning towards a diversified electricity generation share is one of essential factors for greening the economy. This is of particular interest for South Africa given that more than 90% of the electricity is generated from coal. Several targets have been put in place; for instance, according to the Integrated Resource Plan 2010, the target is to achieve 17.8% of newly built electricity generation from renewables. On the other hand, the NDP prescribes a higher target of 33% of new generation from renewables by 2030. There are two situations that were investigated here. The first is the share of renewables by actual generation, and the share of renewables by generating capacity.
Looking at the share of renewables by actual generation, both the green economy scenarios (GETS and GE2%) contribute to the diversification of the energy mix in the power sector. In the GETS scenario, this is achieved by 2030 (see ), as the share of renewables reaches 24.4%. With the GE2%, renewable electricity constitutes 16% of total electricity generated (see ). On the other hand, the BAU and BAU2% scenarios have a lower share of renewable electricity, which is 8.2% for both scenarios. Thus, the GE2% scenario results in almost double the share of renewable electricity relative to the BAU and BAU2% scenarios (see ). Nevertheless, to achieve the NDP's target, a 33% share, would require a more aggressive green economy investment intervention than the GETS and GE2% scenarios.
Table 1: Share of renewable electricity by electricity generation in BAU, BAU2%, GETS and GE2%
Similarly, the share of renewables by generating capacity is higher in both green economy scenarios relative to BAU and BAU2%, where, in 2030, it is 35.74% in GETS and 24.81% in GE2% respectively (see ). In this case, if the NDP focus is on generating capacity, then the target would be achieved in the GETS scenario. However, one should note that generating capacity does not imply actual generation. Illustrating this using the GETS scenario, the renewable energy generating capacity share of 35.74% in 2030 only results in an actual generation share of 24.39%. Thus, the renewable energy generation gap, which is the difference between the share of renewable generation and the share of renewable generating capacity required to fulfil the renewable energy targets, needs to be taken into account.
Table 2: Share of renewable electricity by installed capacity in BAU, BAU2%, GETS and GE2%
Looking closely at the electricity generation mix, the green economy scenarios provide a higher proportion of diversification than the business-as-usual scenarios. In the GETS scenario, the projected share of the electricity generation is more diversified than GE2%, where the contribution of coal electricity generation is projected to be less than one-half (46.1%) as shown in . Similarly, the share of installed electricity generating capacity is more diversified in GETS (see ). In this scenario, the intermittency of renewable electricity becomes an issue, especially with regards to how base load demand is to be catered for. Indeed, with a higher share of renewables, it will become necessary to balance the supply with, for example, gas. This is an aspect that requires further investigation. Also, based on the recent pronouncements, it is expected that the total number of currently approved renewable energy projects will reach 64, with a combined capacity of 3933 MW (Creamer, Citation2013). It thus becomes necessary to begin monitoring and reporting the progress on the extent to which these projects are contributing to the overall targets that are already in place, as well as ex-post empirical evidence on their share in electricity generation.
Figure 5: Electricity generation mix in the GETS and GE2% scenarios
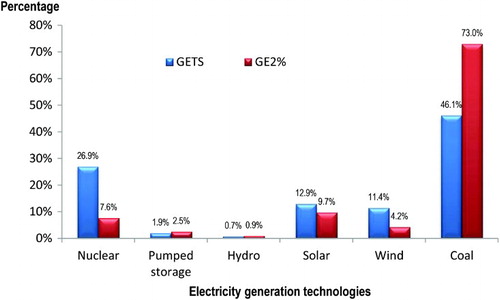
Table 3: Share of electricity installed capacity by technology
5.2 Carbon emissions from electricity generation
South Africa is ranked as the 14th largest greenhouse gas emitter in the world. This is attributed to the country's reliance on coal for electricity generation. According to the World Bank, the total CO2 emissions from electricity generation activities in South Africa were estimated at 217.73 million tonnes in 2008,Footnote5 which was about 47% of the total CO2 emissions in the country.Footnote6 Some commitments have been put in place to reduce 34% of the CO2 emissions by 2020 and 42% by 2025 (Parliament of the Republic of South Africa, Citation2011). The baseline for such reductions, however, is unknown.
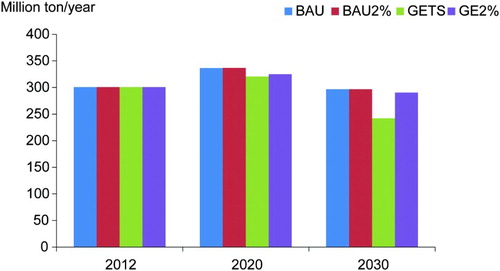
Renewable electricity generation technologies in SAGEM were considered at utility scale and included solar photovoltaic power, concentrating solar power and wind power. The priority for the development of renewable electricity generation in the GETS scenario leads to decreasing annual emissions, which reaches 242 million tonnes of CO2 by 2030 (see ). The GE2% scenario shows a lower reduction of emissions, with emissions projected to reach 290 million tonnes of CO2 by 2030. Both BAU and BAU2% projections reach 297 million tonnes of CO2 by 2030.
Figure 6: Emissions from power generation
5.3 Potential job creation with local manufacturing
A number of documents have highlighted the potential job creation of renewable energy. Among them is the Green Economy Accord, which indicates that 300 000 jobs would be created through green investments by 2020, most of which is argued will be in renewable energy. However, how this number was estimated is unknown. A different study by Maia et al. (Citation2011) estimates the jobs created in greening the South Africa economy, which also included jobs in electricity generation. The challenge with their estimates was that they provide a static snapshot without an analysis of how jobs will be generated over the longer term (Borel-Saladin & Turok Citation2013).
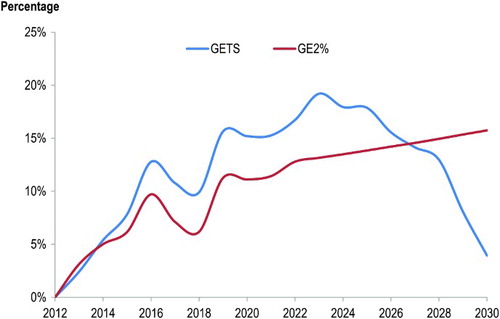
Generally, the positive impact of increasing the share of renewable energy capacity on creating manufacturing jobs is indisputable. However, the question is what the long-term dynamics are of jobs created with green economy investments in the power sector. In SAGEM, the jobs created from renewable energy development were categorised into construction employment and manufacturing employment. In this paper, specific attention is given to manufacturing employment. In analysing the potential job creation, an assumption was made, which compares two potential situations: 100% local manufacturing and assembly of renewable energy plants; and a possibility of importing 90% of the manufactured components. With local manufacturing (100%), GETS potentially creates, on average, 12% more jobs between 2012 and 2030 than a situation where 90% of components are imported (see ). This could possibly be more if net indirect jobs, which are the difference between indirect and induced jobs, were taken into consideration.
Figure 7: Potential job creation benefits with respect to a high import scenario
With ex-post empirical evidence it is possible to start tracking the extent of local manufacturing as the renewable energy development expands. This will be important to improve future modelling work by making use of context-specific data such as net indirect jobs, which are currently unavailable.
5.4 Growth domestic product in a cost-based approach
As earlier illustrated in , electricity cost from different technologies can have an impact on the price of electricity, which in turn influences the GDP through the primary factors of production (namely, agriculture, industry and service). This is of importance given that the cost of renewable electricity generation is declining due to a combined effect of rapid deployment and high learning rates for the different renewable technologies. This was also evident in South Africa in the three rounds of renewable energy competitive bids, as illustrated in .
Table 4: Average price from the first three Renewable Energy Independent Power Producer Procurement Programme bidding rounds
To account for this potential situation, a cost-based approach scenario was tested, where the price of the renewables and electricity remains constant while the price of coal increases. This is based on the expectation that, in the longer term, the price of the coal-generated electricity will increase while that of renewable energy will decrease (with significant capacities). With such a scenario, the cost of electricity will go down and the productivity of agriculture, industry and services will go up, which will ultimately increase the economic growth (GDP).
5.5 Energy efficiency benefits
Investment in energy efficiency is aimed at facilitating a transition towards a low carbon economy by reducing the energy demand, which in turn implies less reliance on coal-generated electricity. It was observed in the analysis that with the GE2% scenario a potential cumulative energy demand reduction of 3648 MW is achieved by 2030. This is of a similar order of magnitude than the largest coal plants that are being constructed in South Africa, namely the Medupi coal plant, which will have a capacity of 4788 MW.
6. Conclusions
This paper demonstrates the usefulness of simulation and modelling in undertaking and facilitating policy relevant discussion; pertaining to the development of the power sector within a green economy framework. Specifically, system dynamics was considered an appropriate approach due to its ability to represent complex real-world issues using only four basic building blocks, as described in the paper.
Using the SAGEM, to understand the dynamic interaction with the other sectors in the economy, this paper has shown possible opportunities to achieving the targets, laid out in the NDP, in the power sector. In general, green economy investments in the power sector provide opportunities for achieving the targets of diversifying the electricity mix, job creation and CO2eq emissions reduction in the overall economy. The extent to which the currently set targets are achieved, however, differs among the green economy scenarios that have been analysed. Although the rolling out of renewable energy in the electricity generation mix is considered a part of the contribution towards a low carbon transition and job creation, there are no clear specific targets that are linked to each of the electricity generation technologies outlined in the Integrated Resource Plan. Future studies will need to undertake ex-post evaluation to determine, for instance, the jobs created and carbon emission reductions related to the ongoing renewable energy projects. This will allow estimating employment and emission factors in the South Africa context, hence becoming useful in future simulation and modelling work that will inform further development targets.
Notes
6As per the World Bank, the total CO2 emissions in 2008 were 465 million tonnes: http://data.worldbank.org/indicator/EN.ATM.CO2E.KT?page=1
References
- Assili, M, Javidi, DBMH & Ghazi, R, 2008. An improved mechanism for capacity payment based on system dynamics modelling for investment planning in competitive electricity environment. Energy Policy 36(10), 3703–13. doi: 10.1016/j.enpol.2008.06.034
- Barbier, EB, 2010. A global green new deal: Rethinking the economic recovery. Cambridge University Press, New York.
- Bassi, A, 2009. An integrated approach to support energy policy formulation and evaluation. PhD thesis, University of Bergen, Norway.
- Borel-Saladin, JM & Turok, IN, 2013. The impact of green economy on jobs in South Africa. South Africa Journal of Science 109(9&10), 1–4. doi: 10.1590/sajs.2013/a0033
- Bunn, DW & Larsen, ER, 1992. Sensitivity of reserve margin to factors influencing investment behaviour in the electricity market of England and Wales. Energy Policy 20(5), 420–9. doi: 10.1016/0301-4215(92)90063-8
- Cai, W, Wang, C, Chen, J & Wang, S, 2011. Green economy and green jobs: Myth or reality? The case of China's power generation sector. Energy 36(10), 5994–6003. doi: 10.1016/j.energy.2011.08.016
- Carley, S, Lawrence, S, Brown, A, Nourafshan, A & Benami, E, 2011. Energy-based economic development. Renewable and Sustainable Energy Reviews 15(1), 282–95. doi: 10.1016/j.rser.2010.08.006
- Creamer, T, 2013. SA Weighs Appointment of More IPPs, as Green-energy Portfolio Expands to R150bn. http://www.engineeringnews.co.za/article/sa-weighs-appointment-of-more-ipps-as-green-energy-portfolio-expands-to-r150bn-2013-11-04 Accessed 5 November 2013.
- DEA (Department of Environmental Affairs) & UNEP (United Nations Environment Programme), 2013. Green Economy Modelling Report for South Africa: Focus on the Sectors of Natural Resource Management, Agriculture, Transport and Energy. https://www.environment.gov.za/sites/default/files/docs/greeneconomy_modelingreport.pdf Accessed 26 October 2013.
- Feng, YY, Chen, SQ & Zhang, LX, 2013. System dynamics modeling for urban energy consumption and CO2 emissions: A case study of Beijing, China. Ecological Modelling 252, 44–52.
- Fitzgerald, J, 2010. Emerald cities: Urban sustainability and economic development. Oxford University Press, New York.
- Forrester, JW, 1961. Industrial dynamics. Productivity Press, Cambridge, MA.
- Forrester, JW & Senge, P, 1980. Tests for building confidence in S-D models. TIMS Studies in the Management Sciences 14, 208–28.
- Maia, J, Giordano, T, Kelder, N, Bardien, G, Bodibe, M & Du Plooy, P, 2011. Green Jobs: An Estimate of the Direct Employment Potential of a Greening South African Economy. http://www.idc.co.za/projects/Greenjobs.pdf Accessed 30 October 2013.
- Matthews, JA, 2012. Green growth strategies – Korean initiatives. Futures 44(8), 761–9. doi: 10.1016/j.futures.2012.06.002
- Meadows, DH, 2008. Thinking in systems – A primer. Chelsea Green Publishing Company, White River Junction, VT.
- Moxnes, E, 1990. Interfuel substitution in OECD–European electricity production. System Dynamics Review 6(1), 44–65. doi: 10.1002/sdr.4260060104
- Musango, JK & Brent, AC, 2011. A conceptual framework for energy technology sustainability assessment. Energy for Sustainable Development 15(1), 84–91. doi: 10.1016/j.esd.2010.10.005
- Musango, JK, Brent, AC & Bassi, AM, 2013. South Africa Green Economy Model (SAGEM). Paper presented at the 31st International Conference of the System Dynamics Society, 21–25 July, Cambridge, MA.
- Musango, JK, Brent, AC & Bassit, AM, 2014. Modelling the transition towards a green economy in South Africa. Technology Forecasting and Social Change, in press. http://dx.doi.org/10.1016/j.techfore.2013.12.022 Accessed 20 June 2014.
- Naill, R, 1992. A system dynamics model or natural energy policy planning. System Dynamics Review 8(1), 1–19. doi: 10.1002/sdr.4260080102
- NERSA (National Energy Regulator of South Africa), 2012. Nersa Review ESKOM's Tariffs for the Period 10 April 2012 to March 2013. http://www.nersa.org.za/Admin/Document/Editor/file/News%20and%20Publications/Media%20Releases%20Statements/Media%20Statement-%20NERSA%20review%20Eskom%20tariffs%20for%20period%201%20April%202012%20-31%20March%202013.pdf Accessed 10 March 2012.
- Parliament of the Republic of South Africa, 2011. Urgent need for low carbon SA. http://www.parliament.gov.za/live/content.php?Item_ID=1870 Accessed 9 November 2013.
- Pina, A, Silva, C & Ferrão, P, 2011. Modeling hourly electricity dynamics for policy making in long-term scenarios. Energy Policy 39(9), 4692–702. doi: 10.1016/j.enpol.2011.06.062
- Pruyt, E, 2013. Small System Dynamics Models for Big Issues. http://simulation.tbm.tudelft.nl/smallSDmodels/News.html Accessed 10 January 2014.
- Qudrat-Ullah, H, 2013. Understanding the dynamics of electricity generation capacity in Canada: A system dynamics approach. Energy 59, 285–94. doi: 10.1016/j.energy.2013.07.029
- Randers, J, 1980. Guidelines for model conceptualization. In Randers, J (Ed.), Elements of the system dynamics method. MIT Press, Cambridge, 117–39.
- Richardson, GP & Pugh, AL, 1981. Introduction to system dynamics modeling with DYNAMO. Productivity Press, Cambridge.
- Roberts, NH, Anderson, DF, Deal, RM, Grant, MS & Shaffer, WA, 1983. Introduction to computersimulation: The system dynamics modeling approach. Addison-Wesley, Reading, MA.
- Shin, J, Shin, W-S & Lee, C, 2013. An energy security management model using quality function deployment and system dynamics. Energy Policy 54, 72–86. doi: 10.1016/j.enpol.2012.10.074
- Sterman, JD, 2000. Business dynamics: Systems thinking and modelling for a complex world. McGraw-Hill/Irwin, New York.
- UNEP (United Nations Environment Programme), 2011. Towards a Green Economy: Pathways to Sustainable Development and Poverty Eradication. http://www.unep.org/greeneconomy Accessed 6 January 2012.
- Winfield, M & Dolter, B, 2014. Energy, economic and environmental discourses and their policy impact: The case of Ontario's Green Energy and Green Economy Act. Energy Policy 68, 423–35. doi: 10.1016/j.enpol.2014.01.039
- Wolstenholme, E, 1990. System enquiry: A system dynamics approach. Wiley, Chichester.
- Yi, H, 2013. Clean energy policies and green jobs: An evaluation of green jobs in U.S. metropolitan areas. Energy Policy 56, 644–52. doi: 10.1016/j.enpol.2013.01.034