
Abstract
Despite the emphasis given to poverty reduction in policy statements and a substantial increase in social spending, money-metric poverty has shown little improvement since South Africa's transition to democracy in 1994. Alternative approaches to measuring well-being and inequality may show a more positive trend. This article uses the 2008 National Income Dynamics Study to assess the magnitude of inequalities in under-five child malnutrition ascribable to economic status. The article compares these results with those of Zere and McIntyre, who analysed similar data collected in 1993. In both cases, household income, proxied by per-capita household expenditure, was used as the indicator of socio-economic status. Children's heights and weights have increased since 1993 and being stunted or underweight has become less common. Furthermore, pro-rich inequalities in stunting and being underweight have significantly declined since the end of apartheid. This suggests that pro-poor improvements in child welfare have taken place. Policies that may have contributed to this include the Child Support Grant, introduced in 1998, and improvements in healthcare and the education of women.
1. Introduction
Despite the priority given to reducing poverty and inequality by successive governments since the end of the apartheid era in 1994, most studies continue to confirm that the prevalence of income poverty continued to increase in South Africa between 1993 and 2000, and has declined only marginally since 2000 (Statistics SA, Citation2002; Ozler, Citation2007; Leibbrandt et al., Citation2010a, Citation2010b). The result has been an increase of some 3.8 million in the number of people categorised as poor (below R515 per person per annum in 2008 prices) between 1993 and 2008, with the increase being most striking in urban areas (Leibbrandt et al., Citation2010b:36). This period has also seen a steady increase in levels of income inequality with the Gini coefficient growing from 0.66 in 1993 to reach 0.70 in 2008, when the mean income of the wealthiest decile in South Africa was around 145 times greater than that of the poorest decile (Leibbrandt et al., Citation2010b:32).
Reacting to statistics such as these, government officials point to substantial improvements in the coverage of social protection in South Africa, the provision of a range of free services often referred to as a ‘social wage’, and the growing allocation made by the national budget to social services. Measures of poverty that take account of the depth and severity of poverty lend support to the notion that there has been some decline in deprivation. The Poverty Gap, which measures the average shortfall of those lying below the poverty, declined by 12.5% between 1993 and 2008, and Poverty Severity, a measure that emphases the level of deprivation of those furthest from the poverty line, declined by 13.6% (Leibbrandt et al., Citation2010b:35). Taken together, these figures suggest that those who are most poor have seen an improvement in their welfare, and that simply estimating the share of the population below a poverty line may not do justice to the efforts of post-apartheid governments. In addition, over-reliance on money-metric measures may obscure both the progress made and the issues that require further attention. Focusing analysis more narrowly on children is a worthwhile exercise in its own right, as well as a way of exploring alternatives to more conventional forms of poverty analysis and obtaining a window on factors influencing the association between child nutritional status and food security (Kennedy & Peters, Citation1992).
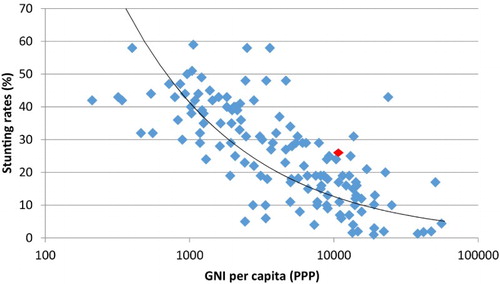
Despite South Africa's relative wealth, children's nutritional status has been identified as an important concern since the country's transition to democracy. Using data collected in 1993, Zere & McIntyre (Citation2003) reported that 24.5% of children aged six to 59 months were stunted, 17% were underweight and 8.9% were wasted. More than a decade later, the National Food Consumption Survey – Fortification Baseline revealed that 18% of children aged one to nine years were stunted, 9.3% were underweight and 4.5% were wasted (Labadarios, Citation2007). At first sight, these figures may appear low compared with stunting rates that exceed 40% in countries such as Bangladesh, Ethiopia or Malawi. However, as shows, when compared with its gross national income adjusted for purchasing power parity, South Africa, along with other relatively high-income African countries such as Gabon, Botswana and Equatorial Guinea, lies well above the global trend for countries that enjoy a similar level of economic prosperity.
Figure 1: Prevalence of stunting by gross national income per head (purchasing power parity estimates, US$), 2007–10
Sources: UNICEF (Citation2009), World Bank (Citation2010).
These rates of malnutrition translate into poor child outcomes. Reporting on the South African National Burden of Disease study, Nannan et al. (Citation2007) conclude that being underweight contributed to 12.3% of deaths among children aged younger than five. Research in the KwaZulu-Natal province of South Africa has demonstrated that stunted children do less well in their first few years at school than children who are an appropriate height for their age (Yamauchi, Citation2008). These socio-economic status gaps in child morbidity are ‘not simply inequalities, they are also inequities – inequalities that are unjust and unfair’ (Victora et al., Citation2003).
Improving our understanding of post-apartheid changes in the nutritional status of children can potentially assist in better identification of policy interventions seeking to bring about a sustainable reduction of poverty in South Africa. This article uses data concerning child nutritional status collected in 2008 to provide better insight into what changes in socio-economic status have taken place in South Africa since the end of apartheid. It updates the estimates of Zere & McIntyre (Citation2003) based on an earlier national survey that collected similar data in 1993. As with Zere and McIntyre, the aim is to develop further the quantification of inequalities in health in South Africa, and the extent to which this has changed since 1994.
2. Data and methods
The heights and weights of children and infants can be used to calculate anthropometric indices that can then be used to investigate changes in individual nutritional status as well providing evidence of past growth failure (Cogill, Citation2003). At the population level, such indicators can serve as a way of assessing inequalities in terms of health status and, potentially, future productivity and earnings (Braveman, Citation1998). Stunting, or low height for age, results from failure to grow at an adequate rate and is usually a sign of prolonged (chronic) under-nutrition and/or repeated disease or illness. It is considered to reflect the cumulative effects of socio-economic, environmental, health and nutritional conditions. Wasting, or low weight for height, is a short-term indicator that identifies children affected by current (acute) under-nutrition or recent illness and is a strong predictor of child mortality. Low weight for age identifies children who are underweight for a specific age and reflects both chronic and/or acute under-nutrition. Although being underweight may reflect no more than a temporary setback, stunting and wasting are useful indicators of sub-optimal mental and physical child development and, as a result of this, factors that predispose children to poorer health, lower earnings, and higher mortality later in life, and contribute to the persistence of intergenerational poverty.
The first wave of the National Income Dynamics Study (NIDS), a nationally representative survey undertaken in 2008, is one of a handful of datasets available in South Africa that has collected the information required to calculate these indicators (Leibbrandt et al., Citation2009; SALDRU, Citation2012). The survey collected repeated estimates of heights, weights and ages to reduce measurement error. Moreover, the NIDS provides detailed information on both the income and expenditure patterns of the 7302 households surveyed, which can be used to measure differences in socio-economic status (Argent, Citation2009; Finn et al., Citation2009). These data are readily comparable with those collected by the Project for Statistics on Living Standards and Development (PSLSD) in 1993, and with the analysis undertaken by Zere & McIntyre (Citation2003). Using very similar procedures, PSLSD also weighed and measured children and gathered detailed expenditure data from 8809 households.Footnote3
In line with many other studies, we measure inequalities in socio-economic status using household per-capita expenditure, include the imputations proposed by Finn et al. (Citation2009) for dealing with non-response and missing data, but exclude the imputed rent estimates to ensure comparability with the PSLSD.Footnote4 The prevalence of poverty is determined using the widely adopted poverty threshold proposed for South Africa by Ozler (Citation2007) adjusted to 2008 prices, which amounts to R515 per person per month.
Turning to the measure of nutritional status, children's heights and weights are usually assessed against those of a reference population of children in good health. In this paper we use the 2006 World Health Organization's Child Growth Standards as the reference to calculate z-scores for the three anthropometric indicators for pre-school children aged six to 59 months in both surveys (WHO, Citation2006). Children are defined as stunted if their height-for-age z-score (HAZ) is more than two standard deviations below the median height of healthy children of the same age. Similarly, these children are categorised as wasted if their weight-for-height z-score (WHZ) is more than two standard deviations below the median WHZ of healthy children. This also applies for underweight children using the weight-for-age z-score (WAZ). As suggested by the WHO (Citation2009), values exceeding –6 or +6 standard deviations were deemed implausible for stunting and excluded from the analysis, as were values for underweight that exceed –6 or +5 standard deviations and of wasting that exceed –5 or +5 standard deviations.
Following Zere & McIntyre (Citation2003), and also Wagstaff's (Citation2000) comparative study of child mortality, we use an ill-health concentration curve to depict changes in health inequalities between 1993 and 2008. Similar to the Lorenz curve used to depict income inequality, the illness concentration curve plots the cumulative proportions of children ranked by the household's socio-economic status against the cumulative proportions of malnutrition. We extend Zere and McIntyre's analysis over time and construct a composite index of anthropometric failure (CIF) proposed by Svedburg (Citation2000) and applied by Nandy et al. (Citation2005) using the 1998/99 National Family Health Survey in India. This index combines HAZ, WAZ and WHZ, which may underestimate the prevalence of under-nutrition if used independently, identifying children who show nutritional deficiencies in any of these three respects. The index has resonance with Alkire & Foster's (Citation2009) equally weighted counting approach to multi-dimensional poverty.
3. Analysis
The NIDS surveyed 2925 children aged six to 59 months and measured the heights and weights of 74% of them.Footnote5 The PSLSD surveyed 4318 children in the same age range and measured the heights and weights of 87% of them. When they were compared with the reference population, the data on up to 9% of those measured in 2008 had to be excluded as being implausible (depending on the measure), compared with just 4% of the 1993 group. This means that the z-scores from the NIDS are based on between 1879 and 2099 children aged six to 59 months, compared with between 3608 and 3716 children in the PSLSD.
compares several characteristics of the children whose anthropometric characteristics were, and were not, measured in the two surveys. In the earlier survey, unmeasured children were more likely to be from rural areas and to be African than those from whom anthropometric data were collected, and came from slightly poorer households on average. In the later survey, in contrast, unmeasured children were more likely to be from urban areas and less likely to be African than those who provided anthropometric data, and came from slightly richer households on average. This suggests that the earlier survey may overestimate the extent of malnutrition in South Africa and the later survey underestimates it. Thus, comparing the two surveys may exaggerate the extent of any improvement in children's nutritional status over the intervening period. Nevertheless, the biases in the samples of children who were measured are only moderate. Unless the heights and weights of unmeasured children are very different from those of measured children growing up in similar families, no more than a small proportion of the changes observed could be spurious.
Table 1: Characteristics of children aged six to 59 months whose anthropometric measurements were and were not taken, 1993 and 2008 surveys
Hall (Citation2012) notes that children are more likely than adults to live in poor households. This suggestion is supported by the NIDS data in . They show that 73% of children aged six to 59 months are in poor households. This statistic can be compared with just less than 50% of all households that are categorised as being poor. As is also shown in , there are substantial differences in child poverty by race and type of place of residence, although not by sex.
Figure 2: Prevalence of money-metric poverty, 2008
More than 80% of African children aged six to 59 months are to be found in poor households, compared with less than 8% of white children. While less dramatic, the differences between African, coloured and Indian children are nonetheless striking. An astounding 93% of rural children aged younger than five years are living in poor households.
compares the percentage of children who have HAZ, WHZ and WAZ scores that lie two or more standard deviations below the reference child. We also show the percentage of children who experience an anthropometric deficit in any one or a combination of these dimensions as the CIF as well as the percentage of the children who live in households in which per-capita expenditure is below the poverty line
Table 2: Prevalence of stunting, wasting, underweight, the composite index of failure and poverty among children aged six to 59 months (%)
All forms of anthropometric deficit were less frequent in 2008 than in 1993, and children who experienced one or more forms of failure had declined by more than seven percentage points. This stands in contrast to the headcount of poverty for children in this age group, which, if anything, increased slightly.Footnote6 Depicting the full distribution of the anthropometric scores in a kernel density graph allows these changes to be better visualised. These graphs are shown in .
Figure 3: Kernel density estimates of the distribution of the anthropometric z-scores of children aged six to 59 months, 1993 and 2008
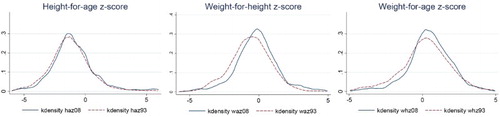
At –0.98, the mean HAZ of children in 2008 was significantly higher than that for 2008 at –1.23. Moreover, the whole HAZ distribution shifted slightly upward between the surveys: the dashed line representing the 1993 data is flatter, wider and to the left of that for 2008. Thus, although children in South Africa were shorter than one would expect in a healthy population in both 1993 and 2008, their heights increased between the two dates with the improvement being largest in the lower half of the distribution. also reveals that children's weights increased relative to their height and their age throughout the distributions. The increase in children's WHZ and WAZ scores between the two dates is even more marked than that in HAZ. Moreover, these measures also rose most markedly among children of below-average weight, producing narrower, more highly peaked distributions in 2008 than in 1993.
shows some evidence of differences by race and location in the various anthropometric measures. However, although many more African than coloured children live in households suffering from money-metric poverty, African children are no more at risk of experiencing an anthropometric deficit than coloured children. The low prevalence of any form of anthropometric deficit among Asian and Indian children, and the low prevalence of stunting and underweight among white children, are statistically significant. With the exception of the WHZ score, more girls than boys and more rural residents than urban residents are in anthropometric deficit, but these differences are not statistically significant.
Figure 4: Prevalence of anthropometric deficits among children aged six to 59 months, 2008
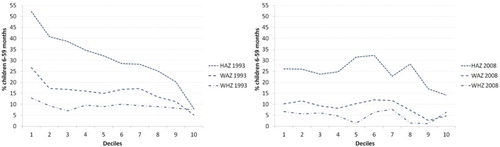
compares the proportion of children with z-scores indicating the presence of stunting, wasting and underweight by income decile of the children in 1993 and 2008. The result is striking. While the re-estimated results for 1993 broadly match those reported by Zere & McIntyre (Citation2003) using the earlier WHO standard, the results for 2008 depict a dramatic decline in inequality in terms of stunting and, to a lesser extent, wasting and being underweight. Among children living in households in the poorest 80% of the total population, about 27% can be classified as stunted in 2008, compared with 16% of those living in the top two deciles in terms of per-capita expenditure. Wasting has declined from around 9.5% of children living in the bottom 80% of households in 1993 to just over 5% of this group in 2008, while the percentage of underweight children has dropped from 17% to 10% for the same group of children. The virtual elimination of inequalities in the prevalence of stunting within the bottom 80% of the income distribution between 1993 and 2008 is particularly striking.
Figure 5: Anthropometric z-scores of children aged six to 59 months by decile based on their household's per-capita expenditure, 1993 and 2008
Another way of depicting inequalities in terms of health outcomes including anthropometric status is to make use of illness concentration curves originally suggested by Wagstaff et al. (Citation1989), and later adopted by Zere & McIntyre (Citation2003) to depict the South African situation in 1993. These curves plot the cumulative proportions of children ranked in deciles by per-capita household expenditure against the cumulative proportions suffering from malnutrition. This is shown for stunting in for 1993 and 2008. Stunting remains concentrated to some extent among households in the middle of the income distribution. Nevertheless, the extent of the reduction in health inequalities between 1993 and 2008 is once again noteworthy, with the 2008 line running close to the 45° line of equality. A similar pattern is found for low weight but, as suggested by , inequalities in wasting are small for both dates.
Figure 6: Cumulative proportion of stunted children aged six to 59 months by decile based on their household's per-capita expenditure, 1993 and 2008
A final issue is whether the impact of income on child malnutrition is being offset by other observable characteristics of the children, the households in which they live, or the location of these households in terms of type of place of residence (urban versus rural) and province. To test for this, a logistic regression is estimated for each of the determinants of nutritional outcomes (HAZ, WHZ, WAZ and the CIF). In addition to the standard demographic and spatial confounders, logged per-capita expenditure, a housing quality score based on the construction of and services provided to the dwelling, and a durable goods score are included as alternative proxies for household wealth (for more details on the construction of the scores, see Timæus et al., Citation2013). Information was not available on the educational attainment of 2.4% of the children's mothers and was imputed for these women (see Timæus et al., Citation2013). The fitted regression models are presented in , which reports odds ratios for each of the four anthropometric indicators. Results that are statistically significant at the 95% level are highlighted.Footnote7
Table 3: Fitted odds of anthropometric deficit, children aged six to 59 months
After controlling for children's socio-economic status, demographic characteristics and province, little evidence exists that place of residence affects their anthropometric characteristics. Wasting may be more common in urban areas (p < 0.09). No difference exists between the provinces in the prevalence of wasting after controlling for other factors, but stunting is more common in Eastern Cape, Free State, Gauteng and Limpopo than it is in Western Cape, KwaZulu-Natal and Mpumalanga. Coloured children are more likely to be stunted, and Indian children less likely be stunted, than African children with similar demographic and socio-economic characteristics. Neither the per-capita expenditure of children's households nor their housing conditions has an evident effect on their nutritional status.Footnote8 Moreover, mothers' education is unrelated to stunting among their children. Wasting is more common among children whose mothers have very limited schooling, however, and mothers who only attended primary school are more likely to have underweight children than those who proceeded to secondary school. The index based on the household's ownership of durable goods, on the other hand, is consistently positively related to the anthropometric variables. This is a highly right-skewed measure that, rather than identifying the poor, discriminates well between the better-off 30% of households, which is precisely the sub-group of children within which suggests that differences in nutritional status persist. The regression models thus confirm that the enormous gaps in child nutrition according to socio-economic status reported by Zere and McIntyre have largely disappeared, and that malnutrition in 2008 arises from factors other than poverty.
4. Conclusion
Based on data collected in 1993, Zere & McIntyre (Citation2003) identified inequities in children's nutritional outcomes based on race and income and called for social policies to be put in place to address these. Data collected in 2008 suggest that the prevalence of stunting among young children has fallen and that inequities in stunting in terms of income, at least, have been reduced. While studies of school-age children and of particular provinces have documented similar trends (Armstrong et al., Citation2011; Timæus, Citation2012), this has not been documented previously at the national level for pre-school-age children.
These gains are especially noteworthy in the face of high HIV/AIDS prevalence during this period, although it must be acknowledged that these data are confined to the survivors and, whether or not they were infected with HIV, the most severely malnourished children born during 2003–08 may have died. It appears that something has worked, and the available evidence points to the introduction of the Child Support Grant in 1998 as one important factor. This is supported by Aguero et al. (Citation2009), who made use of the three waves of the KwaZulu-Natal Income Dynamics Study data to demonstrate a statistically significant and positive causal link between accessing the grant and the anthropometric status of children. Of course, several other factors might also have contributed to these improvements in the nutritional status of pre-school-age children. They include the substantial rise in the proportion of children living in households with ready access to clean water during the 15 years from 1993 to 2008, continuing improvements in the educational attainment of women of childbearing age, and the introduction of free healthcare for children in 1994. Moreover, as the socio-economic gradient in children's nutritional status across the lower two-thirds of the income distribution is now slight, further increases in the Child Support Grant may not result in further reductions in stunting. Instead, a case may exist for providing income support to pregnant women, or alternative policies to cash grants may have to be found.
Despite the positive trend in their nutritional status, the bulk of South Africa's children continue to live in households that are below the poverty line. As Hall (Citation2012) demonstrates, children are more likely than adults to be found in households that are poor in terms of income, access to services and participation in the labour market. This means that, while inequities in nutritional status may have largely been resolved with the existing suite of policies, and the appeal made by Zere & McIntyre (Citation2003) that appropriate policy responses be found appears to have been heard, children remain at risk in South Africa. Other outcomes such as their education and successful transition into adulthood are still in jeopardy, and the prevalence of malnutrition remains unacceptably high for a middle-income country. To deal with this, further steps are required to address household-level poverty, including better service delivery to those areas in which children are living, the creation of economic opportunities for the adults with whom children are living, and the delivery of other forms of social protection to children. Further, given the alarming increase of obesity among children in South Africa reported by Ardington (Citation2011), any appeal for appropriate food policies now proposed should include raising awareness of the need for healthy nutrition and lifestyles. The promotion of appropriate health-seeking behaviour, physical activity and the avoidance of alcohol, sugary drinks and foods with high fat and sodium content, both as part of school curricula and by other means, are possible options.
Acknowledgements
This article was produced with financial support from the Programme to Support Pro-Poor Policy Development, a partnership of the Presidency, Republic of South Africa and the Delegation of the European Union, and from the UK Economic and Social Research Council (grant number RES–238–25–0030). The contents of the article can in no circumstances be regarded as reflecting the position of the European Union.
Notes
3A second wave of the NIDS was collected in 2010 and released in March 2012. As with most panel data, NIDS Wave 2 is not necessarily representative of the South African population and these data are not used in this article. Our measures of children's ages and their mothers' schooling, however, do make use of information collected in Wave 2 about a number of children for whom the Wave 1 data are deficient.
4The recommended post-stratified weights are used for both surveys (Wittenberg, Citation2009).
5The sample size for some population groups, notably Asian/Indian and White, is too small to report on disaggregated results. We provide this information in the figures for completeness but do not interpret these findings.
6Household and child poverty trends are more optimistic when income is used as the indicator of well-being. This is noted by Hall & Wright (Citation2010), who reports a significant decline in child poverty using the General Household Survey. In line with most international literature adopting money-metric measurements of poverty, we retain expenditure as our preferred indicator.
7To further assess whether failure to measure the heights and weights of more than one-third of the children has biased our results, we also fitted Heckman selection probit regressions to these data, using interviewer number as an additional predictor of non-response in order to identify the models (results not shown). These models did not yield any evidence that the unadjusted results are biased and supported substantive conclusions that are virtually identical to those we reach on the basis of the models presented in .
8No evidence exists that the income and housing variables are related to children's nutritional outcomes even if the consumer durable score is left out of the regression model. Although they are correlated, these variables measure different aspects of a household's economic circumstances.
References
- Aguero, JM, Carter, MR & Woolard, I, 2009. The Impact of Unconditional Cash Transfers on Nutrition: The South African Child Support Grant. Department of Agricultural and Applied Economics, University of Wisconsin, Madison.
- Alkire, S & Forster, J, 2009. Counting and multidimensional poverty. In Von Braun, J, Vargas Hill, R & Pandya-Lorch, R. (Eds), The Poorest and Hungry: Assessment, Analysis and Actions. International Food Policy Research Institute, Washington, DC, pp. 77–90.
- Ardington, C, 2011. Links between obesity, hypertension and poverty. PSPPD Policy Brief, Programme to Support Pro-Poor Policy Development/EU, Pretoria.
- Argent, J, 2009. Household income: Report on NIDS Wave 1. National Income Dynamics Study Technical Paper No. 3, University of Cape Town, Cape Town.
- Armstrong, MEG, Lambert, MI & Lambert, EV, 2011. Secular trends in the prevalence of stunting, overweight and obesity among South African children (1994–2004). European Journal of Clinical Nutrition 65(7), 835–40. doi: 10.1038/ejcn.2011.46
- Braveman, P, 1998. Monitoring equity in health: A policy-oriented approach in low- and middle-income countries. WHO/CHS/HSS/98.1, World Health Organization, Geneva.
- Cogill, B, 2003. Anthropometric Indicators Measurement Guide. Food and Nutrition Technical Assistance Project, Academy for Educational Development, Washington, DC.
- Finn, A, Franklin, S, Keswell, M, Leibbrandt, M & Levinsohn, J. 2009. Expenditure: Report on NIDS Wave 1. National Income Dynamics Study Technical Paper No. 4, University of Cape Town, Cape Town.
- Hall, K, 2012. A national child poverty monitor: The use of child-focused indicators to reflect on social policy in South Africa. PSPPD Research Report, Programme to Support Pro-Poor Policy Development/EU, Pretoria.
- Hall, K & Wright, G, 2010. A profile of children living in South Africa in 2008. Journal of Economics and Econometrics 34(3), 45–68.
- Kennedy, E & Peters, P, 1992. Household foodsecurity and child nutrition: The interaction of income and gender of household head. World Development 20(8), 1077–85. doi: 10.1016/0305-750X(92)90001-C
- Labadarios, D, 2007. National Food Consumption Survey – Fortification Baseline (NFCS-FB): South Africa 2005. Directorate of Nutrition, Department of Health, Pretoria.
- Leibbrandt, M, Woolard, I & de Villiers L, 2009. Methodology: Report on NIDS Wave 1. National Income Dynamics Study Technical Paper 1, University of Cape Town, Cape Town.
- Leibbrandt, M, Levinsohn, JA & McCrary, J, 2010a. Incomes in South Africa after the fall of apartheid. Journal of Globalization and Development 1(1). http://www.degruyter.com/view/j/jgd.2010.1.1/jgd.2010.1.1.1023/jgd.2010.1.1.1023.xml Accessed 12 November 2012. doi: 10.2202/1948-1837.1023
- Leibbrandt, M, Woolard, I, Finn, A & Argent, J, 2010b. Trends in South African Income Distribution and Poverty since the Fall of Apartheid. OECD Social Employment and Migration Working Papers 101, OECD Publishing, Paris.
- Nandy, S, Irving, M, Gordon, D, Subramanian, SV & Smith, GD, 2005. Poverty, child undernutrition and morbidity: New evidence from India. Bulletin of World Health Organization 83, 210–6.
- Nannan, N, Norman, R, Hendricks, M, Dhansay, MA, Bradshaw, D & South African Comparative Risk Assessment Collaborating Group, 2007. Estimating the burden of disease attributable to childhood and maternal undernutrition in South Africa in 2000. South African Medical Journal 97, 733–9.
- Ozler, B, 2007. Not separate, not equal: Poverty and inequality in post-apartheid South Africa. Economic Development and Cultural Change 55(3), 487–529. doi: 10.1086/511191
- SALDRU, 2012. National Income Dynamics Study 2008, Wave 1 [dataset]. Version 4.1. Southern Africa Labour and Development Research Unit [producer], DataFirst [distributor], Cape Town.
- Statistics SA, 2002. Earning and Spending in South Africa. Selected Findings and Comparisons from the Income and Expenditure Surveys of October 1995 and October 2000. Statistics South Africa, Pretoria.
- Svedberg, P, 2000. Poverty and Undernutrition: Theory, Measurement and Policy. Oxford University Press, Oxford.
- Timæus, IM, 2012. Stunting and obesity in childhood: A reassessment using longitudinal data from South Africa. International Journal of Epidemiology 41(3), 773–81. doi: 10.1093/ije/dys043
- Timæus, IM, Simelane, S & Letsoalo, T, 2013. Poverty, race, and children's progress at school in South Africa. Journal of Development Studies 49(2), 270–84. doi: 10.1080/00220388.2012.693168
- UNICEF (United Nations International Children's Emergency Fund). 2009. Progress of Nations, Stunting in Children Under Age 5 UNICEF, New York. http://www.unicef.org/pon00/leaguetos1.htm Accessed 15 January 2012.
- Victora, CG, Wagstaff, A, Schellenberg, JA, Gwatkin, D, Claeson, M & Habicht, J-P, 2003. Applying an equity lens to child health and mortality: More of the same is not enough. The Lancet 362(9379), 233–41. doi: 10.1016/S0140-6736(03)13917-7
- Wagstaff, A, 2000. Socioeconomic inequalities in child mortality: Comparisons across nine developing countries. Bulletin of the World Health Organization, 78(1), 19–29.
- Wagstaff, A, Van Doorslaer, E & Paci, P, 1989. Equity in the finance and delivery of health care: Some tentative cross-country comparisons. Oxford Review of Economic Policy 5(1), 89–112. doi: 10.1093/oxrep/5.1.89
- WHO (World Health Organization), 2006. WHO Child Growth Standards: Length/Height-for-age, Weight-for-age, Weight-for-length, Weight-for-height and Body Mass Index-for-age: Methods and Development. World Health Organization, Geneva.
- WHO (World Health Organization), 2009. WHO AnthroPlus for Personal Computers Manual: Software for Assessing Growth of the World's Children and Adolescents. World Health Organization, Geneva.
- Wittenberg, M, 2009. Weights: Report on NIDS Wave 1. NIDS Technical Paper no. 2, National Income Dynamics Study, University of Cape Town, Cape Town.
- World Bank, 2010. Gross National Income Per Capita 2010, Atlas Method and PPP. World Bank, Washington, DC. http://siteresources.worldbank.org/DATASTATISTICS/Resources/GNIPC.pdf Accessed 15 January 2012.
- Yamauchi, F, 2008. Early childhood nutrition, schooling, and sibling inequality in a dynamic context: Evidence from South Africa. Economic Development and Cultural Change 56, 657–82. doi: 10.1086/533542
- Zere, E & McIntyre, D, 2003. Inequities in under-five child malnutrition in South Africa. International Journal for Equity in Health 2, 7. http://www.equityhealthj.com/content/2/1/7 Accessed 6 July 2010. doi: 10.1186/1475-9276-2-7