
Abstract
This paper provides evidence about socioeconomic inequity in inpatient healthcare utilisation in South Africa after 10 years of reform after Apartheid, and examines which are the contributing determinants. We use the South African sample of the World Health Survey from 2002–03 and estimate horizontal inequity in inpatient healthcare utilisation using the concentration index. We further decompose inequity in inpatient care to explore the contribution of the different determinants of use. We find that inpatient healthcare utilisation is found to be pro-rich distributed in South Africa. The rich are more likely to use inpatient healthcare than the poor, given the same level of need. In addition, race is found to be the most important contributor (42%) to socioeconomic inequity in inpatient healthcare utilisation in South Africa. Gender, education and the consumption level are also found to be important contributors, but to a lesser degree than race. Our findings provide evidence that socioeconomic inequity in inpatient healthcare utilisation still exists in post-Apartheid South Africa and that policies, regulations and research should contribute to a more equitable utilisation. The implementation of National Health Insurance could help to reduce the major problems and large (socioeconomic and racial) inequalities of the South African healthcare system.
1. Introduction
At the end of the South African's Apartheid healthcare system, South Africa was among the countries with the highest healthcare expenditure at 8.5% of the gross domestic product in 1992–93 (McIntyre, Citation1995). However, in terms of health indicators the South African population did not even rank among the top 60 in the world due to high infant mortality rates, short life expectancy and high incidence of infectious diseases (Goudge, Citation1999). The poor health status of the South African population was related to an ineffective access to healthcare services during Apartheid due to socioeconomic inequalities in providing healthcare and low efficiency of spending. Consequently, the post-Apartheid government initiated pro-equity policies to improve the population's health status by removing obstacles to access public healthcare services for the poor. This paper aims to investigate whether socioeconomic inequity in inpatient healthcare utilisation disappeared in post-Apartheid South Africa and which determinants contribute to the socioeconomic inequity in inpatient healthcare utilisation.
While a number of studies have addressed inequalities in access to healthcare services in post-Apartheid South Africa, none has focused on socioeconomic inequities in healthcare utilisation and its contributing determinants. For example, Burger et al. (Citation2012) examined the effect of the post-Apartheid policies on the targeting of public spending on health and the consequent access to public hospitals and clinics between 1993 and 2008. They found an increase in the poorest quintile's share of utilisation in both public hospitals and clinics. These improvements in public healthcare utilisation among the poor over time are in line with the evidence shown by McIntyre & Ataguba (Citation2009). In addition, several studies have investigated racial inequalities in post-Apartheid South Africa. They found that the black population was disadvantaged in both health status and the access to healthcare services compared with the non-black population (De Castro & Hirschowitz, Citation1995; Burgard, Citation2004; Charasse-Pouélé & Fournier, Citation2006; Kon & Lackan, Citation2008).
Furthermore, Havemann & Van der Berg (Citation2003) examined the demand for health shortly after the end of Apartheid and were able to estimate some of the effects of demand on healthcare utilisation. They found that three categories of determinants affect the demand for healthcare: demographic and geographic characteristics (e.g. income, race and area of residence), characteristics of the care provided (e.g. cost and travel distance), and characteristics of the illness (such as its severity). This paper expands the literature by examining the determinants of socioeconomic inequity in inpatient healthcare utilisation in post-Apartheid South Africa. To the best of our knowledge, the existing literature has focused on measuring socioeconomic inequalities in healthcare without adjusting the differences in healthcare use between socioeconomic groups by differences in need. We therefore contribute to the existing body of evidence, providing need-adjusted measures of inequity in inpatient care in South Africa. In addition, we examine the importance of several factors in explaining socioeconomic inequity in healthcare utilisation, which allows us to examine the role of race as a contributor to inequity in healthcare utilisation compared with other determinants like gender or education.
Our results show that socioeconomic inequities in inpatient healthcare utilisation still exist in post-Apartheid South Africa. The rich are more likely to use inpatient healthcare than the poor, given the same need. Furthermore, race is found to be the largest contributor to socioeconomic inequities in inpatient healthcare utilisation.
This paper has relevant policy implications for healthcare reform. The analysis presented here can feed discussions around the need for equalising access to healthcare.
2. The South African healthcare system and equity
In the 1940s the South African government intended to implement a countrywide National Health Service available for all people according to their needs, funded by taxation (Gluckman, Citation1947; Roemer, Citation1991). However, when the National Party came to power in 1948 the financial support for the health system reform rapidly declined. The National Party implemented Apartheid, which was a legal system of racial segregation, between 1948 and 1994. Apartheid created discrimination, racism and large disparities between racial groups in terms of socioeconomic status, education, employment, housing and health services (Charasse-Pouélé & Fournier, Citation2006). The South African healthcare system was damaged by racial fragmentation of health services and the deregulation of the health sector (Kautzky & Tollman, Citation2008). Black health services were struggling to provide adequate public healthcare and were inefficient, often ineffectively managed and poorly organised. The segregation of health services by law also created separate departments of health. In addition, there were deficiencies in facilities, health personnel, equipment and funding that resulted in discrimination in access to healthcare. Furthermore, the Apartheid government deregulated the health sector. The privatisation of healthcare resulted in an expansion of hospital-based curative facilities and services (Kautzky & Tollman, Citation2008). As a consequence, low-income groups were further disadvantaged because of increasing financial barriers to use private healthcare (Naylor, Citation1988).
After the end of Apartheid in 1994, the health system was facing key challenges. In the new South Africa, democracy was born and a multiracial government with the African National Congress was elected. The African National Congress published the post-Apartheid model of health system change (ANC, Citation1994). One of the goals was to integrate all separated public health-sector departments into a National Health System. The public healthcare system consists of basic primary healthcare provided in district hospitals and community health centres, which are mainly nurse-driven services in clinics. On the other hand, the private healthcare system includes private hospitals and general practitioners mostly funded by medical schemes. The private sector provides highly specialised hi-tech healthcare services.
Pro-equity policies were initiated throughout the public sector by the post-Apartheid government. The public health sector introduced free maternal and child healthcare in 1994 and was extended in 1996 with free public healthcare for all people using the public health sector. However, the implementation of the policies to reform the healthcare system has been concerned with severe shortages of trained health personnel, inequities in the distribution of resources and health personnel, high medical migration, lacking leadership and deficiencies in the managerial capacity (Kautzky & Tollman, Citation2008). The public health sector is still under-resourced and over-used. In addition, the private health sector attracts most of the South African health professionals and provides healthcare to the middle-income and high-income groups who are members of the medical schemes (18% of the total South African population) and to medical immigrants who look for high-quality healthcare at relatively low prices.
3. Methods and data
3.1 Inequality in healthcare use: Concentration curve and concentration index
In short, a concentration curve plots the cumulative proportion of the population's inpatient healthcare use, ranked by income (or another measure of socioeconomic status) from lowest to highest (see ). The concentration curve would lie above the diagonal (i.e. line of equality) if actual inpatient healthcare utilisation is concentrated among the poor, and it would lie below the diagonal if the actual inpatient healthcare utilisation is concentrated among the rich (Wagstaff et al., Citation1991; Kakwani et al., Citation1997; O'Donnell et al., Citation2008).
Figure 1: Two hypothetical concentration curves of actual inpatient healthcare utilisation
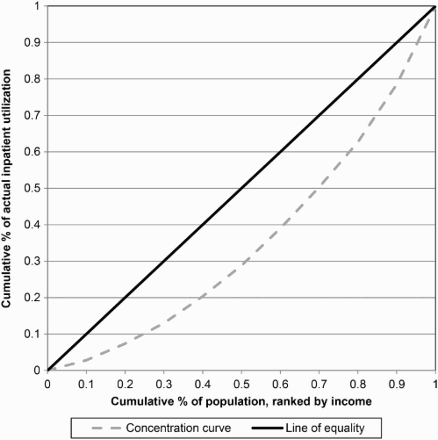
Similar to the Gini index, the concentration index is defined as twice the area between the concentration curve and the diagonal (O'Donnell et al., Citation2008; Van Doorslaer & Van Ourti, Citation2009), but it ranges from –1 to 1. The value of the concentration index takes negative values when use is concentrated among individuals with lower socioeconomic status, and positive values when it is concentrated among individuals with higher socioeconomic status (Wagstaff et al., Citation1989; Kakwani et al., Citation1997; O'Donnell et al., Citation2008). The concentration index can be computed as:(1) where hci is the actual inpatient healthcare utilisation of individual i,
is the average of hci, and
is the fractional rank of socioeconomic status (e.g. income) yi of individual i. The fractional rank is the ranking of individuals from the lowest (i = 1) to highest (i = n) socioeconomic status.
3.2 Horizontal inequity
This paper defines equity as a measure of horizontal equity, which contains equal treatment for equal medical need. According to the definition of horizontal equity, healthcare should be utilised according to need, rather than willingness or ability to pay (Wagstaff & Van Doorslaer, Citation2000). In high-income countries, healthcare use is concentrated among poorer individuals due to their lower health status and therefore greater need for healthcare. One would probably not consider these differences in healthcare use as unjust as long as they are driven by differences in need. In low-income countries, poor individuals use less healthcare compared with the better-off despite their greater need due to the lack of medical schemes among the poor (Gwatkin et al., Citation2003; O'Donnell et al., Citation2008). In this case, individuals in equal medical need do not receive equal treatment. In this setting, the inequality in healthcare use does also not reflect the inequity. Therefore, in order to measure horizontal inequity in healthcare use, we need to standardise for differences in need.
We measure horizontal inequity in inpatient healthcare utilisation using the horizontal inequity index proposed by Wagstaff & Van Doorslaer (Citation2000), which is the difference in the distribution of inpatient healthcare utilisation (i.e. actual use) and the expected distribution of healthcare use given the need for healthcare (i.e. need-predicted use), as follows:
where CI(hc) is the concentration index of actual inpatient healthcare utilisation and CI(need) is the concentration index of need-predicted inpatient healthcare utilisation.
We calculated the horizontal inequity index using the indirect standardisation method, which standardises for partial correlations of the inpatient healthcare utilisation variable with the standardising variables. This means that inpatient healthcare utilisation is not only standardised by need variables, but also controlled by non-need (or non-confounding) variables (Kakwani et al., Citation1997; O'Donnell et al., Citation2008). These non-need variables are added to the linear probability model used to estimate the correlation of the need variables with inpatient healthcare utilisation to avoid omitted variable bias.
A zero value of the concentration index of the horizontal inequity index means that the factor of proportionality (between need-predicted and actual inpatient healthcare utilisation) is equal irrespective of income. Furthermore, a positive (negative) value indicates that horizontal inequity is concentrated among the rich (poor); that is, rich (poor) individuals use more (less) healthcare resources than their relative level of need.
The distribution of healthcare utilisation, such as inpatient and outpatient care, is known to be skewed as a large proportion of the respondents report no use of healthcare services, while few report large values. Non-linear models have been proposed because this violates the assumptions of the standard ordinary least-squares model (for a review see Jones, Citation2000). While a non-linear model has advantages over a linear probability model (LPM), it does not allow a direct application of the (linear) decomposition so one has to use approximations instead (Van Doorslaer et al., Citation2004). Thus, we use a LPM and are confident that our results do not depend on this choice because others (Van Doorslaer et al., Citation2000, Citation2002) have shown that the measurement of horizontal inequity is not sensitive to the use of a LPM instead of using a non-linear model.
3.3 Decomposition of inequity in inpatient care
The concentration index of socioeconomic inequity does not measure which factors are associated with these inequalities. These factors can be obtained via the decomposition method proposed by Wagstaff et al. (Citation2003), which decomposes the concentration index into contributing factors.
We first estimate a linear probability model that links the inpatient healthcare utilisation variable to a set of need variables (xj) and a set of non-need variables (z
k). The concentration index is then decomposed in the contribution of each of its determinants (need and non-need variables) as follows (Wagstaff et al., Citation2003):(3) where
is the mean of inpatient healthcare utilisation (hc),
and
are the specific means of respectively xj and zk, and CIj and CIk are the concentration indices of respectively xj and zk, which are defined analogously to CI(hc). The final term of the equation is the generalised concentration index for the error term (εi), which is the covariance between the error term in the linear probability model and the fractional income rank.
3.4 Dataset and variable definition
This paper uses data from the 2002–03 South African World Health Survey (WHS), which includes information of a representative sample of 2629 adults aged 18 or older who live in a private household in South Africa (WHO, Citation2006).
Our measure of healthcare use is based on any inpatient healthcare use in the five years preceding the survey. Thus, the dependent variable is a dummy variable that takes value one if the person has used any inpatient care in the past five years, and zero otherwise. We use inpatient care only, because the WHS only measures outpatient care in the past year if the respondent has used no inpatient care in the past five years.
The variables used to capture healthcare need are age, gender and a large set of health variables. In order to avoid multicollinearity given the high correlation between the different health variables, and ease of interpreting the results, we use principal component analysis to create two indices for two dimensions of health (Jolliffe, Citation2002). The first index combines 16 variables that measure subjective health status (self-assessed health, and health state dimensions, consisting of mobility, self-care, pain and discomfort, cognition, interpersonal activities, sleep and energy, and affect). We use the first component that explains 44% of the total variance. Moreover, the sign of all the factor loadings is consistent with an index of bad health status. The second index aims to capture more objective health information, as it includes 22 variables capturing the existence of specific diseases (arthritis, angina pectoris, asthma, diabetes, tuberculosis, depression, and schizophrenia) and occurrence of injuries (road traffic and bodily). The first component in this case explains 22% of the total variance. Higher values of both health indices indicate worse health.
We measure living standards or consumption using information about the total expenditures of the household in the past four weeks. It is transformed into equivalent units using the square root of the number of household members (Atkinson et al., Citation1995; OECD, Citation2009). This measure provides us with a distribution of living standards similar to other studies. The Gini index in our sample is 0.703, which is within the range of those reported by Leibbrandt et al. (Citation2010), who estimated that the Gini index was 0.66 in 1993 and increased to 0.70 in 2008.
In addition to the consumption variable, race, education, employment, marital status and area of residence are included as non-need variables. We do not observe the exact race in the sample, but we exploit that there is a large correlation between race and mother tongue in South Africa to identify the black and non-black population. Notice that the non-black group also includes coloureds and Indians, who were also discriminated during Apartheid, although to a lesser extent than blacks. We therefore decided to group them with the whites as non-black. in the supplemental material (please see Table S1, online supplemental material, which is available from the article's Taylor & Francis Online page at http://dx.doi.org/10.1080/0376835X.2014.984374) presents a list of languages that are included within black and non-black populations.
After deleting observations with missing information, the sample used consists of 1609 respondents with 1151 blacks (71.5%) and 458 non-blacks (28.5%). This sample under-represents the black population, since the official population estimates for South Africa show that the black population counts for about 80% of the total South African population in 2002 and 2003 (Statistics South Africa, Citation2002, Citation2003).
4. Results
In this section, we first present descriptive statistics and show the concentration curves, quintile distributions and concentration indices for actual, need-predicted and indirectly standardised inpatient healthcare utilisation. We then present the decomposition results, which show the contributions of the different determinants to the inequity in inpatient healthcare utilisation.
4.1 Descriptive statistics
presents the distribution of the variables included in our model. This table shows statistical differences in the explanatory variables between the subsample that uses inpatient healthcare and the subsample that does not. Inpatient healthcare users are more likely to be female (62% of the sample who uses inpatient healthcare is female compared with 51% of the sample that does not), to be in worse health (both health indices are higher among the sample of users), and to have higher educational attainment but lower equivalent consumption. Last, the share of the black population that uses inpatient healthcare is clearly lower, as only 69% of the population of users is black compared with the 78% of the non-users population.
Table 1: Descriptive statistics – distribution of variables
Employment, marital status and area of residence are dropped from the models shown below as the coefficients are never significant in the LPM. The results are qualitatively similar when those variables were included (results not shown but available upon request).
4.2 Inequity in inpatient healthcare utilisation
shows the three concentration curves of actual, need-predicted and indirectly standardised inpatient healthcare utilisation. First, the concentration curve of actual inpatient healthcare utilisation shows that the poorest 5% does not use any inpatient healthcare (pro-rich), that the poorest 21% uses 21% of the inpatient healthcare (equality) and that, for the remaining 79% of the population, inpatient healthcare utilisation becomes more in favour of the rich again. Second, the concentration curve of need-predicted inpatient healthcare utilisation shows that need is pro-rich distributed among the poorest 5% and slightly pro-poor distributed for the remaining 95% of the population. Third, the concentration curve of indirectly standardised inpatient utilisation shows the inequity. This concentration curve illustrates the difference in inequality between actual and need-predicted inpatient healthcare utilisation. This means that when actual inpatient utilisation is corrected by need, inpatient healthcare utilisation becomes more in favour of the rich (except for the poorest 5%).
Figure 2: Concentration curves of inpatient healthcare utilisation, ranked from poorest to richest by consumption
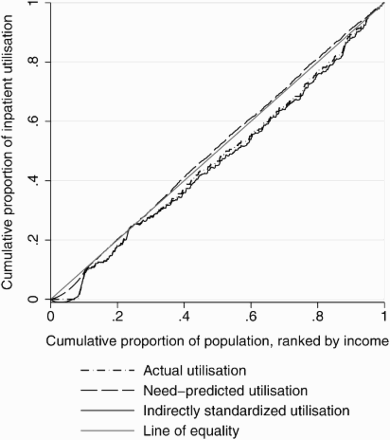
presents the percentage of adults who used any inpatient healthcare in the five years preceding the survey for each consumption quintile and the associated concentration indices for actual, need-predicted and indirectly standardised inpatient healthcare utilisation. The results show that actual use is higher among the higher income groups; that is, 27% of the population in the highest quintile have used inpatient care in the past five years compared with around 20% of the population in the lowest two quintiles. The concentration index of actual healthcare use is indeed positive and statistically significant (CI(hc) = 0.070), which indicates that there is inequality in inpatient healthcare use, so the rich are more likely to have received inpatient healthcare. The results in the second row show the distribution of predicted healthcare use based on the reported need of each of the different quintiles. We find that there are small differences between quintiles in need-predicted inpatient healthcare use; and while the concentration index of need-predicted inpatient care is negative (CI(need) = –0.011), it is not statistically significant. The last row of shows the distribution of inpatient healthcare that is not explained by need. The inequity index (HI(hc) = 0.083) is higher than the inequality index as need-predicted inpatient care is slightly pro-poor. Therefore, we find that inequity in inpatient care is concentrated among the rich in South Africa.
Table 2: Inequalities in inpatient healthcare utilisation
Table 3: Decomposition of concentration index of inpatient healthcare utilisation
4.3 Decomposing inpatient healthcare utilisation
presents the results of the decomposition of socioeconomic inequity. The table includes the coefficients from the LPM, elasticity, concentration index, contribution to the concentration index and contribution in percentages to the total inequality in inpatient healthcare utilisation for each of the determinants.
illustrates that race (i.e. variable black) is the main contributor of inequity in inpatient healthcare use in South Africa, as 42% of the total inequity in inpatient healthcare utilisation is explained by race. The large contribution is due to both a large elasticity and its pro-poor distribution. According to the results from the LPM, the probability of inpatient healthcare use is 11.6 percentage points lower for the black population than the non-black after controlling for all other factors included the model. In addition, the concentration index of the variable black is not only negative, but also the second largest in absolute number (only the concentration index of consumption is larger).
Furthermore, gender, education and consumption are shown to be important contributors to the concentration index of inpatient healthcare utilisation, but to a lesser degree than race. The large contributions of gender and education are driven by the large elasticities of inpatient healthcare utilisation with respect to these determinants (females are 23.4 percentage points more likely to use inpatient healthcare compared with males, and a 1% increase in the number of years of education increases inpatient healthcare use by 0.3%). On the other hand, the contribution of total household expenditures to the concentration index of inpatient healthcare utilisation is due to the large concentration index (0.703) of total household expenditures.
On the other hand, the large elasticities of inpatient healthcare utilisation with respect to age, interaction age and female, and health problem indices 1 and 2 do not contribute to a large extent to the concentration index of inpatient healthcare utilisation, because the concentration indices of these determinants are low compared with the other variables.
Both health problems indices have a significantly positive effect on inpatient healthcare utilisation, denoting that worse health is related to higher use. As expected, the elasticity of both health indices is positive. A 1% increase in the first health index is associated with an increase in the probability of inpatient healthcare use of 0.16%, while the same increase in the second health index increases the probability of inpatient healthcare use by 0.24%. However, the contribution to total inequity is only negative (pro-poor) for the first health index as we find that need measured by the second health index is pro-rich; that is, individuals with higher income have proportionally more health problems as measured by the second health index.
5. Discussion
Governments aim to provide equal access to healthcare for equal need, regardless of any social or financial factors. Our estimates show a pro-rich inpatient healthcare utilisation in South Africa with a health inequity index of 0.083 (significant at 5%). In other words, the inequity in inpatient healthcare utilisation privileges the rich in South Africa. This pattern is not unfamiliar in developing countries. Our findings resonate with Bonfrer et al. (Citation2014), who found a pro-rich inequity in inpatient healthcare utilisation for 17 of 18 African countries using the WHS. In addition, healthcare utilisation was found to be more concentrated among the rich in six countries from the Latin American and Caribbean region, respectively for Brazil, Chile, Colombia, Jamaica, Mexico, and Peru (Almeida et al., Citation2013; Barraza-Lloréns et al., Citation2013; Petrera et al., Citation2013; Ruiz Gómez et al., Citation2013; Scott & Theodore, Citation2013; Vásquez et al., Citation2013). The higher income groups usually have better access to healthcare irrespective of need because of the high proportion of out-of-pocket payments (Falkingham, Citation2004).
In addition, our results show that race contributes for 42% to the socioeconomic inequity in inpatient healthcare utilisation in South Africa, which implies that the influence of the Apartheid era still exists despite the pro-equity policies initiated throughout the public sector. This finding is in accordance with several studies that found racial inequalities disadvantaging the black population in health status and healthcare utilisation in South Africa (De Castro & Hirschowitz, Citation1995; Burgard, Citation2004; Charasse-Pouélé & Fournier, Citation2006; Kon & Lackan, Citation2008).
Our measure of inpatient healthcare use only captures differences in the probability of use, but not on the quality of care. This may be a limitation in studying inequity in care in a country like South Africa where large differences in quality of care between types of hospitals have been reported. For example, Harris et al. (Citation2011) examined the percentage of inpatient and outpatient healthcare users that were dissatisfied with the quality of care provided at public and private hospitals and found higher dissatisfaction rates for public than for private services. A total 19.3% of patients were dissatisfied with the quality of care of public inpatient services compared with 5.1% in private inpatient services. For outpatient services, a similar pattern was found: 22.4% of patients were dissatisfied in public services compared with 9% in private services. Similarly, Coetzee et al. (Citation2013) investigated the difference in nurse-reported quality of care between public and private hospitals in South Africa and found that nurses in private hospitals rated the quality of care higher than in public hospitals. In order to shed some light on whether we could be underestimating the inequity in inpatient care taking into account differences in quality, we estimate a linear probability model to analyse the determinants of the type of use (public or private hospital) among users. The results show that the probability of going to a private hospital is 38 percentage points higher among the non-black population compared with the black population (results not shown but available from the authors upon request). This suggests we are underestimating the inequity in access to inpatient healthcare in South Africa since the quality of care provided in private hospitals is higher than in public hospitals.
Our analysis was constrained to some extent by limitations of the WHS 2002–03 data. Total household expenditure, health and utilisation are asked of respondents as far they could be remembered (Xu et al., Citation2009). The respondent does not have to fill in a diary to keep track of all the household expenditures. This could result in a recall bias when respondents do not remember all the household expenditures in the past four weeks, all health problems in the past year and use of healthcare in the past five years.
In addition, observations of the original racial group variable were not available in the WHS dataset. Therefore, a racial group variable is created after examining the respondent's mother tongue. The different respondent's mother tongues are assigned to the black or the non-black racial group under condition that the particular mother tongue is generally used by respectively the black or the non-black racial group. Thus, we cannot be completely certain that all the individuals are assigned to the correct racial group. The extent that this classification affects our conclusions remains a pending research question. However, our results cast no doubt that there are large inequities in inpatient healthcare use in South Africa and their main contributor is a characteristic highly related to the mother tongue of the individual.
Moreover, another limitation of the data used is that we were restricted to a limited number of healthcare determinants. For example, important drivers of inpatient healthcare utilisation such as medical aid and health insurance were not available in the data, and neither were variables regarding individuals' attitude and knowledge about health and healthcare use. To the extent that these variables are correlated with the determinants included in our model, part of the differences in the contribution of the covariates may be driven by their association with the excluded drivers. The availability of more complete datasets would allow investigating whether the relative contribution of several variables (such as race) remains after controlling for a larger set of controls, and whether the currently missing drivers are contributors to the inequity.
Furthermore, we found that while the distribution of the health index capturing subjective health was pro-poor distributed, the health index measuring objective health was pro-rich distributed. One plausible explanation is that poor individuals are more underdiagnosed compared with those better-off, as has been found in other settings (Johnston et al., Citation2009). As an indirect evidence to test this assumption, we computed the concentration indices for the 22 objective and 15 subjective health measures used to construct the health problems indices. We found that only seven of 22 objective health measures are pro-poor distributed, while 14 of 15 subjective health measures are pro-poor distributed (results available upon request). In addition, as long as the individuals at the bottom part of the income distribution are more unaware of several health problems, they would report better self-reported health compared with the richer individuals with the same health. This would imply that the actual distribution of self-assessed health is even more pro-poor. These two biases would imply that we underestimate the magnitude of the inequity index.
Our findings have important policy implications. We found that low-income groups are less likely to use inpatient care and that race is an important determinant to explain socioeconomic inequity in inpatient healthcare utilisation in South Africa. The inequity is not only caused by the fact that the blacks are the poorest of the population, differences in elasticity are also found to be important. Therefore, the barriers to access healthcare for the poor and black should be removed. We recommend policies that are targeted on the poor and black population to equalise the access to healthcare.
In addition, we recommend further research that investigates racial differences with a special focus on whether these differences are caused by discrimination between the racial groups. Further research is also necessary to confirm our assumption that the pro-rich distribution of objective health measures is caused by the pro-rich distribution of healthcare utilisation. In addition, further research, new policies and regulations should focus on the determinants of socioeconomic inequity, such as education to improve unequal access to healthcare.
In this paper we only look at the inequity in inpatient healthcare utilisation, which is pro-rich distributed in South Africa. However, we found that race is the main driver of socioeconomic inequity. Since racial inequalities in health and other types of healthcare utilisation are found by other studies, we expect that the overall use of the South African healthcare system is pro-rich distributed.
6. Conclusions
A pro-rich distribution of inpatient healthcare utilisation is found after standardising for need and controlling for non-need determinants. Race is found to be the largest contributor (42%) to the socioeconomic inequity in inpatient healthcare utilisation. Furthermore, gender, education and consumption are also found to be important contributors to the concentration index of inpatient healthcare utilisation, but to a lesser degree than race. The main aim of this study was to examine whether socioeconomic inequities in inpatient healthcare utilisation have disappeared in post-Apartheid South Africa and which determinants contribute to the socioeconomic inequity in healthcare utilisation. We have provided new insights about the existence and determinants of socioeconomic inequities in healthcare utilisation in post-Apartheid South Africa.
During Apartheid, public and private healthcare services were used according to the ability to pay and not according to need. The major problem of the healthcare system more than 15 years after the end of Apartheid is that, first, the public healthcare –which is made free of cost after Apartheid– is under-resourced and over-used, and, second, the use of the highly specialised care of the private health sector is only affordable for the middle and high incomes.
Despite the attempts to implement a National Health Insurance (NHI) by the South African government to ensure equitable access to necessary healthcare since 1994, we found that socioeconomic inequity in healthcare utilisation in South Africa still exists (Ataguba & Akazili, Citation2010; DoH, Citation2012). The NHI was proposed to achieve universal coverage for all South African citizens since 1994 (Ataguba & Akazili, Citation2010; DoH, Citation2012). However, lack of political support and the uncooperative role of stakeholders have resulted in non-implementation. As a result, the South African healthcare system is challenging major problems. Although South Africa has the highest total per-capita health spending in Africa, the distribution between public and private spending relative to the populations served is dominated by private spending. In addition, the funds cover mostly those who contribute to the medical schemes, the schemes are fragmented with little risk of cross-subsidisation across schemes, and additional out-of-pocket payments and co-payments are required for members of the schemes. The implementation of NHI could therefore help to reduce the major problems and inequalities of the South African healthcare system. Special attention should be paid to the causes of non-implementation since 1994 and the determinants that contribute to inequity in healthcare use to successfully implement the NHI in South Africa.
Key messages
Despite the attempts to implement pro-equity policies and NHI by the post-Apartheid South African government, the rich are still more likely to use inpatient healthcare than the poor, given the same level of need.
Race is found to be the most important contributor (42%) to the socioeconomic inequity in inpatient healthcare utilisation in South Africa.
The implementation of NHI could help to reduce the major problems and large (socioeconomic and racial) inequalities of the South African healthcare system.
Supplemental data
Supplemental data for this article can be accessed at http://dx.doi.org/10.1080/0376835X.2014.984374
Table S1: List of languages that are included within black and non-black populations
Figure S1: Inequity in inpatient healthcare.
Download MS Word (19.2 KB)Acknowledgements
The authors are grateful to Eddy Van Doorslaer, Ellen Van de Poel, Clarissa Meerts and Caryn Bredenkamp for their useful comments. García-Gómez acknowledges financial support from the Netherlands Organisation for Scientific Research under the Innovational Research Incentives Scheme – VENI. The usual disclaimer applies.
References
- Almeida G, Sarti, FM, Ferreira, FF, Diaz, DDM & Campino, ACC, 2013. Analysis of the evolution and determinants of income-related inequalities in the Brazilian health system, 1998–2008. Pan American Journal of Public Health 33(2), 90–7. doi: 10.1590/S1020-49892013000200003
- ANC (African National Congress), 1994. A National Health Plan for South Africa. African National Congress, Johannesburg. www.anc.org.za/show.php?id=257 Accessed 22 November 2012.
- Ataguba, JE & Akazili, J, 2010. Health care financing in South Africa: Moving towards universal coverage. Continuing Medical Education 28(2), 74–8.
- Atkinson, AB, Rainwater, L & Smeeding, TM, 1995. Income distribution in OECD countries. OECD Social Policy Studies 18, OECD, Paris.
- Barraza-Lloréns, M, Panopoulou, G & Díaz, BY, 2013. Income-related inequalities and inequities in health and health care utilization in Mexico, 2000–2006. Pan American Journal of Public Health 33(2), 122–30. doi: 10.1590/S1020-49892013000200007
- Bonfrer, I, Van de Poel, E, Grimm, M & Van Doorslaer, E, 2014. Does the distribution of health care utilization match needs in Africa? Health Policy and Planning. 29(7), 921–37. doi: 10.1093/heapol/czt074
- Burgard, S, 2004. Race and pregnancy-related care in Brazil and South Africa. Social Science & Medicine 59(6), 1127–46. doi: 10.1016/j.socscimed.2004.01.006
- Burger, R, Bredenkamp, C, Grobler, C & Van der Berg, S, 2012. Have public health spending and access in South Africa become more equitable since the end of apartheid? Development Southern Africa 29(5), 681–703. doi: 10.1080/0376835X.2012.730971
- Charasse-Pouélé, C & Fournier, M, 2006. Health disparities between racial groups in South Africa: A decomposition analysis. Social Science & Medicine 62(11), 2897–914. doi: 10.1016/j.socscimed.2005.11.020
- Coetzee, SK, Klopper, HC, Ellis, SM & Aiken, LH. 2013. A tale of two systems – nurses practice environment, wellbeing, perceived quality of care and patient safety in private and public hospitals in South Africa: A questionnaire survey. International Journal of Nursing Studies 50(2), 162–73. doi: 10.1016/j.ijnurstu.2012.11.002
- De Castro, J & Hirschowitz, R, 1995. A National Household Survey of Health Inequalities in South Africa: The Community Agency for Social Inquiry. Health Systems Trust and The Kaiser Family Foundation, Durban.
- DoH (Department of Health). 2012. National Health Insurance. Department of Health, Pretoria. www.doh.gov.za/list.php?type=National20Health20Insurance Accessed 4 February 2013.
- Falkingham, J, 2004. Poverty, out-of-pocket payments and access to health care: Evidence from Tajikistan. Social Science & Medicine 58(2), 247–58. doi: 10.1016/S0277-9536(03)00008-X
- Gluckman, H, 1947. The National Health Council. South African Medical Journal 21, 643–8.
- Goudge, J, 1999. The public–private mix. In Crisp, N & Ntul, A (Eds.), South African Health Review 1999. Health Systems Trust, Durban.
- Gwatkin, DR, Rustein, S, Johnson, K, Pande, R & Wagstaff, A, 2003. Initial Country-level Information about Socio-Economic Differentials in Health, Nutrition and Population, Volumes I and II. World Bank, Washington, DC.
- Harris, B, Goudge, J, Ataguba, JE, McIntyre, D, Nxumalo, N, Jikwana, S & Chersich, M, 2011. Inequities in access to health care in South Africa. Journal of Public Health Policy 32(1), S102–23. doi: 10.1057/jphp.2011.35
- Havemann, R & Van der Berg, S, 2003. The demand for health care in South Africa. Journal for Studies in Economics & Econometrics 27(3), 1–27.
- Johnston, DW, Propper, C & Shields, MA, 2009. Comparing subjective and objective measures of health: Evidence from hypertension for the income/health gradient. Journal of Health Economics 28(3), 540–52. doi: 10.1016/j.jhealeco.2009.02.010
- Jolliffe, IT, 2002. Principal Component Analysis. Springer, Aberdeen.
- Jones, AM, 2000. Health econometrics. In Culyer, AJ & Newhouse, JP (Eds.), Handbook of Health Economics. Elsevier, Amsterdam, pp. 265–344. doi: 10.1016/S1574-0064(00)80165-1
- Kakwani, NC, Wagstaff, A & Van Doorslaer, E, 1997. Socioeconomic inequalities in health: Measurement, computation and statistical inference. Journal of Econometrics 77(1), 87–104. doi: 10.1016/S0304-4076(96)01807-6
- Kautzky, K & Tollman, SM, 2008. A perspective on primary health care in South Africa. In Barron, P & Roma-Reardon, J (Eds.), South African Health Review 2008. Health Systems Trust, Durban.
- Kon, ZR & Lackan, N, 2008. Ethnic disparities in access to care in post-Apartheid South Africa. American Journal of Public Health 98(12), 2272–7. doi: 10.2105/AJPH.2007.127829
- Leibbrandt, M, Woolard, I, Finn, A & Argent, J, 2010. Trends in South African income distribution and poverty since the fall of Apartheid. OECD Social, Employment and Migration Working Papers 101, OECD, Paris. doi: 10.1787/5kmms0t7p1ms-en
- McIntyre, D, 1995. Demand side and cost factors affecting the affordability of a National Health Insurance system. Briefing document prepared for the Committee of Inquiry into and National Health Insurance. Department of Health, Pretoria.
- McIntyre, D & Ataguba, J, 2009. Financing and benefit incidence in the South African health system: Preliminary results. Working Paper 09-1, Health Economics Unit, School of Public Health and Family Medicine, University of Cape Town, South Africa.
- Naylor, CD, 1988. Private medicine and the privatization of health care in South Africa. Social Science & Medicine 27(11), 1153–70. doi: 10.1016/0277-9536(88)90345-0
- O'Donnell, O, Van Doorslaer, E, Wagstaff, A & Lindelow, M, 2008. Analyzing Health Equity Using Household Survey Data: A Guide to Techniques and their Implementation. World Bank, Washington, DC.
- OECD (Organisation for Economic Co-operation and Development), 2009. What are equivalence scales? OECD Project on Income Distribution and Poverty, OECD, Paris.
- Petrera, M, Valdivia, M, Jimenez, E & Almeida, G, 2013. Equity in health and health care in Peru, 2004–2008. Pan American Journal of Public Health 33(2), 131–6. doi: 10.1590/S1020-49892013000200008
- Roemer, MI, 1991. National Health Systems of the World – Volume II: The issues. Oxford University Press, New York.
- Ruiz Gómez, F, Zapata Jaramillo, T & Garavito Beltrán, L, 2013. Colombian health care system: Results on equity for five health dimensions, 2003–2008. Pan American Journal of Public Health 33(2), 107–15. doi: 10.1590/S1020-49892013000200005
- Scott, E & Theodore, K, 2013. Measuring and explaining health and health care inequalities in Jamaica, 2004 and 2007. Pan American Journal of Public Health 33(2), 116–21. doi: 10.1590/S1020-49892013000200006
- Statistics South Africa, 2002. Midyear estimates: Statistical release P0302. Statistics South Africa, Pretoria.
- Statistics South Africa, 2003. Midyear estimates: Statistical release P0302. Statistics South Africa, Pretoria.
- Van Doorslaer, E & Van Ourti, T, 2009. Measuring inequality and inequity in health and health care. In Glied, S & Smith, PC (Eds.), Oxford Handbook on Health Economics. Oxford University Press, Oxford.
- Van Doorslaer, E, Wagstaff, A, Van der Burg, H, Christiansen, T, De Graeve, D, Duchesne, I, Gerdtham, UG, Gerfin, M, Geurts, J, Gross, L, Häkkinen, U, John, J, Klavus, J, Leu, RE, Nolan, B, O'Donnell, O, Propper, C, Puffer, F, Schellhorn, M, Sundberg, G & Winkelhake, O, 2000. Equity in the delivery of health care in Europe and the US. Journal of Health Economics 19(5), 553–83. doi: 10.1016/S0167-6296(00)00050-3
- Van Doorslaer, E, Koolman, X & Puffer, F, 2002. Equity in the use of physician visits in OECD countries: Has equal treatment for equal need been achieved? In Measuring Up: Improving Health Systems Performance in OECD Countries. OECD, Paris, pp. 225–48.
- Van Doorslaer, E, Koolman, X & Jones, AM, 2004. Explaining income related inequalities in doctor utilisation in Europe. Health Economics 13(7), 629–47. doi: 10.1002/hec.919
- Vásquez, F, Paraje, G & Estay, M, 2013. Income-related inequality in health and health care utilization in Chile, 2000–2009. Pan American Journal of Public Health 33(2), 98–106. doi: 10.1590/S1020-49892013000200004
- Wagstaff, A & Van Doorslaer, E, 2000. Equity in health care finance and delivery. In Culyer, AJ & Newhouse, JP (Eds.), Handbook of Health Economics. North-Holland, Amsterdam, pp. 1803–62.
- Wagstaff, A, Van Doorslaer, E & Paci, P, 1989. Equity in the finance and delivery of health care: Some tentative cross-country comparisons. Oxford Review of Economic Policy 5(1), 89–112. doi: 10.1093/oxrep/5.1.89
- Wagstaff, A, Van Doorslaer, E & Paci, P, 1991. On the measurement of horizontal inequity in the delivery of health care. Journal of Health Economics 10(2), 169–205. doi: 10.1016/0167-6296(91)90003-6
- Wagstaff, A, Van Doorslaer, E & Watanabe, N, 2003. On decomposing the causes of health sector inequalities with an application to malnutrition inequalities in Vietnam. Journal of Econometrics 112(1), 207–23. doi: 10.1016/S0304-4076(02)00161-6
- WHO (World Health Organization). 2006. WHS-SouthAfrica. World Health Organization, Geneva. surveydata.who.int/WHS-SouthAfrica.htm Accessed 10 September 2012.
- Xu, K, Ravndal, F, Evans, DB & Carrin, G, 2009. Assessing the reliability of household expenditure data: Results of the World Health Survey. Health Policy 91(3), 297–305. doi: 10.1016/j.healthpol.2009.01.002