
Abstract
The 1999 October Household Survey was the first time that Statistics South Africa introduced a master sample of Enumeration Areas. There were several important changes in sampling and fieldworker practice that accompanied the introduction of the master sample of Enumeration Areas, which have not been systematically documented and which make comparability of the surveys undertaken by Statistics South Africa before and after this time difficult. We document these changes in this research note and provide evidence that these changes were partly responsible for the odd trends in the total number of single-person households estimated from the October Household Surveys and the Labour Force Surveys, as well as rapid increases in employment, in the late 1990s.
1. Introduction
The 1999 October Household Survey was the first time that Statistics South Africa (Stats SA) introduced a master sample of Enumeration Areas (EAs) (Stats SA, Citation2000a). There were several important changes in sampling and fieldworker practice that accompanied the introduction of the master sample of EAs, which have not been systematically documentedFootnote3 and which make comparability of the surveys undertaken by Stats SA before and after this time difficult. We document these changes in this research note and provide evidence that these changes were partly responsible for the odd trends in the total number of single-person households estimated from the October Household Surveys (OHSs) and the Labour Force Surveys (LFSs), noted in Wittenberg & Collinson (Citation2007) and Pirouz (Citation2005), as well as rapid increases in employment, in the late 1990s.
The changes in sampling and fieldworker practice we document are also important because the OHSs and LFSs are the primary data source over this period for economists interested in the South African labour market and because most of the work that has been done on the South African labour market uses these surveys (Casale et al., Citation2004; Bhorat & Oosthuizen, Citation2006; Wittenberg & Pirouz, Citation2013; Yu, Citation2013a; Burger et al., Citation2015).Footnote4 Previous research has highlighted the importance of weighting procedures (Branson & Wittenberg, Citation2014), changes in questionnaire design (Casale et al., Citation2004), education policies (Burger et al., Citation2015) and real changes in the labour market in arriving at estimates of total employment and other labour market indicators. Our research highlights that changes in sampling and fieldwork may also affect these indicators.
The changes we note are also likely to have important implications for poverty and inequality trends because the 1995 Income and Expenditure Survey (IES) sample, fieldwork and sampling procedures were identical to the OHS 1995 and these differed from later IES sampling procedures and fieldwork. The IES 1995 has been the basis of many poverty analyses and thus these changes are also likely to affect estimated poverty and inequality trends that use IES 1995. However, the large number of other changes that occurred between the IESs (e.g. the change from the recall to diary method and changes in categorisation of items; Yu, Citation2013b) and the small number of surveys that can be used to estimate trends mean it is much harder to pin down the effects of sampling changes on poverty and inequality trends. We thus focus on the effects of these changes on the labour market and household size in this paper.
2. Changes in fieldwork practice and sampling methodology
The master sample was a database of EAs from the 1996 census, and was used by Stats SA to sample EAs for the 1999 OHS and the subsequent LFSs and General Household Surveys. Prior to OHS 1999, fieldworkers were responsible for listing all dwellings in a particular EA selected for the survey and then for drawing a random sample of 10 households themselves (Stats SA, Citation1996). With the introduction of the master sample in OHS 1999, however, Stats SA office staff kept up-to-date listings of each EA selected as part of the master sample, which included numbering each dwelling unit in these EAs. Several samples of 10 dwelling units from the same EA were then selected by statisticians in Stats SA's methodology unit for use in a number of surveys from OHS 1999 onwards (until a new master sample was selected) and fieldworkers were instructed to visit only the 10 dwelling units selected for each survey (Buwembo, Citation2010; Buwembo, personal communication with the authors, 2012), rather than do the listing and sampling themselves in a new EA for every survey, as had occurred pre-OHS 1999 (Stats SA, Citation1996).Footnote5
A major change to the sampling methodology in 1999 was that OHS 1999 was the first year in which dwelling units at which there was more than one household present had all households at that dwelling unit sampled (Buwembo, Citation2010; Buwembo, personal communication with the authors, 2012). Prior to this, only one household per dwelling unit was sampled, meaning that not all households in an EA had an equal probability of selection. The 1996 fieldworker manual states that fieldworkers should randomise which household would be selected at dwelling units with multiple households present (Stats SA, Citation1996). Buwembo (Citation2010) describes this method as selection using probability proportional to size, because the method of randomisation given in the fieldworker manual implies that larger households were much more likely to be enumerated than small households (Stats SA, Citation1996:7–8). For example, the random number table from the OHS 1996 fieldwork manual suggests that if two households were present at one dwelling unit, one of size 1 and one of size 4, then there was only a 20% chance of selecting the smaller household.
A second major change was that substitution was disallowed from OHS 1999 onwards. The early OHS questionnaires allowed space for the enumerator to write in a substitute household number. The OHS 1996 fieldworker manual confirms this, noting that each household selected should be visited three times before an enumerator asks permission from their supervisor to substitute a household (Stats SA, Citation1996:7). The introduction of the master sample in OHS 1999 meant that substitution of households was no longer permitted. This was because Stats SA would not have wanted fieldworkers interviewing additional households from the same EA as substitutes when these households might have been selected for a future sample in another survey using the same master sample.
3. A description of the effects of changes in fieldwork and sampling methodology
In all of the OHSs and LFSs from 1994 to 2007, Stats SA used a two-stage sample design. The country was divided up into EAs and in all of the surveys from OHS 1995 to LFS 2007:2, except February 2000, Stats SA targeted 10 households per EA for enumeration. Despite the same number of households per EA being targeted in all these surveys, shows a dramatic difference in the actual number of households enumerated per EA between the earlier OHSs on one hand and OHS 1999 and the LFSs on the other. shows that 95% of EAs had 10 households enumerated in OHS 1995–OHS 1998 but that in the later surveys only around 35% of EAs had 10 households enumerated in them and there are many EAs with either a larger or smaller number of households per EA, as a result of interviewing several households at multiple household dwelling units or non-response respectively.
Figure 1: Distribution of households per EA in OHS 1995–OHS 1998 and OHS 1999–LFS September 2007
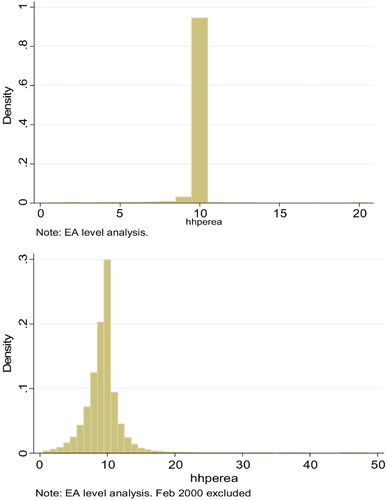
The sampling changes resulting from the introduction of the master sample imply that, whilst the percentage of households enumerated at multiple household dwelling units should be much lower in the early OHSs (because only one household was actually then enumerated at each of these dwelling units prior to OHS 1999), the percentage of dwelling units containing multiple households should not be any different before or after the introduction of the master sample. But it turns out that this is not the case – fieldworkers reporting dwelling units containing multiple households is less common in the pre-master sample period, at least where we can investigate this.
In the pre-master sample OHSs we have information on the number of households at a dwelling unit for OHS 1995, from the ‘hspnt_no’ variable, and in OHS 1996, from the ‘hhnumber’ variable.Footnote6 In OHS 1995 only 2% of the dwelling units were reported to contain multiple households, and only 1.3% in OHS 1996. There is no information for OHS 1997 and OHS 1998. There is information from OHS 1999 onwards and the percentage varies from between 3.77% in LFS 2002:2 and 8.71% in LFS 2002:1. The variation is itself a potentially worrying phenomenon but it is always much higher than in the early OHSs, with an average of 5.64% of dwelling units having multiple households reported between OHS 1999 and LFS 2007:2 inclusive, as the second to last column of shows.
Table 1: Single-person households, average household size and multiple household dwelling units
We noted above that there was a change in control over dwelling unit selection from fieldworkers to office staff after the introduction of the master samples. Given this change in control, that the fieldworkers were paid by questionnaire completed, one for each household (Stats SA, Citation1996), and that multiple household dwelling units required extra work for only one questionnaire (including finding out the household size from each household at the dwelling point selected; Stats SA, Citation1996)), this is likely to have reduced incentives to report multiple households at dwelling units and may explain the low reported numbers of multiple household dwelling units reported before OHS 1999. However, without investigation of fieldworker incentives we cannot firmly pin down the cause of this increase.
3.1 The impact of ‘probability proportional to size' sampling of households at multiple household dwelling units
Ignoring the possible under-reporting of dwelling units with multiple households, we now explore whether the correct weights were calculated for households enumerated at multiple household dwelling units in the early OHSs, given the ‘probability proportional to size’ method of sampling when a multiple household dwelling unit was found. If the data were weighted correctly then we should find that households selected from dwelling units where there were multiple households have much higher weights.
The first column of shows the results from a regression of the original Stats SA household weight in OHS 1995 on a multiple household dwelling unit dummy with cluster fixed effects. The results give a value for the constant of 305 but only 5.75 for the multiple household dummy coefficient with a standard error of 4.95. If the data were correctly weighted, the dummy coefficient would have a value higher than the constant and be highly significant. That it is not much above zero implies that the sampling and weighting method produced an undercount of all households at multiple household dwelling units, and an even larger undercount for small households. Column 2 shows that OHS 1996 weights were not adjusted at all within clusters, again suggesting that no weighting correction was undertaken if more than one household was found at a visiting point.
Table 2: Household weight regressions
We can also examine this issue in OHS 1997 and OHS 1998, although only indirectly, by looking at whether households living in backyard shacks had higher weights. By the definition of a backyard shack, these households were located at dwelling units with more than one household present, so if the sampling method is correct then the weights should again be adjusted upwards when a household living in a backyard shack was enumerated. Columns 3 and 4 in show the results of regressions of the household weight on a backyard shack dummy while allowing for cluster fixed effects. The results show that these households did not have higher weights – in fact, in OHS 1997 and OHS 1998 backyard households even have slightly lower weights.
It is clear from this analysis that, despite a sampling method in the pre-1999 OHSs that systematically decreased the probability of households at multiple household dwelling units being sampled and further decreased the probability of small households at multiple household dwelling units being sampled, there was no corresponding increase in the weights of the households at multiple household dwelling units that were sampled. Together with possible under-enumerating of dwelling units containing multiple households, mentioned above, this led to an undercount of households (particularly small households) at multiple household dwelling units prior to the introduction of the master sample. The combined effect is shown in the last column of . The weighted percentage of households coming from multiple household dwelling units is 2.4% in OHS 1995, only 1.4% in OHS 1996 and an average of 12% in OHS 1999 and the LFSs, with a maximum of 19% in LFS March 2002. This suggests that a very different set of households makes up the population in the early OHSs, on the one hand, and OHS 1999 and the LFSs on the other.
4. Applications: increases in single-person households and employment
Clearly the changes in sampling methodology and fieldwork practice that we have described may have important consequences for discussions of trends in several important series derived from the survey data. Here we link our analysis above with observed changes in household size in the OHS and LFS data and with increases in employment.
Between October 1997 and February 2000, OHS and LFS data show an increase from about 10% to 20% in the weighted proportion of single-person households. This represents an improbable increase from 1.3 million to 2.3 million one person households in 2.5 years and contributed to a large decrease in average household size, as shows.
Wittenberg & Collinson (Citation2007) show that the growth rate in single-person households was much lower in the Agincourt Demographic Surveillance Site and suggested this might be due to changes in sample frames or household definitions in the OHSs and LFSs. The census data also suggest the increases in single-person households in the OHS and LFS are too large. shows that the 1996 and 2001 censuses found roughly 1.7 and 2.5 million single person households respectively, and by 2001 the number of households using the LFS data was roughly the same as the census, suggesting a large undercount in the earlier OHSs. We argue here that this was partly the result of the sampling methods employed in the early OHSs – where smaller households were much less likely to be chosen at multiple household dwelling units and, as we showed above, not weighted up to compensate for this method of selection.
It should be pointed out that the increase in single-person households actually started between OHS 1997 and OHS 1998, a year earlier than the change in the sample methods; this is probably due to the lack of coverage of hostels in OHS 1996 and OHS 1997 that is mentioned in the OHS 1998 release (Stats SA, Citation2000b), which meant a very large undercount of hostel dweller households, which are much more likely to be single-person households. To illustrate this, Census 1996 found 567 000 hostel dwellers who were single-person households (those living in hostels in households of size larger than one were enumerated through the household questionnaire and cannot be directly identified as living in a hostel). In contrast, the OHS 1996 data suggest there were only 88 000 single-person households living in a ‘room in a hostel or compound’, a figure that is comparable with the Census 1996 figure above, implying an undercount by a factor of six in OHS 1996. Thus not only were early OHS sampling methods undercounting small households, but fieldwork difficulties further contributed to the undercount of mostly small, hostel dwelling households in OHS 1996 and OHS 1997.
The rapid increase in single-person households also contributed to increases in total employment. Total employment rose rapidly in the late 1990s – growing by 2.1 million, about 22%, between October 1997 and September 2001, as shown in .Footnote7 The growth in employment in single-person households was around 45% of the total growth in employment over this period, despite the employed in single-person households only making up 15% of the employed at the end of the period and 8.6% at the start. also shows that total employment growth in single-person households was 115% over this period, compared with an employment growth rate for households with more than one person of 13%.
Table 3: Employment in the OHSs and LFSs by gender and for single-person households
Interestingly, although the growth rate of employment in single-person households was high for both men and women, it was much higher for women – employment growth for women living by themselves was 310%, compared with 83% growth for men living by themselves (see ). The rapid increase in the measured number of employed women living on their own accounts for about 27% of the increase in female employment over the period. Despite this, and because of the larger number of men living alone relative to women, increases in single-person household employment were dominated by men living by themselves – male employment made up just under two-thirds of the growth in employment in single-person households.
5. Conclusion
In this research note we have highlighted important changes made by Stats SA in its sampling methods and fieldworker practice that first occurred in OHS 1999. The introduction of a master sample led to a change in control over sample selection from fieldworkers to Stats SA office staff, possibly leading to increased reporting of dwelling units with multiple households by fieldworkers. The introduction of the master sample also meant substitutions were no longer allowed and that all households at multiple household dwelling units were sampled. This last change, together with the underweighting of households at multiple household dwelling units before the master sample that we have shown above, probably explains a substantial part of the implausibly large increase in single-person households from October 1997 to February 2000. We have also shown that it explains some of the increases in employment around the late 1990s and early 2000s. The under-sampling of hostels in OHS 1996 and OHS 1997 also contributes to the rapid increase in single-person households and employment over this period. The sampling changes first introduced with the master sample in OHS 1999 were an improvement on the methods used in the earlier OHSs but make comparisons between the two periods more difficult. More detailed work is required to understand how these changes may have affected other important trends derived from the OHS and LFS data.
Acknowledgements
The authors thank Cally Ardington from Southern Africa Labour and Development Research Unit for her suggestion to explore the number of households per EA in different surveys, which helped lead to some of the findings reported in this paper, and Peter Buwembo from Stats SA for explaining the multiple household dwelling point sampling methods and for sourcing the OHS 1996 fieldworker manual.
Disclosure statement
No potential conflict of interest was reported by the authors.
Notes
3Hodge (Citation2009) comments that the introduction of the master sample may have affected the estimates of total employment in the October Household Surveys, but did not investigate this any further. Buwembo (Citation2010) explains how multi-household dwelling points were sampled differently before the introduction of the master sample but does not document the other changes we describe here.
4The Quarterly Labour Force Surveys replaced the LFSs in 2008. As far as we are aware there were no major sampling changes between the LFS and the Quarterly Labour Force Surveys, so we concentrate on the OHSs and LFSs in this article.
5Stats SA (Citation2005:xxiv) defines a dwelling unit as ‘any structure or part of a structure or group of structures occupied by one or more than one household; or which is vacant or under construction but could be lived in at the time of the survey. The dwelling unit is the major listing unit for this survey'. In the early OHSs, dwelling units were called visiting points.
6According to the OHS questionnaires these data were collected in every wave of the OHSs before 1999. Unfortunately this was not made available in the public release data for OHS 1997 and OHS 1998.
7The increase was even larger if the end point was any of the first three LFSs, but these were outliers affected by massive measured subsistence agricultural employment (in the first two LFSs) that was never repeated in any subsequent LFS (and was not related to the changes in sampling and fieldwork we discuss here, which occurred in OHS 1999 and not with the introduction of the LFSs) and massive informal self-employment (in the third LFS) as a result of monetary incentives paid to enumerators to conduct the follow-up Survey of Employers and Self-employed. Thus, we compare OHS 1997 and LFS September 2001.
References
- Bhorat, H & Oosthuizen, M, 2006. Evolution of the labour market: 1995–2002. In Bhorat, H & Kanbur, K (Eds.), Poverty and policy in post-apartheid South Africa. HSRC Press, Pretoria, pp. 143–200.
- Branson, N & Wittenberg, M, 2014. Reweighting South African national household survey data to create a consistent series over time: A cross-entropy estimation approach. South African Journal of Economics 82(1), 19–38. doi: 10.1111/saje.12017
- Burger, R, van der Berg, S & von Fintel, D, 2015. The unintended consequences of education policies on South African participation and unemployment. South African Journal of Economics 83(1), 74–100. doi: 10.1111/saje.12049
- Buwembo, P, 2010. Factors associated with under-5 mortality in South Africa: Trends 1997–2002. Unpublished MSocSci thesis, University of Pretoria.
- Casale, D, Muller, C & Posel, D, 2004. Two Million net new jobs’: A reconsideration of the rise in employment in South Africa, 1995–2003. South African Journal of Economics. 72(5), 978–1002. doi: 10.1111/j.1813-6982.2004.tb00141.x
- Hodge, D, 2009. Growth, employment and unemployment in South Africa. South African Journal of Economics 77(4), 488–504. doi: 10.1111/j.1813-6982.2009.01226.x
- Pirouz, F, 2005. Have labour market outcomes affected household structure in South Africa? DPRU Working Paper No 05/100. Development Policy Research Unit, Cape Town.
- Stats SA (Statistics South Africa), 1996. October household survey 1996 manual for fieldworkers. Electronic copy obtained from Peter Buwembo at Statistics South Africa.
- Stats SA (Statistics South Africa), 2000a. Statistical release P0317, October household survey 1999. https://www.datafirst.uct.ac.za/dataportal/index.php/catalog/64 Accessed 11 April 2014.
- Stats SA (Statistics South Africa), 2000b. Statistical release P0317, October household survey 1998. https://www.datafirst.uct.ac.za/dataportal/index.php/catalog/63 Accessed 11 April 2014.
- Stats SA (Statistics South Africa), 2005. Statistical release P0210, labour force survey September 2005. https://www.statssa.gov.za/publications/P0210/P0210September2005.pdf Accessed 11 April 2014.
- Wittenberg, M & Collinson, M, 2007. Household transitions in rural South Africa, 1996–2003. Scandinavian Journal of Public Health Supplement 69, 130–7. doi: 10.1080/14034950701355429
- Wittenberg, M & Pirouz, F, 2013. The measurement of earnings in the post-Apartheid period: An overview. SALDRU Working Paper Number 108.
- Yu, D, 2013a. Revisiting unemployment levels and trends in South Africa since the transition. Development Southern Africa 30(6), 701–23. doi: 10.1080/0376835X.2013.830242
- Yu, D, 2013b. Some factors influencing the comparability and reliability of poverty estimates across household surveys. Working Papers 03/2013, Stellenbosch University, Department of Economics.