
Abstract
In 2014 democracy in South Africa was 20 years old. The democratic government in 1994 inherited both a high and increasing public debt/gross domestic product ratio and significant development backlogs. The government had to establish fiscal sustainability, yet also pursue development in a sustainable way. This article explores the government's performance in reconciling fiscal sustainability with sustainable development. The article shows that fiscal policy has been sustainable over the 20 years, with some risks appearing towards the end, and that the government pursued sustainable development through reallocating resources within the budget and by spending more in real terms. Three phases can be identified: 1994–2000, 2001–08 and 2009–13. However, poor service delivery and low levels of government investment during the 20 years threaten to undermine economic growth. Lower growth consequently threatens the sustainability of both fiscal policy and development, which, in turn, again undermines growth prospects. Hence, the article also identifies key future challenges.
1. Introduction
This article considers the attainment of fiscal sustainability in South Africa as a necessary condition for sustained development. The article surveys the development of the macro and micro dimensions of fiscal policy since 1994 in Musgravian terms, distinguishing between the stabilisation, efficiency and equity roles of government.Footnote3 Against this backdrop the paper considers two questions:
To what extent did the (un)sustainability of fiscal policy affect the sustainability of development?
Are the micro and sectoral fiscal choices that serve development objectives being pursued in harmony with or jeopardising fiscal sustainability, and recursively jeopardising the sustainability of development?
Section 2 briefly defines the concepts of fiscal sustainability and sustainable development. This is followed by a discussion of the sustainability of South African fiscal policy in the period 1994–2013. The discussion on fiscal sustainability is followed by a discussion of the interaction between the sustainability of fiscal policy and the sustainability of development during three distinguishable phases. A concluding section considers future challenges to fiscal sustainability and sustainable development.
2. Defining fiscal sustainability and sustainable development
Fiscal sustainability has two dimensions; solvency and credibility. Footnote4 A government is solvent if the present value of the flow of all future revenues exceeds or equals the value of outstanding debt plus the discounted value of all future government expenditure. This also means that the present value of all future primary surpluses must exceed or equal the value of outstanding debt. However, when a government faces a shock that increases its expenditure and/or reduces its revenue, that government may easily put forward numbers that indicate solvency despite the shock. Thus, in addition to solvency, a further question is whether the government has the capacity to adapt to present and future shocks and therefore has the capacity to remain solvent. Often the best guide to consider whether or not the government has the capacity to maintain its solvency in future is to consider its past record. This introduces the credibility dimension in terms of which fiscal policy should also display a track record of revenue and expenditure levels that adjusted to ensure a stable public debt/gross domestic product (GDP) ratio (see for example Perotti, Citation2007:13). In addition, judgement is also required about the ability of government to heed any known present or future expenditure and revenue pressures that might diminish the government's ability to maintain sustainability and therefore undermine its credibility. Thus, to judge fiscal policy as sustainable requires: a projection of solvency in future; a credible track record of maintaining solvency in the past; and cognisance and a judgement about the credibility effect of known current and future budgetary pressures.
The concept of ‘sustainable development’ has its genesis in the Brundtland Commission's report, where it was defined as ‘… development that meets the needs of the present without compromising the ability of future generations to meet their own needs’ (Brundtland Commission, Citation1987:43). The Commission's definition focused largely on the environment. However, because of the fiscal focus of this article, the concept of sustainable development will be narrowed to the extent that development can affect and be affected by fiscal policy, and more specifically the government's budget. If one, for this purpose, defines sustainable development as development that improves the living conditions of the present without worsening living conditions of the future, then the key question is whether the government's development promise (in terms of improved living conditions) can be delivered plausibly along a future path of sustainable mobilisation of fiscal resources.Footnote5 If it cannot, any current improvements in living conditions created by the government will have to be reversed by increasing tax rates and/or reducing expenditure levels in future. Thus, if the development practiced by government is not fiscally sustainable, it will also not be developmentally sustainable (since the government will be forced to increase taxes and/or reduce expenditure in future).Footnote6
Expenditure that improves current living conditions and which results from a budgetary reallocation (e.g. away from military expenditure and towards, say, housing, health or education) can be developmentally and fiscally sustainable if the initial expenditure level was fiscally sustainable. In this case, fiscal policy remains sustainable, while living conditions improve and are expected to be maintainable given the sustainability of fiscal policy.
Development expenditure that increases public debt (i.e. is not matched by an increase in present revenue collected) may be developmentally sustainable if such expenditure increases future private income levels, which, in turn, result in higher future tax collections without the need to increase tax rates. The higher future revenue will then allow the government to service its debt. Infrastructure expenditure and human capital expenditure are examples of such expenditure, although the time lags between cost and higher government revenue may be so long that a government can still in the interim encounter rising deficits that threaten fiscal sustainability, or at least cast doubt about it.
3. Fiscal sustainability: a brief overview of the first 20 years since democracy
Given the high public debt/GDP ratios and budget deficit/GDP ratios at the advent of democracy in South Africa, the sustainability of fiscal policy early on took centre-stage in government policy. In the mid-1990s the debt/GDP ratio reached 50% of GDP (see ). Initially the ratio was actually thought to be approaching 60%; only the revised National Accounts in the late 1990s retrospectively revealed a ratio of 50%.
Figure 1: Public debt (national government) (% of GDP)
The reduction in the gross public debt/GDP ratio (debt of national government) commenced in the 1996/97 fiscal year (SARB, Citation2002:S-145) (the same year in which the government announced the Growth, Employment and Redistribution strategy [GEAR]) This reduction originated in the 12 to 13 years of primary surpluses (revenue minus non-interest expenditure) that the government ran from the 1996/97 fiscal year (see ) and in the longest economic upswing since the Second World War, as recorded between November 1999 and September 2007.
Figure 2: Conventional (overall), current and primary balances (national government, based on national government finance data) (% of GDP)
Since 2009/10 the national government registered a primary deficit in excess of 2% of GDP, which put upward pressure on the public debt/GDP ratio. The latter increased since 2009/10, reaching 43% in the 2012/13 fiscal year.Footnote7
The higher public debt/GDP ratio originated in a much higher structural deficit (which is the overall deficit stripped of the effect of the business cycle). Since 2008/09 the general government structural deficit in South Africa has been increasing much faster in comparison with some of its most important peer group countries – by 2012 South Africa had a structural deficit/GDP ratio that exceeded those of Brazil, Chile, Indonesia and Mexico (see ).
Figure 3: Structural budget balance of general government in selected peer countries (% of potential GDP)
Overall the expenditure/GDP and revenue/GDP ratios remained fairly stable, although a slight upward trend can be observed in the revenue/GDP ratio since 1994/95 and in the current expenditure/GDP ratio since 2002/03 (see and also ). Investment expenditure by government, as a percentage of GDP, did not carry much of the adjustment, simply because it was already a very small component of total expenditure.
Figure 4: National and general government total expenditure and revenue adjusted for cash flows (fiscal years) (% of GDP)
Table 1: Summary values for receipts, operating payments and investment activity (% of GDP)
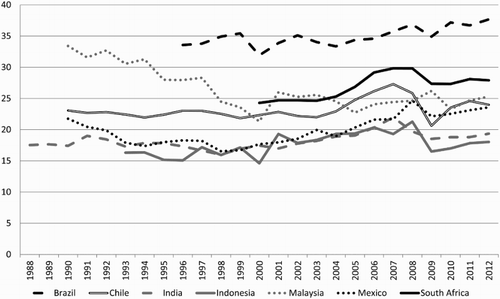
and compare South African general government revenue and expenditure, both as percentages of GDP, with ratios in a peer group of countries, namely Brazil, Chile, India, Indonesia, Malaysia and Mexico. Using both revenue and expenditure, as a percentage of GDP, as indicators of government size, and show the South African government (general government and not central government, to enable comparison across countries) to be relatively large compared with that of the selected countries; only Brazil has a larger government relative to GDP. This implies that, relative to other emerging market economies with which South Africa competes for international trade and foreign direct investment, there has not really been much room to increase revenue and expenditure, as a percentage of GDP, to support more development expenditure.
Figure 5: General government expenditure in selected peer countries (% of GDP)
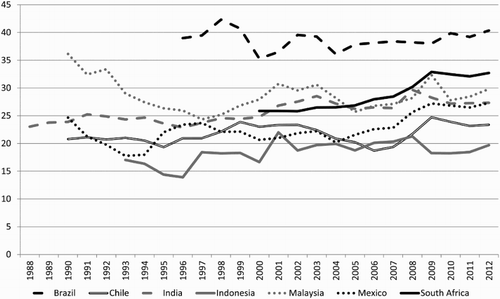
Figure 6: General government revenue in selected peer countries (% of GDP)
4. Interaction of fiscal sustainability and sustainable development – three phases, two decades
Fiscal policy since the advent of democracy can be classified according to three distinct phases, which by and large are identifiable on the basis of macroeconomic stabilisation considerations. Phase 1 (1994–2000) focused on fiscal restructuring and consolidation. GEAR was its policy centrepiece. Once fiscal consolidation in the form of a stable and even decreasing debt/GDP ratio had been achieved, Phase 2 (2001–08) continued to improve the fiscal stance and created scope for fiscal expansion. Unfortunately 2008 marked the arrival of the international financial crisis and the subsequent Great Recession. These developments heralded Phase 3 (2009–13), which was marked by rising deficits and an increase in the public debt burden. In each of these phases, the interplay between fiscal sustainability and sustainable development manifested differently.
4.1 Phase 1: Fiscal restructuring and consolidation (1994–2000)
4.1.1 Macroeconomic stabilisation
The Redistribution and Development Plan (RDP) (RSA, Citation1994) and GEAR (Department of Finance, Citation1996) largely shaped fiscal policy during the first six years after the implementation of democracy. GEAR was criticised for its neoliberal line, its failure to achieve the employment targets and the strong focus on the reduction of the budget deficit and public debt (see Adelzadeh, Citation1996). Yet GEAR can be viewed as providing the budget constraint that was necessary to prioritise the social needs expressed in the RDP. The latter, in turn, was criticised for its alleged populist tendencies, despite the RDP White Paper's attempt to allay such fears (see Blumenfeld, Citation1997:72).
The fiscal goals of the GEAR strategy for the period 1996–2000 included: a step-wise reduction in the budget deficit to 3% of GDP (reduced to less than 2% by the end of the 1990s), maintenance of the total revenue burden at 25% of GDP (an average of 23.6% was achieved for 1994/95–98/99), a reduction of government expenditure (national government cash payments and investment expenditure as a percentage of GDP averaged 28% for 1994/95–98/99) and the gradual elimination of general government dissaving (not achieved).
Generally and macroeconomically speaking, GEAR clearly reflected a preference for fiscal consolidation as a prerequisite for sustainable development, of creating space to devote more future resources to socio-economic development.
4.1.2 Efficiency of resource allocation
During Phase 1 the government broadened access to public services such as health, education, and housing. General government expenditure on education ranged from 6.3% of GDP to 7.3% and that on health care from 3.0% to 3.5% – levels well above those in most other developing countries (see Calitz & Siebrits, Citation2003:62). However, poor service outcomes became evident over time and resulted mainly from the need to reorganise and transform the public service after democratisation, a necessary process that unfortunately but inadvertently also meant a loss of skills and institutional memory (Burger, Citation2014:172–3).
With the reorientation of government expenditure towards social expenditure, as well as the stated aim of GEAR to contain the budget deficit to 3% of GDP, the government limited public investment. Low levels of government investment during this period contributed to the deterioration of parts of the infrastructure and were therefore a disincentive to private-sector investment (Calitz & Siebrits, Citation2003:62).
4.1.3 Distribution of resources and alleviation of poverty
presents the change in Gini coefficients of per-capita income of the country as a whole by race. The aggregate income distribution was unchanged between 1993 and 2000, but became more uneven for all race groups. Thus, while the inequality within each group widened, the inequality between groups narrowed.
Table 2: Gini coefficients of per-capita income, aggregate and by race
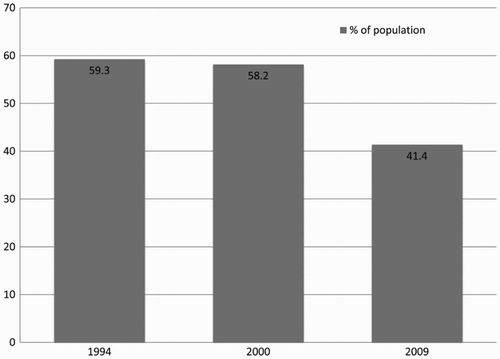
With regard to poverty, shows that during the period 1994–2000 poverty did not decrease much – only afterwards did it decrease, reinforcing the notion that during the period 1994–2000 the government focused more on stabilising the economy, as a precondition for sustainable development, than on alleviating poverty and development as such. Nevertheless, a fiscal incidence study initiated by the then Department of Finance (Citation2000:145–6) considered the redistributive impact of some 60% of consolidated government expenditure (education, health, social grants, water provision and housing) during the period 1993–97. The study affirmed that this period was marked by a significant shift in social expenditure patterns from the more affluent to the poorer members of South African society. The share of measured expenditure benefiting the poorest quintile of households increased from 27.4% to 30.7%, while that of the richest quintile dropped from 12.7% to 8.7%. From 1993 to 1997, per-capita social service expenditure on the poor may have increased by as much as 34% in real terms. By contrast, outlays on the richest quintile decreased by more than 20% in per-capita terms. The study also confirmed the overall progressivity of the South African tax system.
Figure 7: South Africans living below the poverty line
4.2 Phase 2: Improved fiscal stance; scope for fiscal expansion (2001–08)
4.2.1 Macroeconomic stabilisation
Given the first phase's progress with fiscal consolidation, the Minister of Finance (Citation2001), not unexpectedly, exuded a measure of self-confidence in his 2001 Budget Speech:
This budget heralds the beginning of a new cycle. It sets out a growth-orientated agenda of improved expenditure, significant increases in infrastructure allocations and on-going tax reform, within the sound framework of fiscal management established over the last five years. It signals a shift form macroeconomic stabilisation to microeconomic reform.
Phase 2 represents the period 2001–08 when the fiscal position continued to improve through revenue collections that exceeded budgeted revenue and expenditure which in some cases was lower than budgeted.
4.2.2 Efficiency of resource allocation
During this time the South African economy experienced the longest economic upswing since World War II; that is, a 99-month period from September 1999 to November 2007. For the first part in Phase 2, the government still dissaved by running a current deficit. Adding capital expenditure to the current deficit means that the government also ran an overall deficit (which nevertheless was shrinking). However, the primary balance was in a surplus to such an extent that the debt/GDP ratio decreased (notwithstanding the overall budget deficit). This left room for the government to expand social expenditure, without putting undue upward pressure on the debt/GDP ratio. The growth in social expenditure was, in part, made possible by the shrinking of interest expenditure, itself the result of falling government debt and lower interest rates. The objective of fiscal policy was indeed to grow expenditure strongly, especially in areas such as social services, vitally important from the perspective of sustainable human development (Naidoo et al., Citation2008:32). It turns out that the acceleration of government expenditure (i.e. the increased mobilisation of fiscal resources) was not merely because of better economic growth, but also because of a rise in the tax revenue as a percentage of GDP (see ).
The quest for the development of infrastructure by the state increased over this period. The Accelerated and Shared Growth Initiative – South Africa (ASGISA), announced in 2006, testifies to the government's acknowledgement of public investment as an important growth factor (RSA, Citation2006), in line with research findings such as those from Fedderke & Bogetic (Citation2006). The results did not, however, live up to these implied expectations. Capital expenditure by both the general government and public corporations, as s percentage of GDP, remained largely unchanged in the period 2001–05 compared with previous years. However, in the period 2005–08 investment by public corporations as percentage of GDP started to increase. Towards the end of this period, and notwithstanding its good intentions about public investment, the government still faced the diagnosis by the Harvard group (Hausmann, Citation2007:5–16) of infrastructural backlogs as a binding constraint on the long-run economic growth performance.
A number of efficiency-and-growth-related tax measures were introduced during this period. In an attempt to promote small-business activity, believed to be an important source of growth and employment opportunities in a high-unemployment developing economy, a differentiated rate structure for small businesses was introduced in the 2000/01 fiscal year.
4.2.3 Distribution of resources and alleviation of poverty
Despite the increased fiscal resources and the increased allocation of funds for human development and other social security expenditure, economic growth in South Africa has not been found to reduce inequality during the first decade after democracy. However, as shows, the poverty headcount decreased by approximately one-third during the first decade of the 2000s. Unfortunately, resource waste and inefficiencies in social service delivery, as well as poor outcomes when compared with the experience of other developing countries, limited the opportunities for a further reallocation of budgetary resources towards social services (see for example Van der Berg, Citation2009).
Van der Berg (Citation2009:23) discusses the difference between the Gini coefficient of primary and secondary income (which includes the effect of taxation and social expenditure benefits), indicating that fiscal redistribution had reduced the skewness in the market's distribution of income by 18 percentage points in 2000, from 0.71 to 0.53. By 2006 the fiscal redistribution was even larger, when a 22 percentage point difference between the primary Gini of 0.69 and the secondary Gini of 0.47 was measured. Whilst the net transfers and targeted social services by the national government no doubt alleviated poverty and deprivation, the real test for sustainable fiscal policies that encourage sustainable development is the improvement in the primary Gini coefficient, which did not occur.
4.3 Phase 3: The great recession and rising public debt (2009–13)
Phase 3 represents the period from 2009 to 2013, which was predominantly influenced by the Great Recession and its recessionary effects on the South African economy.
4.3.1 Macroeconomic stabilisation
Owing to the recession, revenue collection slowed significantly. The government also allowed a larger deficit as a countercyclical measure. As a result, the budget balance/GDP ratio fell from a surplus of almost 1% of GDP in 2007/08 to a deficit of almost 5% in 2009/10; the public debt/GDP ratio increased from approximately 23% to 43% in 2012/13 (see ). Although the public debt/GDP ratios in most OECD countries are significantly worse, concern exists because the debt/GDP ratio in South Africa increased faster than in peer emerging market countries. South Africa was also downgraded by rating agencies, partly because of the relatively large deficit on the current account of its balance of payments. Labour unrest also contributed to negative investor sentiment. In addition, given expectations at the time of rising interest rates during 2014 and 2015, upward pressure on the financing cost of public debt was envisaged. Taking all these factors together therefore means that, more than many other emerging market countries, the South African government will have to watch its deficit and debt position closely so as not to add oil to an already slow-burning fire.
4.3.2 Efficiency of resource allocation
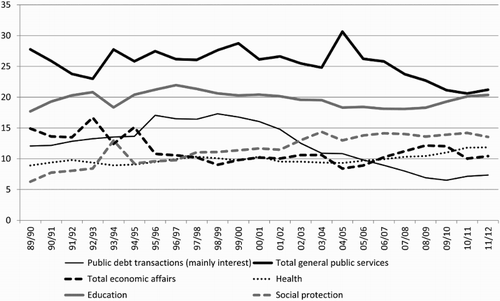
The third phase saw some further increases in the portion of the budget allocated to education and health (see ). With education and health workers constituting a significant portion of government employment, a significant proportion of this increase can be ascribed to salary increases, which for general government as a whole constituted 35.8% of total operating expenditure in 2006/07 and increased to 38.2% in 2012/13 (data: StatsSA, Citation2014).
Figure 8: Functional classification of cash payments for operating activities and purchases of non-financial assets of consolidated general government (fiscal years), expressed as a ratio of total of such expenditure
During the third phase, investment by public corporations increased significantly. It averaged 2.1% of GDP for the period 2001–08 (the second phase) and 4.2% for the period 2009–13 (SARB, Citation2014). For general government the increase was less pronounced, from an average of 2.6% to 3%.
4.3.3 Distribution of resources and alleviation of poverty
Particularly in the period since 2008 the welfare system administered by the government expanded significantly. The welfare system reached 16.5 million out of a population of 52 million, compared with 9.4 million in 2004/05 (see ). Of the 16.5 million grants in 2013/14, 11.7 million are child support grants of R290 per month (see ). Total grants equalled 3.4% of GDP.
Table 3: Number of grant recipients (thousands)
Table 4: Monthly social grant amounts (rand)
In a study using data from the three waves of the National Income Dynamics Study, Finn & Leibbrandt (Citation2013) found that between 2008 and 2012 poverty exit rates (i.e. those who move from below to above the poverty line) increased. However, they also found that a substantial proportion of the population remain in severe poverty (defined as less than one-half of the poverty line; that is, equal to R318 per month per person). Finn & Leibbrandt (Citation2013:20) argue that government grants explain between 8 and 9% of the move out of poverty.
With regard to specific grants and the proportion of children enrolling in school, Eyal & Woolard (Citation2013:1) – using data from the three waves of the National Income Dynamics Study – find that recipients of child support grants tend to have higher enrolment rates. On average, for every 100 children between the ages of 15 and 19, 85 enrol for school. However, for those who receive a child support grant, the number is 91 out of 100 children.
The trend in reallocating resources towards social expenditure mentioned above, from 42.9% of total expenditure in 1994/95 to 49.5% in 2008/09, continued in Phase 3, with a further increase to 53.1% in 2011/12. More than other expenditure, social expenditure has a larger incidence on the poor. Given that the government uses changes in total expenditure to keep debt in check, there arguably is also a limit to the extent to which the government will use an increase in total expenditure, as a percentage of GDP, to address redistribution. The most recent medium-term cash-limits on budgetary expenditure are further evidence of this.
5. Future challenges regarding fiscal sustainability and sustainable development
The past behaviour of government established a credible fiscal policy and shows that fiscal policy was sustainable, although concerns were surfacing in the five years towards the end of the period. The government's own projections also indicate that they expect the government to remain solvent in future (National Treasury, Citation2014b:40). Nevertheless, as the discussion above indicates, to judge fiscal policy as sustainable also requires one to take account of possible threats to fiscal sustainability in future. This section highlights five issues that require attention to ensure that fiscal policy as well as the government's impact on development remain sustainable.
5.1 The National Development Plan
The latest major policy framework of the government is the National Development Plan (NDP) of 2012 (NPC, Citation2012). Whereas GEAR and ASGISA focused largely on the generation of growth, the NDP represents a move towards a larger focus on the inclusivity of growth and the reduction of unemployment (Fourie, Citation2013:3). The NDP has a number of broad objectives to be reached over an 18-year period culminating in 2030, which includes:
To reduce unemployment to 6%.
To reduce poverty – poverty line defined as R418 (2009 rand) per person per month – from 39% to zero.
To reduce inequality – defined in terms of the primary Gini coefficient – from 0.7 to 0.6.
Although the NDP is not a set of costed projects or plans, it is, as its name states, a plan with some very specific policy steps that will have budgetary implications. The NDP should have considered these budgetary implications, if only in broad terms, because not doing so still leaves the question about how realistic the plan is. If the plan cannot be implemented because of fiscal sustainability constraints, then the development it envisions will also not be sustainable.
Most of the proposals in the NDP relating to infrastructure, education, health and high-density urbanisation are essential to reach the aims of the NDP. But the plan does not consider whether or not the government can afford them. And if it can only afford them partially, which components get priority? This raises two key fiscal questions to which currently no answers exist and which clearly requires the urgent attention of the implementers of the NDP:
How much of the financial (fiscal) viability of these projects depends on the projected average growth rate of 5.4% to generate the revenue needed to finance them?
Conversely, to what extent is the 5.4% growth rate itself the result of these projects?
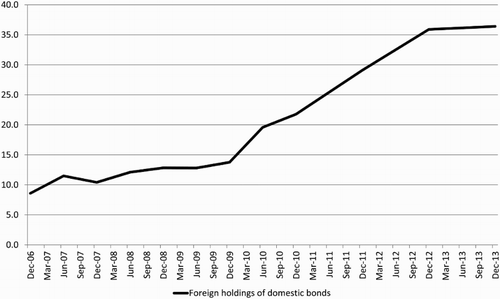
5.2 Increased foreign holding of rand-denominated debt
With the advent of democracy in 1994 the South African government could also explore options to borrow offshore using bonds denominated in foreign currencies. Although these bonds offer additional sources of funds, the amount of foreign bonds issued remained fairly limited, with foreign currency denominated public debt remaining less than 5% of GDP (except for a brief interval in the early 2000s when a depreciating rand put upward pressure on the rand value of foreign currency denominated bonds). This also meant that domestic bonds (denominated in rand) never fell below 80% of total government gross debt. In 2012/13, foreign currency denominated debt was less than 10% of total government gross debt.
However, the increased portion of domestic (rand-denominated) bonds (excluding treasury bills) held by foreigners added to the government's exposure to foreign portfolio investors. shows that this portion has increased from 12.8% in December 2009 to 36.4% in December 2013. This also means that foreign investors effectively bought 53% of rand-denominated government bonds between 2009 and 2013, so that foreign holdings of domestic government bonds increased from roughly 2% of GDP to almost 11%. In mitigation, however, it should also be noted that during the period 2009–13 the Public Investment Corporation, which manages long-term surplus funds of government and government employee pension funds, diversified its investment away from government.Footnote8 This increase in the supply of government bonds to domestic and foreign investors alike explains, in part, the rising foreign ownership of government debt. Thus, part of the adjustment from 2% to 11% might be a level adjustment that should converge on a stable number and does not necessarily represent a new continuing upward trend. Nevertheless, the higher level still represents a higher exposure and risk, and adds to the international financial vulnerability reflected in the high current account deficit.
Figure 9: Domestic (rand-denominated) bonds (excluding treasury bills) held by foreigners
A current account deficit between 5 and 7% of GDP, and a budget deficit between 4 and 6% of GDP, roughly half of which is financed (directly and indirectly) with foreign funds, sounds a warning of a twin deficit problem potentially emerging. Mitigating factors against this include the improvement in South Africa's foreign reserve position from 14.6 weeks of imports in 2008 to 19.4 weeks in 2013 (SARB, Citation2014), the increase in the average maturity of government bonds, from 123 months on 31 March 2009 to 154 months on 31 March 2014, as well as the relatively high liquidity level of South African financial markets. Nevertheless, concern about the size of its current account and budget deficits has already led to South Africa being classified as one of the so-called ‘Fragile-5’, signifying the risk of a capital reversal, including a sell-off of government bonds (see Roubini, Citation2014:1). Such a sell-off holds the danger of putting downward pressure on bond prices, and hence upward pressure on bond interest rates. As such, the cost of borrowing for the government would increase. Therefore, the risk present in the larger foreign holding of domestic government bonds is not negligible and serves as an additional reason to reduce the budget deficit significantly in the short term, or even effect some pre-emptive changes in the composition of debt by the bond holder. This recommendation is also in line with that of the OECD (Citation2013:18).
5.3 Fiscal sustainability, and the quality of service delivery
There is a rising concern about the quality of public services. This is reflected in various ways. The Auditor-General reported large numbers of qualified audits at national, provincial and local government level. In the World Competitiveness Report (World Economic Forum, Citationvarious issues), South Africa slipped greatly in a number of categories related to the government. These trends raise doubts about whether the micro foundations of public finance support fiscal policy in its quest for sustainability.
Outside of general government, the parastatal sector in South Africa also appears to suffer serious management shortcomings. The South African government repeatedly has had to bail out South African Airways, while the South African Broadcasting Corporation suffers continuous internal management squabbles. ESKOM, the parastatal responsible for generating electricity, also suffers from underinvestment, inadequate maintenance and financial pressures. These pressures resulted in load shedding in 2008 and 2014, and are likely to continue in 2015, at least until the new power stations (Modupi and Kusile) come online.
Nevertheless, some policy initiatives have been quite successful. The rollout of social grants, the turn-around of the Department of Home Affairs, the efficiency of the National Treasury and South African Revenue Services are some of the success stories.
5.4 Financing infrastructure
The NPC (Citation2012:44) wants the government to increase the public-sector investment/GDP ratio to 10%, up from its current 7.3%. However, it is not clear how the government plans to finance this increase (also given that parastatals will undertake a major component of these). In terms of the national accounts identity, three sources of finance are available: domestic private saving by companies and households, saving by government, and foreign borrowing.
Given that in September 2013 the current account deficit in South Africa was already at a high level of 7% of GDP, there is not much scope to borrow offshore to finance the higher government investment. The current account might improve once the global economy and therefore exports recover and the effect of lower oil prices filters through, but given the economic weakness in the European Union and China at the time of writing, that might take a few years. Thus, in the foreseeable future the foreign sector cannot be relied upon to provide the needed finance. In addition, as showed above, compared with its peer group countries, government revenue as a percentage of GDP is already high. Thus, there is also not much scope to increase taxation. This leaves either higher domestic saving by companies and households or a reduction in government current expenditure (and therefore an improvement in government saving) as the only two alternative sources to finance the investment. Companies save to finance their own investment, while household saving in South Africa is negligible. This leaves only a reprioritisation in government expenditure, most notably and in line with the IMF's 2012 Article IV recommendation (IMF, Citation2012:11), away from wages and towards capital expenditure. Whether this is feasible, given that such a reprioritisation would include a reduction of the government wage bill, remains a question.
5.5 The National Health Insurance
According to National Treasury estimates, public health expenditure with the implementation of the National Health Insurance could rise by 2 percentage points of GDP to 6.2% in 2025 (Department of Health, Citation2011:40). The government is considering various financing options, including a payroll tax (payable by both employees and employers), a higher value-added tax rate and/or a surcharge on taxable income. An increase to 6.2% of GDP should, however, be taken with caution. As is clear from the study by Van der Berg et al. (Citation2010), for instance, cost estimates for the National Health Insurance depend on a series of assumptions which, however carefully made, still leaves significant uncertainty as to what will be the actual cost. In addition, in its 2012 Article IV consultation, the IMF (Citation2012:16) warns that the government should not increase labour costs for employers, as this would aggravate an already serious unemployment problem.
6. Conclusion
During the first two decades following the implementation of democracy in South Africa, the government has had a credible track record of maintaining fiscal sustainability. As a result the increased levels of social spending, made possible by the reallocation of resources in the budget and the higher economic growth rates of particularly the period 2001–08, were fiscally sustainable, This, in turn, contributed to the sustainability of government's development efforts to improve living conditions.
However, following the international financial crisis in 2008, South Africa's fiscal position has steadily weakened. The government announced a number of plans to limit government expenditure and increase taxes and thereby ensure government's solvency and fiscal sustainability. Whether the government will be able to do so without cutting back too much on the measures it implemented to improve living conditions remains to be seen. Thus, it is not entirely clear whether the effort to ensure future fiscal sustainability will succeed without adversely affecting the sustainability of the development it created.
It is therefore far from given that the government's credible past track record is secure, as the five concerns highlighted above affect both fiscal sustainability and sustainable development. All five of these concerns relate to the ability of government to improve living conditions and therefore demonstrate that the sustainability of fiscal policy and the sustainability of development are inextricably linked. This presents huge challenges to the future management of economic, fiscal and development policies in South Africa as interactive and well-coordinated processes.
Disclosure statement
No potential conflict of interest was reported by the authors.
Notes
3For an earlier attempt to assess fiscal policy in this manner, see Calitz & Siebrits (Citation2010).
4For an outline of different concepts and definitions, also see Baldacci & Fletcher (Citation2003:130–61).
5Our thanks to an anonymous reviewer for helping us formulate this narrower definition of sustainable development.
6This situation should be distinguished from the case where the current generation (and not a future generation) pays for its own increased benefits by also paying higher taxes. The only case in which the future generation has to pay for the current generation, yet does not end up worse off, is when the economic growth rate exceeds the real interest rate and does so for every generation in future – this is the so-called Diamond model (Diamond, Citation1965), which extends the concept of Pareto efficiency to an intertemporal basis. Unfortunately, as history shows, at times interest rates exceed growth rates.
7The commonly available public debt figures in South Africa refer to national government debt. Provinces cannot issue bonds, while local authorities can issue some debt but must service it from their own income. National debt also excludes the debt of public corporations (such as ESKOM). These institutions service their debt with their own income, which explains why their debts are excluded. In so far as national government provides guarantees (at a prices) to public corporations, it incurs a contingent liability. For South Africa the contingent liabilities are currently not excessive, although they do need to be monitored, as highlighted by the significant increase in ESKOM debt. See Calitz (Citation2012) for a detailed study on this.
8Government bonds constituted 27.5% of the Public Investment Corporation's assets in 2008, before decreasing to 21.8% in 2013 (SARB, Citation2014).
References
- Adelzadeh, A, 1996. From the RDP to GEAR: The gradual embracing of neo-liberalism in economic policy. Transformation 31, 66–95.
- Baldacci, E & Fletcher, K, 2003. A framework for fiscal debt sustainability analysis in low-income countries. In S. Gupta, S, Clements, B, & Inchauste, G (Eds.), Helping countries develop: The role of fiscal policy. International Monetary Fund, Washington, DC, 130–161.
- Blumenfeld, J, 1997. From icon to scapegoat: The experience of South Africa's reconstruction and development programme. Development Policy Review 15(1), 65–91. doi: 10.1111/1467-7679.00026
- Brundtland Commission, 1987. Our common future. World Commission on environment and development. Oxford University Press, Oxford.
- Burger, P, 2014. Facing the conundrum: How useful is the “developmental state” concept in South Africa? South African Journal of Economics 82(2), 159–180. doi: 10.1111/saje.12030
- Burger, P & Calitz, E, 2014. Review of South African fiscal policy since 1994. Unpublished research report commissioned by the South African National Treasury.
- Calitz, E, 2012. Public-sector debt sustainability. Unpublished research report commissioned by the South African National Treasury.
- Calitz, E & Siebrits, FK, 2003. Fiscal policy in the 1990s. The South African Journal of Economic History 18(1&2), 50–75. September 2003 (Special issue). doi: 10.1080/10113430309511154
- Calitz, E & Siebrits, FK, 2010. Fiscal policy. In Jones Stuart & Vivian Robert (Eds.), South African economy and policy, 1990–2000: An economy in transition. Manchester University Press, Manchester, 407–420, chapter 19.
- Department of Finance, 1996. Macroeconomic strategy on growth, employment and redistribution. Government Printer, Pretoria.
- Department of Finance, 2000. Budget review 2000. Pretoria. http://www.treasury.gov.za/documents/national%20budget/2000/default.aspx. Accessed 30 March 2014.
- Department of Health, 2011. National health insurance in South Africa. Policy Paper.
- Diamond, P, 1965. National debt in a Neoclassical growth model. American Economic Review 55, 1126–50.
- Eyal, K & Woolard, I, 2013. School enrolment and the child support grant: Evidence from South Africa. NIDS discussion paper 2013/7 and SALDRU working paper series no.125.
- Fedderke, JW & Bogetic, Z, 2006. Infrastructure and growth in South Africa: Direct and indirect productivity impacts of nineteen infrastructure measures. Paper presented at the DPRU/TIPS conference, Johannesburg.
- Finn, A & Leibbrandt, M, 2013. The dynamics of poverty in the first three waves of NIDS. NIDS discussion paper 2013/1 and SALDRU Working paper series no.119.
- Finn, A, Leibbrandt, M & Wehner, E, 2011. Policies for reducing income inequality and poverty in South Africa. In Hofmeyer Jan (Eds.), Transformation audit 2011: From inequality to inclusive growth. Institute for Justice and Reconciliation, 72–81, Chapter 4. Available at www.transformationaudit.org. Accessed 12 February 2014.
- Fourie, FCvN, 2013. The NDP on unemployment: On consistency, coherence and comprehensiveness. Paper presented at the ESSA Conference, Bloemfontein, September 2013.
- Hausmann, R (chairperson), 2007. Final recommendations of the international panel on growth. Pretoria: National Treasury. http://www.treasury.gov.za/publications/other/growth/01-Overall%20Summary%20and%20Final%20Recommendations/01-Final%20Recommendations%20of%20the%20International%20Panel.pdf. Accessed 11 February 2014.
- IMF (International Monetary Fund), 2012. IMF executive board concludes 2012 Article IV consultation with South Africa. Public information notice (PIN) No. 12/98 August 23, 2012.
- Minister of Finance, 2001. Budget speech. Cape town: National treasury. 21 February. http://www.treasury.gov.za/documents/national%20budget/2001/speech/speech.pdf. Accessed 11 February 2014.
- Naidoo, K, Willcox, O, Makgetsi, P & Stott, J, 2008. Fifteen-year review of fiscal policy in South Africa. National Treasury, Pretoria.
- National Treasury, 2008. National budget review. National Treasury, Pretoria.
- National Treasury, 2009. National budget review. National Treasury, Pretoria.
- National Treasury, 2014a. Information and data provided on request. January 2014.
- National Treasury, 2014b. National budget review. National Treasury, Pretoria.
- NPC (National Planning Commission), 2012. National development plan. The Presidency, Pretoria.
- OECD (Organisation for Economic Cooperation and Development), 2013. OECD economic surveys: South Africa. OECD Publishing, Paris. http://dx.doi.org/10.1787/eco_surveys-zaf-2013-en.
- Perotti, R, 2007. Fiscal policy in developing countries: A framework and some questions. World bank policy research working paper No 4365. The World Bank, Washington, DC.
- Quantec/IMF World Economic Outlook, 2014. Online database. www.quantec.co.za.
- Roubini, N, 2014. The trouble with emerging markets. Project syndicate 31 Jan 2014. http://www.project-syndicate.org/commentary/nouriel-roubini-explains-why-many-previously-fast-growing-economies-suddenly-find-themselves-facing-strong-headwinds. Accessed 27 February 2014.
- RSA (Republic of South Africa), 1994. White paper on reconstruction and development: Government's strategy for fundamental transformation. Pretoria. http://www.polity.org.za/polity/govdocs/rdp/. Accessed 30 March 2014.
- RSA (Republic of South Africa), 2006. Accelerated and shared growth initiative for South Africa (ASGISA). www.info.gov.za/asgisa/asgisa.htm. Accessed 30 July 2009.
- SARB (South African Reserve Bank), 2002. Quarterly bulletin. South African Reserve Bank, Pretoria, September.
- SARB (South African Reserve Bank), 2014. Online download facility. http://www.resbank.co.za/Research/Statistics/Pages/Statistics-Home.aspx.
- StatsSA (Statistics South Africa), 2014. Financial statistics of consolidated general government. Statistics South Africa statistical release P9119.4, Pretoria.
- Transformation Audit Blog, 2012. Poverty and inequality at glance. Online. http://transformationaudit.org/blog/wp-content/uploads/2013/02/Poverty%20and%20Inequality%20at%20a%20Glance.pdf.
- Van der Berg, S, 2009. Fiscal incidence of social spending in South Africa, 2006. Stellenbosch Working Paper Series No. WP10/2009. http://www.ekon.sun.ac.za/wpapers/2009. Accessed 13 February 2014.
- Van der Berg, S, Burger, R, Theron, N, Venter, C, Erasmus, M & Van Eeden, J, 2010. Financial implications of a national health insurance plan for South Africa study commissioned by the hospital association of South Africa (HASA). ECONEX.
- World Economic Forum, various issues. Global competitiveness report. Online. http://www.weforum.org/reports/.