
ABSTRACT
Addressing urban vulnerability requires an understanding of the underlying determinants of resilience for individuals, households, communities and institutions – to withstand shocks, to adapt and to change. Analysing urban resilience utilises the results of five rounds of the Indicator Development for Surveillance of Urban Emergencies surveys conducted in three informal settlements of Nairobi. Results show a significant deterioration in food security and household hunger in marginalised urban populations, with other deprivations including insecurity, negative coping behaviour and inadequate access to water and sanitation. Within slum populations, there was a significant variation in income and expenditure (p < 0.05) with lowest income quintiles spending over 100% of their income on food. Significant gender disparities have been shown in lowest income quintiles, with female breadwinners earning 62% compared with male breadwinners (p < 0.05). Recommendations from this analysis include establishing thresholds for vulnerability and concrete dimensions for measuring resilience that can initiate and guide related interventions.
KEYWORDS:
1. Introduction
By 2050 it is estimated that approximately 70% of the world's population will live in cities, with urban growth more concentrated in developing countries (UN-Habitat, Citation2015b; WHO, Citation2015). Global population growth has included the increase of 55 million new slum dwellers since 2000, with an estimated 100 000 new slum dwellers daily (UN-Habitat, Citation2008, Citation2015b). Notably, sub-Saharan Africa has the highest proportion of slum dwellers in urban areas (accounting for 61% of urban populations) with a total population of 199.5 million people living in slums (UN-Habitat, Citation2015a).
Disparity analysis in urban areas reveals that child malnutrition in the poorest households is twice as great when compared with rural locations, highlighting a number of inequities (Beyer et al., Citation2013). Further, emerging concerns for young children living in the urban slums of Nairobi include rickets, severe stunting in young children, diarrhoea and HIV/AIDS as well as substantial challenges for early childhood care and development (Beyer et al., Citation2013).
This analysis explores related dimensions of how vulnerable urban households and individuals are affected in the face of climate change, rising food prices, emergencies and shifting demographics. In comparison with past approaches to urban planning based on the principles of disaster mitigation, there has been a growing emphasis on understanding the resilience of individuals and systems as a means to address urban vulnerability (Shaw, Citation2012). Knowledge of urban vulnerability, community resilience and beneficiary targeting approaches are essential for ensuring appropriate urban response(s) (IASC, Citation2010). Because population measurements provide averages, representation of vulnerable portions of urban populations are often obscured by the wealth of others in these settings (UNICEF, Citation2012).
Indicator Development for Surveillance of Urban Emergencies (IDSUE), a study funded by the US Agency for International Development – Office of Foreign Disaster Assistance and implemented by Concern Worldwide Kenya, was born out of growing interest by development and humanitarian practitioners in predicting and averting urban crises and complex emergencies experienced by the urban poor. IDSUE commenced in 2010 shortly after Kenya's post-election violence, where the effects of increasing urbanisation coupled with extreme vulnerability and ethnic violence were most acutely experienced. This work has also drawn lessons from the scaled response that effectively meets the needs of vulnerable urban populations under the leadership of the Government of Kenya, Ministry of Health (Beyer et al., Citation2013). Understanding dimensions of resilience will, therefore, contribute to responses that more appropriately match the complexity and support required.
1.1 Urban transitions in Nairobi, Kenya
Kenya is rapidly urbanising, with 50% of the population expected to live in urban centres by 2020 (UN-Habitat, Citation2011). While the perception of ‘urban advantage’ has been characterised by a belief of better access to opportunities for employment and social services, for many urban residents urban living is not necessarily better living. More than half of Kenya's urban residents live in poverty; they dwell on the peripheries of urban areas, living on meagre incomes, in unsanitary and overcrowded conditions. Nairobi alone is home to 45% of the country's urban population, of which 60% live in slums on 4% of the city's land (UN-Habitat, Citation2011).
Urban transitions in Kenya play an important role in determining the country's growth prospects and social stability, both of which remain fragile. Slum populations are highly vulnerable to repeated shocks which contribute to the complex challenges faced by households. These shocks and stresses include food price fluctuation/inflation, changes in value-added tax, emergencies including frequent fires and flood and chronic insecurity. The consequences of these shocks are felt at a household, individual and community level impacting the well-being and lives of slum residents (UNICEF, Citation2012).
Kenya's early focus on development and growth focused in the agricultural sector, with Kenya's Second National Development Plan (1970–4), having little concentration on the urban sector (Metcalf et al., Citation2011). Following this, in the 1990s the government began to prioritise the needs of urban areas within their Five Year Development Plan (1993–7), citing ‘the role and contribution of urban centres towards economic development’ (Metcalfe et al., Citation2011:10). Kenya's recent constitution and the Vision 2030 development programme further recognise changing population dynamics and the need to focus on urban development (Republic of Kenya, Citation2008, Citation2010). The National Urban Development Policy and Urban Areas and Cities Act has been formulated to provide a foundation for strengthening governance, productivity and inclusivity, in Nairobi and other devolved urban settlements (Republic of Kenya, Citation2011a, Citation2011b). This analysis aims at gaining a deeper understanding of the vulnerabilities and deprivations of urban populations in Nairobi, as the largest urban base in Kenya.
1.2 Urban vulnerability and resilience
Eighty percent of the world's largest cities are vulnerable to earthquakes, 60% from storm surges and tsunamis, with others facing related impacts of climate change (UN-Habitat, Citation2015a). Focus on risk reduction and resilience have been central to continued humanitarian and development debates, expanding and exploring the interface between human crisis, aid and development. This debate recognises that conventional ways of addressing vulnerability in emergency and development efforts need to better contextualise and tackle the underlying and structural causes including strengthening people's resilience to not only ‘withstand shocks but also to positively adapt and transform in the face of them’ (UNICEF, Citation2013). With renewed emphasis on sustainable development guiding the post-2015 agenda, the concepts of people and systems being dynamic, adaptive and responsive can also serve to shape advances in humanitarian and development domains (Levine et al., Citation2012:2). Conceptualising urban resilience therefore provides the opportunity to expand and address dimensions of vulnerability, disparity, social capital and agency in these contexts. It also serves to further characterise context-specific shocks and responses at an individual, community, institutional and governance levels:
Resilience is the capacity of individuals, communities and systems to survive, adapt, and grow in the face of stress and shocks, and even transform when conditions require it. Building resilience is about making people, communities and systems better prepared to withstand catastrophic events – both natural and manmade – and able to bounce back more quickly and emerge stronger from these shocks and stresses. (The Rockefeller Foundation, Citation2015)
Resilience analysis has provided a relevant and plausible framework for understanding the regional or local capacity of individuals/households and a communities’ ability to withstand future shocks and stresses, their ability to adapt and the potential for enhanced future capacity (Béné et al., Citation2012).
Measuring the multi-dimensional nature of what puts these urban populations at risk as well as the unique dimensions of how they cope will be the focus of this analysis. These measures of resilience are grounded in the conceptual understanding of risk, vulnerability, chronic and transient poverty, insecurity and complex interactions between shocks and stressors at various scales as well as adaptive capacities in the face of shocks and stressors (Maxwell et al., Citation2013; Barrett & Heady, Citation2014). Measuring resilience involves a higher frequency of analysis to ensure sensitivity to seasonal variation and dynamic changes in welfare indicators and other shocks that are context specific (Barrett & Heady, Citation2014). It requires measuring the ability to withstand or bounce back from these shocks. This involves using a variety of qualitative and quantitative methods including a focus on local economies and ecologies (Barrett & Heady, Citation2014). These aspects of resilience analysis have helped shape both the formation and approach underpinning IDSUE efforts. These include basic measures of well-being as well as absorptive, adaptive and transformative capacity (Frankenberger et al., Citation2013).
2. Description of study area
As study sites, Mukuru and Viwandani were informal settlements adjacent to each other while Korogocho was located about 8.5 km northeast of Viwandani. The Kenya National Bureau of Statistics 2009 census estimated 4636 people/km2 in Korogocho sub-location, and 16 802 and 7859 people/km2 in Mukuru and Viwandani sub-locations, respectively (see ). Mukuru and Viwandani have been known for fire outbreaks, industrial contamination from surrounding businesses and forceful eviction of their residents. Korogocho has been known to be a very densely populated, poor informal settlement in eastern Nairobi. Korogocho was also known to be one of the most insecure informal settlements in Nairobi and has been characterised by high levels of informal labour, by high vulnerability and with a large number of female-headed households. Length of residency in Korogocho (12 years) is significantly longer than in Mukuru (five years) or Viwandani (six to eight years), which implies many residents have been living in chronic poverty. Further, for Korogocho 28% of current residents have moved from rural areas, whereas others have moved from an urban area: 22% from another slum, 32% from within and 16% from a non-slum area.
Table 1. Kenya National Bureau of Statistics gender, household, area (km2) and density (people/km2) 2009 census data by sub-location.
3. Conceptual approach to data and methodology
UN-Habitat (Citation2011) cites key deprivations that define urban slums, where many of the urban poor live. These deprivations include challenges in access to improved water and sanitation, security of tenure, durability of housing and sufficient living area. Related dimensions of livelihoods (including income and expenditures) – food security and nutrition; water, hygiene and sanitation; health and health-seeking behaviour; and coping behaviours (see ) – will be grounded in emerging evidence on resilience in vulnerable urban populations. These indicators will then be examined further in Section 4.
Table 2. Indicators being measured through IDSUE surveys (Concern Worldwide, Citation2015).
Carter and Barrett (Citation2006) and Barrett and Carter (Citation2013) illustrate how well-being dynamics respond to stressors or shocks subject to their initial conditions, which align with a broad review of literature on poverty dynamics. Poverty and associated health, nutrition and social factors prevent at least 200 million children in developing countries from attaining their developmental potential (Walker et al., Citation2007). In this analysis, the instability of casual labour is a major component of understanding urban livelihood. Variance in the mode of payment (i.e. daily, weekly or monthly) also influences the ability of the households to sustain an adequate and secure livelihood. In addition, the reliability of income affects a household's ability to effectively manage related shocks.
Exploring dimensions of measurement for poverty and food security includes works by Alinovi et al. (Citation2010), Frankenberger et al. (Citation2012), Pingali et al. (Citation2005) and Vaitla et al. (Citation2012), with related evidence on child development and nutrition by Engle et al. (Citation1996) and Walker et al. (Citation2007). Inequality in nutrition and early child care practices adversely impact on biological and psychosocial experiences that affect early brain development (Walker et al., Citation2011), which build on the causal factors, determinants and framework for malnutrition (UNICEF, Citation1998).
At a global level, it is projected that food production will need to increase by at least 60% to meet the needs of a changing world by 2050 (United Nations, Citation2014). Climate change negatively affects food security of urban populations, as well as the ability to meet the growing and shifting demands of the world's population (United Nations, Citation2014). Fluctuations in food prices along with inflation rates are monitored in each of the sites using monthly market surveys (Concern Citation2014, Citation2015). This is important to measure, because urban household are more reliant on markets and street foods.
The disparities in water and sanitation supply against population growth demonstrate that water and sanitation supply is not keeping pace with the needs of growing urban populations (UNICEF, Citation2012). ‘Urbanisation creates centres of intense water demand, costly to satisfy … (with) impacts at their worst in areas that are water-scarce, where piped supply becomes affordable accelerating demand and where larger urban centres are emerging’ (WHO & DfID, Citation2009:5). In the slums of Nairobi, the cost of obtaining water from privately managed communal stand pipes was found to be up to 20 times the cost as compared with wealthier households (UNICEF, Citation2014). Improving access to optimal water, sanitation and improving sanitation practices remains vital to reducing related mortality and morbidity.
While there are some contextual gaps in the literature on health-seeking behaviour in urban informal settlements, there are some key observations. Information and perception about service quality and inversely longer waiting periods are factors associated with higher rates of use of health services (Murithi, Citation2013). Further, ‘wealth, user fees, and gender, are the main determinants of patients’ choice among alternative medical treatments’ (Murithi, Citation2013:151). These findings require careful consideration to promote access to health services, while minimising the negative effects on opportunity costs with time away from income generation as well as health services that are responsive to the needs of vulnerable urban populations.
One specific analysis highlights the fact that healthcare-seeking for treatment of diarrhoea in urban poor populations remains a significant challenge. Greater than half (55%) of households seek inappropriate health care, one-third of caregivers (35%) take no action in seeking treatment for their child's illness, 10% resort to purchasing medicine from a chemist and 9% give their children some form of leftover medicine from home (Mukiira & Ibisomi, Citation2012).
There are both positive and negative adaptive outcomes that can result from chronic urban violence. While positive opportunities are embedded in effective responses, chronic urban violence can alternatively destroy the ‘social, economic, and political fabric of cities and communities by generating fear and distrust, by disrupting daily activities, and by undermining the legitimacy of governing institutions’ (Davis, Citation2012:97). As a result, these factors limit the resilience of actors and institutions to restore normal functioning (Davis, Citation2012:97). Urban residents often have to straddle competing forces of their ‘immediate neighbours, the agents of violence, or the police and other local security forces’ (Davis, Citation2012:97). An analysis of statistics on survivors of sexual assault received during 2007–8 in Nairobi shows that 71% of the survivors came from informal settlements (Muggah et al., Citation2012). In Korogocho, one of the most insecure informal settlements, between 2 and 3% of respondents report being raped in the last four weeks (Muggah et al., Citation2012). According to key informants, slum residents are normally twice more likely to experience sexual and gender-based violence when trying to get access to water and sanitation services due to the insecurity associated with facilities (Muggah et al., Citation2012).
Dimensions of coping have been described in prior analysis, with the most frequently used strategy being a reduction in food consumption (69% of households), followed by use of credit (52% of households) and removing children from school also used to manage an economic shortfall (Amendah et al., Citation2014). Positive livelihood factors that were attributed to reduction in the use of negative coping strategies included ‘formal employment, owning a business, rent-free housing, belonging to the two top tiers of income brackets, and being a member of a social safety net’ (Amendah et al., Citation2014:1). From work in El Salvador, urban residents used self-insurance (including buying and maintaining physical assets, construction materials), putting money under mattresses, encouraging migration to the United States, joining religious institutions that offer support and contribution to community emergency funds (Wamsler, Citation2007). Wamsler notes that ‘current urban coping strategies are important for sustainable settlement development, but they appear to be less deliberate, not as effective, and more individually oriented than in rural areas, with a stronger focus on housing construction and land issues’ (2007:124).
This study has involved the collection of frequent population-based survey data with indicators on water, sanitation and hygiene, food security, personal security, livelihoods, morbidity and coping strategies (see ). This has involved 11 rounds of data collection. Household surveys were administered in three informal settlements, Korogocho, Mukuru and Viwandani in Nairobi.
Approximately 1500 to 1700 households were sampled in each round of study, with the exception of round eight (1165 households), which focused specifically on two locations in Nairobi (see ). Monthly market price data were also collected to assess for fluctuations of in food prices in study sites. Further, focus group discussions were conducted with residents from informal settlements in order to probe further on findings from the data analysis and the geo-spatial analysis.
Table 3. Dates and number of households sampled in Nairobi settlements.
Sampling for this analysis involved creating an exhaustive household listing for each of the informal settlements prior to each survey period. Because of the dynamic nature of informal settlements, counting the number of household structures was essential for randomising households. After household listings, each informal settlement was divided into segments and a random sample was selected within each section. Further, to ensure quality of data collection, household interviews were recorded via smartphones and all surveys were geo-tagged. Surveys were instantly uploaded to a cloud server where the research team was able to monitor incoming surveys for quality and then download them for analysis.
Data were cleaned and analysed in R, a free software environment for statistical computing and graphics. Chi-square, analysis of variance, Pearson correlation, and linear regression tests were used at α = 0.05 to determine whether variables differed significantly between areas or changed over time. Post-hoc power analysis using medium effect sizes (Cohen, Citation1988) regression analysis (RA) and α = 0.05 showed that sample sizes () provided over 95% statistical power (which is above the recommended level of 80%).
Early analysis from the first five rounds has been published (Amendah et al., Citation2014) with detailed background information on tools and methodology in programmatic reports (Concern Worldwide, Citation2014). For the purpose of this review, an overview of related process will be highlighted as well as the emerging findings from rounds five to nine (August 2012 through February 2014) pertaining to Nairobi. Variation that demonstrates statistical significance will be specifically highlighted in this narrative.
4. Descriptive statistics and empirical analysis
4.1 Descriptive statistics
4.1.1 Livelihoods
Populations surveyed in this analysis reveal the context of urban livelihoods in the informal sector. Casual labour (48%) is shown to be the largest source of income and is also most predominant in the poorest slums (i.e. Korogocho). Monthly salaries (accounting for remuneration in 24% of labour) are found more prominently in higher income areas of Mukuru and Viwandani, with daily salaries accounting for three-quarters of livelihood remuneration for households in Korogocho. Small businesses (13%), hawking (9%) and remittances (1%) are most common in low-income areas.
Within slum populations, there is significant variation in income and expenditure. Significant increases in household income were most evident in Viwandani, with households in Korogocho living on less than two-thirds (63 and 62% respectively) of the income in comparison with households in Mukuru and Viwandani in 2014. Interestingly, Korogocho which is a lower income settlement compared with Mukuru and Viwandani, also demonstrates higher village-level differences in income. Within Korogocho, median household income differed significantly by village (p = 0.05).
Households in the lowest income quintile report spending over 100% of their four-week income on food while the overall food expenditure average is 63.8% amongst respondents from all income quintiles. The proportion of income spent on food is increasing over time in Mukuru (56 to 60%), although this change is not significant. The fluctuation in income which analysed against fluctuations in food expenditures notably reflects the limited ability of households to cope with rising food prices, inflation and other shocks.
4.1.2 Food security and nutrition
This analysis shows an increase in reporting of severe food insecurity over time in all areas. This is more prominent in the lowest income areas of Korogocho, where severe food insecurity according to the Household Food Insecurity Access Scale (HFIAS) increased significantly from 45% in August 2012 to 66% in November 2013 (χ2 = 57.29, df = 9, p < 0.001). Dietary diversityFootnote1 is also significantly declining over time, especially in Korogocho where the average number of food groups consumed per week (out of a possible 12) decreased significantly from 6.74 in August 2012 to 5.03 in November 2013 (F = 85.99, df = 3, p < 0.001).
Overall, households in the lower income quintile reported less meals/day for children, lower dietary diversity and more food insecurity. A weak and negative correlation between income and food security exists throughout all areas of study (t = 14.45, df = 1958, p < 0.001, r = −0.31).
Global acute malnutrition (GAM), as a measure of acute and chronic vulnerability, includes cases of severe acute malnutrition and moderate acute malnutrition in children between six and 59 months of age. Malnutrition is evident in all the areas of study. Further, the number of children at risk for malnutrition significantly increased over time, specifically in the low-income areas of Korogocho (see ).
Table 4. Proportion (%) of children aged between six and 59 months at risk or with severe or moderate acute malnutrition.
Although the proportion (%) of GAM and children at risk for malnutrition is lower than Humanitarian Charter and Minimum Standards in Humanitarian Response (SPHERE) thresholds for emergency intervention (>15%), it is important to take into account the absolute numbers of children living with malnutrition in these high-population areas (). These absolute numbers are substantially higher than many emergency areas of the country where there are high rates of malnutrition (above SPHERE standards), with double the burden of malnutrition in the poorest urban households in comparison with rural areas (Beyer et al., Citation2013).
Table 5. Urban population, target groups and acute malnutrition caseloads (2013).
Household hunger appears to be an indicator correlated with higher rates of childhood malnutrition in the areas of focus in this analysis. Households reporting moderate and severe hunger also reported more cases of GAM and children at risk for malnutrition. However, there only appears only to be a weak positive correlation between middle upper arm circumference (as a screening measure of being at risk for or of acute malnutrition in children) and either household hunger scale (r = 0.117) or income (r = 0.114). Households reporting moderate and severe hunger also reported more cases of GAM and children at risk for malnutrition (although this was not found to be statistically significant).
4.1.3 Water, sanitation and hygiene
Access to water has also remained unchanged over time in the three urban sites. Close to 50% of households in the Nairobi study areas (Korogocho, Mukuru and Viwandani) do not meet the minimum SPHERE standard of 15 litres of water per person per day (see Appendix A). The number of households that do meet this standard is declining in Mukuru and Viwandani. In fact, households in Viwandani that met this SPHERE standard significantly declined from 61% in August 2012 to 51% at the end of 2013 (χ2 = 38.14, df = 4, p < 0.001), showing a worsening in household water access. Interesting is that time taken to reach the water source for all sites (3.28 minutes) is within the SPHERE standards of a maximum 500 metres (approximately six minutes walking), highlighting that there are other barriers which affect access in informal settlements.
4.1.4 Health and health-seeking behaviour
In this study, approximately half of households (48%) report illnesses in a two-week recall period with 1.32 persons reporting being ill in each household (see Appendix A). The proportion of household members reporting illness is highest in Viwandani (45%) followed by Mukuru (42%) and Korogocho (33%). In Korogocho, 37% of households report cases of illness for children under five years of age. More people are seeking treatment in pharmacies/chemists than any other health institution. Eighty-eight per cent of households sought treatment for reported illnesses, and out of these 40% sought treatment in pharmacies/chemists.
4.1.5 Personal security
In this analysis, there is an increase in the perceptions of insecurity over time (see Appendix A). More households are reporting fire, mugging, eviction and burglary in Nairobi, with security threats in all areas (see Appendix A). In Korogocho (Nairobi), for example, burglary increased from 15% to 21% between August 2012 and November 2013 while evictions increased from 4% to 18% and fires increased from 4% to 10% over the same period. In Viwandani, mugging increased from 42% to 54% while burglary increased from 32% to 36%, while households in Korogocho (70.8%) and Mukuru (63%) predominantly experienced mugging.
Perceptions of insecurity outside the home were highest in Korogocho, where 52% of respondents expressed feeling scared walking in the community. There is also a notable rise in the use of avoidance measures due to insecurity. In Mukuru, for instance, 16% of households reported using avoidance measures in August 2012. This proportion increased to 20% in April 2013. The security situation seems to be deteriorating in Mukuru and Korogocho based on the number of those who felt scared in the community and those also reporting mugging and burglary.
4.1.6 Coping strategies
This analysis notes an increased number of households pulling children out of school due to high school fees and other school-related costs as a negative coping strategy. A number of households also opted to remove children from school, to assist parents in income generation. On average, 22% of households removed their children from school. In Korogocho, where the largest proportion of drop-outs was recorded, this proportion increased from 17% to 22% between August 2012 and November 2013. As another negative coping strategy, 46% of households in all study areas purchased food on credit. On average, 23% of households have taken a loan to buy food or other essential goods, with no significant changes over time when priority is given to food expenditure (as opposed to school expenditure).
The number of coping strategies used did not change considerably over different rounds of data collection. An average of 72% of households used at least one of the coping strategies shown in . Close to half the households (46%) used credit (purchasing on credit) as a coping strategy. Use of credit was substantial in the lowest income areas of Korogocho (52%). The average debt was highest in Mukuru, at 4536.78 Kenya Shillings (KES) per month, while in Korogocho it was 2456.86 KES per month. Households, especially those in lowest income areas (Korogocho) and lowest income quintiles spend more than they earn, with much of this going towards purchasing food.
Figure 1. Percentage coping strategies used by households Source: Concern Worldwide (Citation2014, February).
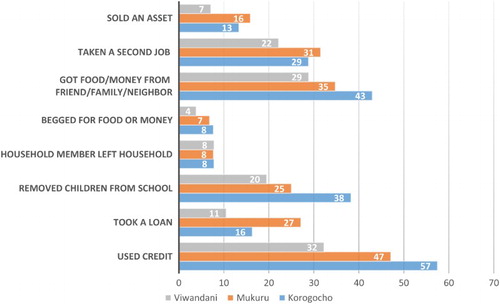
With rapidly changing food prices, insecurity, high school fees and other factors that cause variations in income, households cope by borrowing to be able to meet these needs. A significant proportion (18%) of households also took a loan in order to cope with the harsh economic realities.Footnote2
4.2 Empirical analysis
Trend data reveal that the situation for many slum dwellers in IDSUE study sites is deteriorating. While this analysis has maximised exploring concepts of urban vulnerability and resilience against data that were available, this provided a partial ability to explore the resilience of households and individuals. Frankenberg et al.’s (Citation2013) framework highlights indicators of resilience that are covered in this analysis such as well-being and basic condition measures known as the initial vulnerability context. This analysis was able to measure some of the shocks and stressors including personal security and market variability (also reported in other publications; Concern Worldwide, Citation2015).
Areas of urban resilience that were not detailed in this analysis, include individual, household and community capacities that are absorptive and adaptive and further impact on the state of well-being as a result of shock and stresses. From the analysis undertaken in this study, insights into these trends will be captured under some broad areas.
4.2.1 Averages mask reality
Even within slum populations there is significant variation in income and expenditure (see and ). A composite indicator of income, food insecurity and household hunger, mapping areas of vulnerability which are noted in red in the upper third of the map, represents a clustering of households with very low income, high food insecurity and high rates of household hunger (see , color online only). This shows areas of geographic vulnerable within slums, where interventions and response could also be focused.
Figure 2. Hotspot map of vulnerable areas in Korogocho, Nairobi Source: Concern Worldwide (Citation2015).
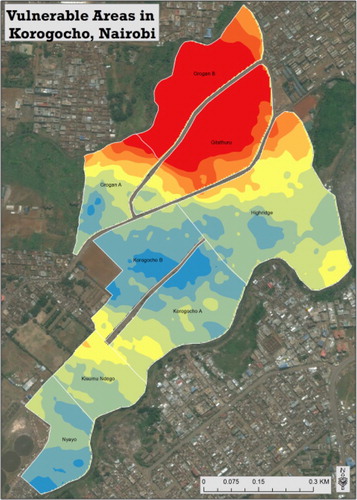
Figure 3. Average household income per income quintile in each area Source: Concern Worldwide (Citation2015). Note: Q1 = bottom quintile, Q2= second quintile, Q3 = middle quintile, Q4 = fourth quintile, Q5 = top quintile.
Household incomes also vary significantly, with households in Viwandani in the lowest income quintiles earning 21.6% of the highest income quintile household income (). Sub-locations with lower income sections fare much worse (see ). While households in the lowest income quintile report spending over 100% of their four-week income on food, the overall food expenditure average is 63.8% amongst respondents from all income quintiles. Vulnerabilities for households in the lowest income quintile include higher food insecurity rates, less dietary diversity, higher prevalence of illness, more insecurity and higher use of negative coping strategies.
4.2.2 Women are disproportionately poor
On average, over 90% of a household's income is earned by the breadwinner (i.e. the highest earner within a household). Most breadwinners in all areas were male (68.2%) but this varied greatly within income quintiles, with the majority of female breadwinner households found in the lowest income quintiles. Female household breadwinners earn approximately 62% that of male household breadwinners in all study areas sampled, showing a significant disparity in the gender dimension to poverty and household vulnerability in the slums (see ). also shows alarming rate of severe household hunger reported in households of Korogocho with female breadwinners – double the rates of those reported in the two other locations.
Table 6. Comparison of female-headed households vs. male-headed households.
4.2.3 Conditions are deteriorating
Trend data reveal that the situation for many slum dwellers in study sites is deteriorating (see Appendix A). However, the rate and magnitude of decline differs between sites and households. While a greater number of households in all areas of study are reporting higher rates of food insecurity, residents in Korogocho (Nairobi) are more affected than those in Mukuru and Viwandani. Residents in these locations experience higher levels of informality and are more reliant on micro-businesses, hawking and use of remittances in addition to casual labour.
4.2.4 Greater resort to negative coping strategies
Focus group discussions reveal that many people in the lowest income quintile, and particularly female-headed households located in Korogocho, are resorting to negative coping strategies for their short-term survival needs, compromising their and their children's long term well-being. Coping strategies mentioned include reliance on loans for basic needs such as food and rent; withdrawal of children from school; transactional sex (by women and their older female children); and crime. In extreme cases, people mentioned abandonment and suicide. Searching for discarded food and scrap metal in the dumpsites was widely mentioned, as were taking on additional jobs washing clothes and ‘extra-marital’ relations with men to supplement one's income. The magnitude of these challenges needs to influence both immediate response and influence-related decision-making at a governance and policy levels.
4.2.5 One size does not fit all
Inequality across informal settlements varies. Often ‘urban policy’ provides a generalised approach to addressing urban vulnerability while ignoring the underlying dynamics at play. There are large differences across informal settlements and a high level of income inequality within informal settlements. The tendency to treat all slum dwellers similarly with targeting of humanitarian and development interventions should be avoided. More effectively targeted urban programming can be achieved by understanding variances in disparities.
Humanitarian responses need to use evidence to guide interventions for vulnerable and affected populations based on special and household characteristics. Furthermore, any slum-upgrading policy or social protection mechanism needs to incorporate slum-specific differences and dynamics. Traditionally, policies have treated slums as somewhat similar, neglecting the fact that there are huge inequalities across slums. These differences would support more effective targeting of social protection interventions to provide more accurate assessments for future urban response.
5. Conclusions
This analysis reveals a heterogeneous picture of urban poverty and vulnerability in study sites. This has both geo-spatial, livelihood and gendered characteristics. While findings suggest a deteriorating situation for those living in the lowest income quintile, particularly for female-headed households, their situation does not classify as a crisis according to current humanitarian frameworks. Mechanisms to situate those living in acute vulnerability and extreme poverty within these frameworks and instruments are required. During economic downturns, emergencies or local fiscal shocks, casual labour and other types of informal employment are most likely to be the first and most affected livelihoods.
These findings also suggest that the nature of emerging vulnerabilities and crisis in Kenya's slums are different from in rural communities. It suggests that urban risks are more embedded at the household rather than population level. For these vulnerable urban contexts, new dimensions and thresholds will need to be established to guide appropriate interventions and responses.
Recommendations from this analysis include the following:
Further dimensions of resilience can guide ongoing work. These include further assessment of individual, household and community capacities that are absorptive and adaptive and analysis on the change in state of well-being. Other dimensions include further understanding the impact of the shock or stress at a household or individual level as well as the impact of interventions.
Indicators of the HFIAS and Household Hunger Scale (HHS) can be tested further to assess for sensitivity and variability. Severe food insecurity has shown variability as an indicator with increases over time demonstrated in this analysis. The HFIAS has emerged as an indicator that is sensitive to measure change at a household level. While dietary diversity has shown promise in broader work on resilience (Barrett & Heady, Citation2014), dietary diversity in these analysis as a stand-alone indicator has not demonstrated variability (see Appendix A).
Withdrawal of children from school as a negative coping strategy may also serve as a measurable indicator for assessing risk to shocks as well as vulnerability in urban populations. This analysis has seen measurable fluctuation in withdrawing children from school as a negative coping strategy (related to informal as well as formal costs).
Measuring livelihood indicators would provide depth in understanding for household vulnerability, resilience as well as geo-spatial profiling. With 50% of households depending on casual labour as a source of livelihood, there is a high proportion of income being spent on food, with female-headed households being more affected.
Because the proportion of households accessing the recommended SPHERE standard of 15 litres of water per person per day is 54% in Nairobi, strengthening this area of access to clean water remains a priority for addressing public services, governance and policy to reach vulnerable urban households.
With a notable increase in the number of households experiencing various shocks particularly in Nairobi (see Appendix A), there is a need to continue surveillance measures and support individual, community and security responses that aid in addressing these complex challenges.
A range of indicators have been reviewed to assess the early understanding of household responses to shocks and stresses. These include: number of households with illness in the last two weeks, an experienced shock in the last four weeks, avoidance behaviour, credit, gender of the household head, the dependency ratio, source of livelihood, personal security within the households and lowest income quintile. Exploring dimensions of migration and forced migration of households would also strengthen the understanding of shocks and stressors faced by households.
Initial indicators (individual and composite) from this analysis are being undertaken in further work to measure the needs of more vulnerable urban communities, specifically in Korogocho. Recommendations and actions to measure variability and sensitivity of these dimensions will be part of this forthcoming work. Exploring the relationship of coping mechanisms with variations in shocks and their impact will also help to gain an understanding of how these dimensions can guide the establishment of threshold(s) or trigger(s) for initiating response in urban contexts.
Gendered dimensions of social capital, social exclusion, coping, decision-making and vulnerability would strengthen some of the initial work in this area. Social capital would focus on qualitative elements underlying social organisations including networks, norms and social trust that can serve as assets for communities to engage and benefit from collective action (Bernier & Menzen-Dick, Citation2014). Additional work needs to be undertaken in order to contrast these against emerging measurements of resilience in other urban and rural contexts. A resilience lens provides the opportunity to adequately guide related responses in urban informal settlements.
Finally, there is a great opportunity to build on prior work on social transfers in urban contexts. While the Government of Kenya has led in establishing these responses at a country level, development of appropriate social protection measures for vulnerable urban populations can build on elements of this analysis. Other social protection mechanisms can also be utilised to strengthen the response to vulnerable urban households. These measures could expand the focus of collective action that supports households to respond to shocks and stresses (Frankenberg et al., Citation2013).
Acknowledgements
Concern Worldwide would like to thank the US Agency for International Development – Office of Foreign Disaster Assistance for their support of IDSUE.
Broader urban programme efforts in Nairobi were undertaken under the leadership of the Ministry of Health, UNICEF Kenya and Concern Worldwide.
Disclosure statement
No potential conflict of interest was reported by the authors.
Notes
1FAO (Citation2010): a household that consumes less than four out of the 12 food groups has lowest dietary diversity; between four and five food groups has medium dietary diversity, while six or more food groups has highest dietary diversity.
2Taking a second job is interchangeable with taking an additional job. If the respondents had two jobs, the answer would be yes if a third job was added.
References
- Alinovi, L, Mane, E & Romano, D, 2010. Measuring household resilience to food insecurity: An application to palestinian households. In Benedetti, R, Bee, M, Espa, G & Piersimoni, F (Eds.), Agricultural survey methods. John Wiley & Sons, Chichester, 341–368.
- Amendah, DD, Buigut, S & Mohamed, S, 2014. Coping strategies among urban poor: Evidence from Nairobi, Kenya. PLoS ONE 9(1), e83428. doi: 10.1371/journal.pone.0083428
- Barrett, CB & Carter, MR, 2013. The economics of poverty traps and persistent poverty: Empirical and policy implications. Journal of Development Studies 49(7), 976–990. doi: 10.1080/00220388.2013.785527
- Barrett, C & Headey, D, 2014. Measuring resilience in a risky world. Why, where, how and who? International Food Policy Research Institute. 2020 Conference Brief 1. http://www.2020resilience.ifpri.info Accessed 18 June 2014.
- Béné, C, Godfrey Wood, R, Newsham, A & Davies, M, 2012. Resilience: New Utopia or New Tyranny? IDS Working Paper 405. Institute of Development Studies, Brighton.
- Bernier, Q & Menzen-Dick, R, 2014. Local sources of resilience. Working with Social Capital. Building Resilience for Food & Nutrition Security. 2020 Conference Brief 4. http://www.ifpri.org/sites/default/files/publications/2020resilienceconfpaper04.pdf Accessed 4 October 2014.
- Beyer, L, Wambani, V & Kyalo, K, 2013. Time to think urban … Kenya. Field Exchange 46: Special focus on urban food security & nutrition, September. p49. www.ennonline.net/fex/46/urbankenya Accessed 15 March 2015.
- Carter, MR & Barrett, CB, 2006. The economics of poverty traps and persistent poverty: An asset-based approach. Journal of Development Studies 42(2), 178–199. doi: 10.1080/00220380500405261
- Cohen, J, 1988. Statistical power of analysis for the behavioural sciences. 2nd edn. Lawernce Erlbaum Associates, Publishers, New York.
- Concern Worldwide, 2014. Indicator development for surveillance of urban emergencies. Year 3 Research Report – August 2012 to December 2013. Nairobi.
- Concern Worldwide, 2015. Indicator development for the surveillance of urban emergencies – IDSUE. Nairobi.
- Davis, DE, 2012. Urban resilience in situations of chronic violence. Massachusetts Institute of Technology, Cambridge. http://www.urcvproject.ort/uploads/Davis_URCV_Final.pdf Accessed 15 March 2015.
- Engle, PL, Castle, S & Menon, P, 1996. Child development: Vulnerability and resilience. Social Science and Medicine 43(5), 621–635. http://works.bepress.com/pengle/5 Accessed 15 March 2015. doi: 10.1016/0277-9536(96)00110-4
- FAO (Food and Agriculture Organisation of the United Nations), 2010. Guidelines for measuring household and individual dietary diversity. FAO, Rome. http://www.fao.org/docrep/014/i1983e/i1983e00.pdf Accessed 15 March 2015.
- Frankenberger, T, Spangler, T, Nelson, S & Langworthy, M, 2012. Enhancing resilience to food security shocks in Africa. Discussion Paper. http://www.fsnnetwork.org/sites/default/files/discussion_paper_usaid_dfid_wb_nov._8_2012.pdf Accessed online 4 October 2015.
- Frankenberger, T, Mueller, M, Spangler, T & Alexander, S, 2013. Community resilience: Conceptual framework and measurement feed the future learning agenda. Westat, Rockville.
- IASC (Interagency Standing Committee), 2010. IASC strategy. Meeting humanitarian challenges in urban areas.
- Levine, S, Pain, A, Bailey, S & Fan, L, 2012. The relevance of ‘resilience’? Humanitarian Policy Group, Policy Brief (49). Overseas Development Institute, London.
- Maxwell, D, Vaitla, B, Tesfay, G & Abadi, N, 2013. Resilience, food security dynamics, and poverty traps in northern Ethiopia. Analysis of a biannual panel dataset, 2011–2013. Feinstein International Center Report. Tufts University, Medford.
- Metcalfe, V, Pavanello, S & Mishra, P, 2011. Sanctuary in the city? Urban displacement and vulnerability in Nairobi. HPG Working Paper. http://www.rescue.org/sites/default/files/resource-file/Sanctuary%20in%20the%20City.pdf Accessed 20 March 2015.
- Muggah, R, Agevi, E, Mavita, J, Mbatha, P & Odary, K, 2012. Urban resilience in situations of chronic violence. Case study of Nairobi, Kenya. http://www.urcvproject.org/uploads/Nairobi_URCV.pdf Accessed 20 March 2015.
- Mukiira, C & Ibisomi, L, 2012. Health care-seeking practices of caregivers of under-five children with diarrheal diseases in two informal settlements in Nairobi, Kenya. African Population and Health Research Center, Nairobi.
- Murithi, M, 2013. The determinants of health-seeking behaviour in a Nairobi slum, Kenya. European Scientific Journal 9(8), 151–164.
- Pingali, P, Alinovi, L & Sutton, J, 2005. Food security in complex emergencies: Enhancing food system resilience. Disasters 29, S5–22. doi: 10.1111/j.0361-3666.2005.00282.x
- Republic of Kenya, 2008. Kenya vision 2030. A globally competitive and prosperous Kenya. Ministry of Planning and National Development and the National Economic and Social Council (NESC), Government of Kenya, Nairobi.
- Republic of Kenya, 2010. Constitution of Kenya 2010. Government of Kenya, Nairobi.
- Republic of Kenya, 2011a. National urban development policy. Office of the Deputy Prime Minister and Ministry of Local Government, Government of Kenya, Nairobi.
- Republic of Kenya, 2011b. Urban areas and cities Act. No. 13 of 2011. National Council for Law Reporting, Government of Kenya, Nairobi.
- Shaw, K, 2012. Reframing resilience: Challenges for planning theory and practice. Public Policy and Administration 13(2), 308–312.
- The Rockefeller Foundation, 2015. Resilience. https://www.rockefellerfoundation.org/our-work/topics/resilience/ Accessed 18 September 2015.
- UN-Habitat (United Nations Human Settlements Programme), 2008. The state of African cities – A framework for addressing urban challenges in Africa. UN-HABITAT, Nairobi.
- UN-Habitat (United Nations Human Settlements Programme), 2011. 2008, The state of African cities – A framework for addressing urban challenges in Africa. UN-HABITAT, Nairobi.
- UN-Habitat (United Nations Human Settlements Programme), 2015a. Habitat III Issues Paper. Urban and spatial planning and design. http://unhabitat.org/wp-content/uploads/2015/04/Habitat-III-Issue-Paper-8_Urban-and-Spatial-Planning-and-Design.pdf Accessed 9 September 2015.
- UN-Habitat (United Nations Human Settlements Programme), 2015b. Housing and slum upgrading. http://unhabitat.org/urban-themes/housing-slum-upgrading/ Accessed 9 September 2015.
- UNICEF (United Nations Children's Fund), 1998. The state of the world's children. Focus on Nutrition. UNICEF, New York.
- UNICEF (United Nations Children's Fund), 2012. State of the World's Children 2012. Children in an Urban World. UNICEF, New York. http://www.unicef.org/sowc2012/ Accessed 4 October 2014.
- UNICEF (United Nations Children's Fund), 2013. UNICEF Eastern and Southern Africa Region – Resilience. Position Paper. UNICEF, Nairobi.
- UNICEF (United Nations Children's Fund), 2014. UNICEF Eastern and Southern Africa Region – Urban Situational Analysis. Draft July 2014. UNICEF, Nairobi.
- United Nations, 2014. Leaders at UN summit take steps to ensure food security for 9 billion people by 2050. Climate Summit 2014, Catalyzing Action. http://www.un.org/climatechange/summit/2014/09/leaders--un--summit--take--steps--ensure--food--security--9--billion--people--2050/ Accessed October 4 2014.
- Vaitla, B, Tesfay, G, Rounseville, M & Maxwell, D, 2012. Resilience and livelihoods change in tigray Ethiopia. Feinstein International Center, Tufts University, Somerville. http://fic.tufts.edu/assets/Resilience-and-Livelihoods-Change-in-Tigray-FINAL-30-10-12.pdf Accessed 4 October 2014.
- Walker, SP, Wachs, TD, Gardner, JM, Lozoff, B, Wasserman, GA, Pollitt, E & Carter, JA, 2007. Child development: Risk factors for adverse outcomes in developing countries. Lancet 369, 145–57. http://ezproxy-prd.bodleian.ox.ac.uk:2077/S0140673607600762/1-s2.0-S0140673607600762-main.pdf?_tid=a8993ba8-d663-11e4-af51-00000aacb362&acdnat=1427668604_9e1dcf04bb40a681e54b5b8031e6c3fd Accessed 4 October 2014. doi: 10.1016/S0140-6736(07)60076-2
- Walker, SP, Wachs, TD, Grantham-McGregor, S, Black, MM, Nelson, CA, Huffman, SL, Baker-Henningham, H, Chang, SM, Hamadani, JD, Lozoff, B, Meeks Gardner, JM, Powell, CA, Rahman, A & Richter, L, 2011. Inequality in early childhood: Risk and protective factors for early child development. Lancet 378, 1325–38. http://ezproxy-prd.bodleian.ox.ac.uk:2077/S0140673611605552/1-s2.0-S0140673611605552-main.pdf?_tid=80ab26e2-d659-11e4-986c-00000aacb35d&acdnat=1427664242_35fc792650cbff1aa7ce7e9770af1999 Accessed 4 October 2014. doi: 10.1016/S0140-6736(11)60555-2
- Wamsler, C, 2007. Coping strategies in urban slums. http://www.academia.edu/4325256/Coping_strategies_in_urban_slums_in_State_of_the_World_2007_our_urban_future_p._124_Earthscan Accessed 15 March 2015.
- WHO (World Health Organization), 2015. Urban population growth. http://www.who.int/gho/urban_health/situation_trends/urban_population_growth_text/en/ Accessed 9 September 2015.
- WHO (World Health Organization) & DfID (Department for International Development), 2009. Summary and policy implications – VISION 2030. The Resilience of Water Supply and Sanitation in the Face of Climate Change. WHO, Geneva. http://www.who.int/water_sanitation_health/publications/vision_2030_summary_policy_implications.pdf Accessed 4 October 2014.
Appendix A. Table of key indicators in Nairobi (Mukuru, Korogocho and Viwandani) (Concern Worldwide, Citation2015)
The following table lists indicators that have shown to be the most sensitive or also illustrate the level of deprivation faced by the household. This draft list of indicators provides guidance for a framework from which to develop thresholds and action triggers.