
ABSTRACT
This article interrogates the impact and nature of South Africa’s post-apartheid economic growth performance through the lens of human capital investment with a particular emphasis on higher education. The South African economy has been characterised by a skills-biased trajectory, ensuring jobs for the better educated. By differentiating between tertiary and vocational training, we find that further education and training (FET) graduates are almost as likely to be employed as school leavers without higher education. We analyse the extent to which the educational attainments of labour affect the nature and trajectory of economic growth in South Africa, by estimating Olley and Pakes’ two-stage regression on a modified Cobb–Douglas production function. The results indicate that the degree cohort contributes to economic growth whilst other higher education institutions, including FET colleges, do not productively contribute to economic growth.
1. Introduction
The post-apartheid South African economy has been characterised by one of the longest growth periods in its economic history, with 69 periods of quarterly real gross domestic product (GDP) growth broken only by four brief quarters of negative growth due to the global recession. The total average annualised quarterly growth rate over the period was thus 3.2% per annum, and, while employment increased, it disproportionately favoured workers with higher levels of education. However, the supply of labour is characterised more readily by a large contingent of individuals with minimal levels of skills and experience for work. This classic skills-mismatch problem between labour demand and labour supply, and between education and economic growth, has not only inadvertently determined the demand for, and productivity of, labour in the economy, but has also defined and characterised the returns to households and individuals on the basis of their human-capital attributes. This article interrogates the impact and nature of South Africa’s post-apartheid economic growth performance through the lens of human capital investment with a particular emphasis on higher education.
This study examines how South Africa’s education cohorts have interacted with the labour market and contributed to economic growth over the past two decades. By differentiating between tertiary and vocational training, we find that further education and training (FET) graduates are almost as likely to be employed as school leavers without higher education. We analyse the extent to which the educational attainments of labour affect the nature and trajectory of economic growth in South Africa, by estimating Olley & Pakes’ (Citation1996) two-stage regression on a modified Cobb–Douglas production education function. The results are striking and indicate that the degree cohort contributes to economic growth whilst other higher education institutions, including FET colleges, do not productively contribute to economic growth.
This article is structured as follows. Section 2 describes the datasets used in the study. Section 3 presents a descriptive overview of the relationship between education and labour demand. This includes an examination of the link between education and occupational employment growth trends. In Section 4 we consider, through the use of a modified Cobb–Douglas production function, the output labour elasticity of each educational cohort in the post-apartheid economy. In essence, we are measuring whether skilled or educated workers have a strong associative relationship with the growth of the South African economy. Section 5 concludes the study.
2. Data and methodology
South Africa has a wealth of nationally representative surveys available for public research use that date back to the mid-1990s. The first of these surveys was the annual October Household Survey, conducted in the 1990s, which has been extensively utilised by local as well as international scholars alike to provide the first glimpse of the South African labour market composition in the post-apartheid era. This later gave way to the Labour Force Survey (LFS), carried out biannually between the years 2000 and 2007. In 2008, the frequency of collecting labour market-related data was augmented again to every quarter; hence the Quarterly Labour Force Survey (QLFS) replaced the existing LFS. Owing to the design and structural similarities between these surveys and the high rates of usage by researchers in providing crucial labour market information, a combined dataset of these surveys was constructed by DataFirst at the University of Cape Town under the data project umbrella called the Post-Apartheid Labour Market Series (PALMS). This dataset, expanding over 17 years (1995–2012), combines most of the similar labour market survey datasets into a single, serial statistical data source.
Using the PALMS, we firstly provide a descriptive overview of unemployment and the sectoral-education mix employed in the economy. Secondly, for the microproductivity analysis of labour inputs, we take advantage of the PALMS’ projections on the population sizes of individuals employed in the economy, the labour force, the working age, and the population by education. In total there were 39 observations for the micro-productivity analysis of effective labour inputs. More specifically: six annual October Household Surveys from 1994 to 1999, 16 biannual LFSs from 2000 to 2007, and 17 QLFSs from Quarter 1 2008 until Quarter 1 2012. We then align these labour market series with the data for output (or GDP) measured by value added at constant 2005 prices and the financial data of investment and capital stock for Statistics SA and the South African Reserve Bank (SARB).
3. Education and the labour market: A descriptive overview
This section aims to provide a descriptive overview of the changes in composition of South Africa’s labour market with respect to education between 1995 and 2012. presents the long-term average unemployment rate with the 95% confidence intervals for the periods between 1995 and 2012 by educational cohort. The national long-term average unemployment rate in South Africa for the period under review is 24.2% (with the 95% confidence interval between 18.7 and 29.7), suggesting a systematic adverse labour market environment for jobseekers in the country. The unemployment measure is strongly associated with the educational attainments of individuals. More specifically, labour demand is greater among those who are highly educated, with the long-term unemployment rate for degree-holders at only 4.2%. This is nearly eight times lower than the mean unemployment rate for individuals with only Grade 8 to 11 schooling, at 30.9%. Certificate-holders (and diploma-holders)Footnote1 have an unemployment rate of 11.3%, slightly higher than the degree-holders and statistically insignificant in terms of difference from the next group’s unemployment rate: those with no education at a 16.0% mean. Unemployment rates for those who have completed Grade 12 and for Grades 0 to 7 are 25.9% and 23.8% respectively.
Figure 1. Long-run unemployment rate by education: 1995–2012.
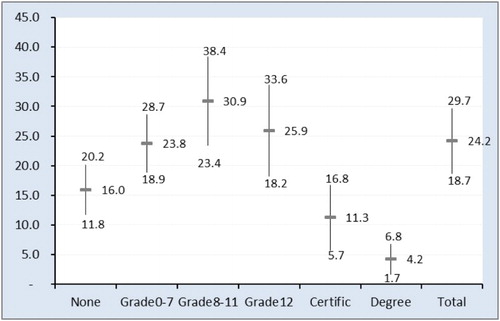
It is worth noting that the reason for the inverted U-shape in the unemployment rate by educational attainment is because the labour supply of those with lower educational attainments remained the same or decreased during the period under review (see Table A1 in ). Hence, the ratio between the number of unemployed and the official labour force is relatively lower for those with qualifications below Grade 8.
Examining the long-run unemployment rates in , the shift in the labour force by educational categories in Table A1, and the sector-skills distribution of labour demand in suggests that the cause of the mismatch in unemployment is mainly due to an excess supply of labour with some education (Grade 8 to 11 and Grade 12) relative to its equilibrating level of labour demand in the market. This is in stark contrast to labour dynamics of the highest educational attainment (i.e. degree-holder), whereby despite having the highest growth rate in its labour force supply (Table A1) at 29.5% per annum over the period under review, the long-run average unemployment rate remains relatively low at only 4.2%. Therefore, according to the data, it is clear that the South African labour market is systematically oversupplied with those that have relatively low levels of education.
Table 1. Growth and change of shares in employment, by sector: 1995 and 2012.
Average unemployment rates for those with only a high-school education are the highest (Grades 8 to 11 and Grade 12). In addition, these high school graduates and drop-outs constitute the bulk of the unemployed population. There are two aspects which may explain the high levels of unemployment observed. Firstly, high-school enrolment over the past 20 years has meant that more young people are entering the labour force and that the labour market is unable to absorb these new work-seekers. Secondly, the quality of school-leavers’ education has not afforded them employment opportunities. Research shows that poorer children enter school with a ‘cognitive disadvantage’, because they have not had access to the resources and stimulation that well-off children enjoy (Van der Berg et al., Citation2011:7). It is further apparent that schools designed for African learners (i.e. the majority of school learners) have been underperforming. Secondly, the growth of the labour market has favoured more qualified workers, and particularly those with tertiary education as opposed to those with a FET qualification. If we compare higher education unemployment rates, we find that degree-holders have the lowest mean rate of unemployment. Thirdly then, for those with a certificate, labour market outcomes are poor, as the unemployment rate peaking at 16.8% is statistically indistinguishable from those with no education, those with Grades 0 to 7, and even individuals with a Grade 12. In absolute terms, then, in 1995 we find that four times more certificate-holders were unemployed than those with a degree, and in 2010 five times more certificate-holders were unemployed than those with a degree. This is a key result: it suggests that, during the post-apartheid period, FET and private colleges have been unable to improve the employment outcomes of individuals relative to the performance of the entire schooling system, except for those with incomplete secondary education.
3.1. The sector-skills distribution of employment
The structural foundation of the South African economy has become more capital-intensive over the past 15 years, and, as a result, the labour demand trajectory has been biased towards higher skilled workers. This becomes more obvious when examining the sectoral skills mix by education cohort. presents the growth rates, as well as the change in share of employment by occupation and educational categories, between 1995 and 2012. More specifically, the average annual growth in employment is calculated as the simple growth rate of employment between 1995 and 2012, averaged over the 17-year period. The share column shows the difference in employment shares between the two years by education and occupational cohorts.
The average annual growth rate is positive and significant when there is a discernible increase in the employment for that specific occupational category with the corresponding levels of academic qualification. The simple shift in share is more powerful, which measures the change in composition of employment, determined by two drivers: firstly, the change in absolute number employed; and, secondly, the change in other worker cohorts. Hence, the change in share is a relative measure. It is crucial to interpret both the growth rates and change in share of employment together; that is, both the absolute and relative measure of employment growth. It is possible that an increase in absolute employment is associated with a negative share shift, which means that, although employment for that particular category of workers has increased, the rest of the workers in the economy have been growing at an even faster rate, and vice versa.
shows that, over the 17-year period, aggregate employment increased on average by 2.1% per annum. Results further show that the incidence of this employment growth was not evenly distributed across educational or occupational cohorts, with growing employment rates found among those who are better educated. By education first, the growth rate for degree-holders increased at an annual average rate of 7.5% during the period under investigation, compared with −3.3% for those without any form of education, thus confirming the result that the demand for uneducated labour was indeed declining. Growth rates in employment for those between Grade 0 and Grade 12 were 2.0% per annum, and 4.5% for certificate-holders. The shifts in employment shares for degree-holders and certificate-holders were 3.3 and 3.0 in percentage shares respectively, compared with −6.0 and −0.6 percentage shifts for workers with Grade 1 to 12 qualifications and no education.Footnote2
The South African economy is increasingly demanding highly skilled and educated workers to match the growth of skilled occupations. One should expect to see not only significant increases in both absolute and relative shares of workers who are highly educated, but also according to the type of jobs that workers occupy. An examination of the growth rates by education and occupation categories shows that professions requiring highly trained and highly educated workers tend to reflect significant increases in both absolute number and shares. shows that jobs that are generally filled by educated workers (managers, technical and associates, clerks and workers in service and sales), tend to reflect significant increases in both the number of employed workers as well as in shares in the economy. Among managers and degree-holders in particular, there was a significant gain in employment and in shares compared with those with lower levels of educational attainment, growing at 17.4% per annum and with a 1.3 percentage change in shares. Certificate-holders grew at a much slower rate of 12.1%, gaining 1.1% of the employment shares, with Grades 1 to 12 at 2.5% and only a 0.2 gain in shares. This signifies that education plays an important role in terms of employment (as long-term unemployment rates suggested earlier). Simply put, in some specific occupational categories, those with higher qualifications tend to be favoured relative to workers without education, employed for the same jobs.
While we see a defined increase in skilled occupations for degree-holders, the result for certificate-holders is less obvious and is concentrated across medium-skilled and high-skilled occupations. Certificate-holders showed high growth in the professional occupational category, with 32.5% annual growth in employment as well as a 10.8% growth in the elementary category. In terms of the professionals category, we also see a 73.4% growth rate in professionals for the Grade 1 to 12 categories, which is due to an approximate 72% growth in professionals for those with a Grade 12 qualification and not representative of those with lower than a Grade 12 qualification. The declining share of the technical occupational category for certificate-holders was brought about by a transfer of employment into the manager and professional category, but also for clerks, services, and sales, as well as a marginal increase in the lower-skilled occupations. In absolute terms, however, the largest employers of certificate-holders are in the technical and associates category, followed by clerks. While growth of the technical category is fairly healthy at 2.5%, the nature of employment demand is such that traditionally ‘technical’ jobs are being done by those who are more qualified. Evidence of this is the stark growth of 32.7% among degree-holders working in technical jobs, while the certificate cohort exhibited no growth in this category, which could suggest that graduates from the FET system are not adequately trained in this area and are being replaced by degree-holders.
Another piece of evidence that demonstrates the skills bias is the fact that, even for occupations which are generally considered to be low-skilled and do not necessarily require formal education, we see workers with formal education replacing those with no education. More specifically, craft and trade and elementary jobs are increasingly taken up by workers with at least some formal education and above (even certificate), clearly replacing those who obviously were working in the same occupations with no education. During the period under examination, employment for individuals with no education working in craft and trade, operator and assembler, elementary, and domestic occupations shrank significantly at averaged annual growth rates of −2.5, −4.1, −3.3, and −3.6 respectively. The employment shares for low-skilled occupations also declined, further lessening the employment opportunities for those with no formal education.
4. Human capital and growth outcomes: A micro-productivity analysis
Education has long been viewed as a determinant of long-term economic growth and well-being. Barro (Citation1991, Citation1997) and Mankiw et al. (Citation1992) compiled a vast literature of cross-country growth regression and found a significant, positive association between the processes of human-capital accumulation and skills development represented by quantitative measures of education, development, and economic growth (also Krueger & Lindahl, Citation2001; Temple, Citation2001; Sianesi & Van Reenen, Citation2003; Sala-I-Martin et al. Citation2004). The theoretical-growth literature emphasises three channels through which education can impact on economic growth. Firstly, education increases the human capital inherent in the labour force, increasing labour productivity and thereby engendering transitional growth toward a higher equilibrium level of output (Mankiw et al., Citation1992). Secondly, education adds to the innovative capacity of technology to produce new products and processes, and therefore growth (Lucas, Citation1988; Romer, Citation1990; Aghion & Howitt, Citation1998). In addition, it changes the nature of job skills demanded, and therefore the labour market growth trajectory (Brynjolffson & McAfee, Citation2014). Thirdly, education can facilitate the diffusion and transmission of information needed to understand and process new ideas and implement new technologies (Nelson & Phelps, Citation1966; Benhabib & Spiegel, Citation1994).
Thus far, we have shown the impact of the growth trajectory on the labour market. In the next section, we examine the impact of education through the analysis of labour productivity on growth.
4.1. Simple output employment elasticities
A simple approach to investigating the marginal product and productivity of labour is to measure the responsiveness and sensitivity of growth on the change in labour by educational category. This is achieved by calculating the simple output-employment elasticity () as the percentage change in output (Y) over the percentage change in labour input (L) within an educational category (
):
(1) A positive ratio suggests that a 1% increase in employment is associated with a positive change in output by the magnitude of the ratio. A greater unit of elasticity is associated with a higher rate of output for each unit of labour, and therefore the more productive the impact of the associated level of education. If the ratio is less than one, then a given percentage change in labour is associated with less than one unit change in output. This simple measure should give us a sense of how much each educational category of labour is implicitly contributing to growth. In this way, the most productive categories of educated labourers in the economy could be identified. It should also be highlighted that the output labour elasticity measure could also be inversed into labour output elasticity, which measures the responsiveness of employment change over the output change. This measure is often used to investigate the impact of growth on employment and so provide a sense of the rate of economic growth required in order to bring about a targeted growth rate in employment as projections. Indeed, the higher the ratio for productivity elasticity (output growth over labour growth), the lower the ratio for its invert: labour output elasticity.
presents the median simple output labour elasticities for all four categories of labour, namely employment, labour force, working age, and population, over the educational cohorts. At the micro-firm level, labour could be measured by the number of workers employed in the firm, and the interpretation is narrowed to real hours worked as a factor of production. At the national level, labour could be measured as the total number of employed workers (the labour force), or as the working-age population being the total population, with each yielding a rather different interpretation of the results. For the employed, the economy is assumed to be production driven and the interpretation of factor elasticity is close to its ‘true’ labour productivity in a strict but inaccurate sense, since the outputs in the economy are not only used to serve those who worked, but also those who do not work. In other words, it is the responsiveness of growth driven only by those who work and contribute to growth as the true labour productivity. The labour force includes both working individuals as well as workers who are non-contributing labourers and so the interpretation of elasticity is widened to include the unemployed. The working-age population, as a proxy for labour, measures the responsiveness of eligible workers. Therefore, the working-age population elasticity could be seen as the potential productivity of labour. Finally, the total population as labour input assumes that the economy is a completely demand-driven or consumption-driven economy, because it takes into account all dependents in the economy as part of the output labour growth calculation.
Table 2. Simple output-skills elasticity: 1995–2012.
Results for the simple aggregate output employment elasticity show that there is a positive growth relationship between economic growth and labour growth at the aggregate, irrespective of the labour market definition used. As expected, the magnitudes of the elasticity measures vary significantly. South Africa’s median output labour elasticity for the period 1995–2012 was 0.4 for employment and the labour force. A one percentage point change in employment or the labour force is associated with a 0.4% change in output growth in the same direction. Hence, the responsiveness is positive, yet inelastic. The median responsiveness for both output-working age and output-population elasticities for the period under review is also positive but elastic at 2.0 and 3.1. This does not mean that these two definitions of labour have an impact on output compared with employment or labour force growth. Instead, the positive and elastic growth ratios could suggest that the economy is leaning towards consumption-driven growth, as these two categories also include dependents and other non-contributing workers. This is one of the difficulties in interpreting simple elasticity, as it does not specify the differences between labour that is working and labour that is not working, but only does so generally. The labour force is being utilised as the common measure for labour.
Output labour elasticities for labour with no education suggest that, irrespective of the labour definition used (save for labour using the population definition, which has positive elasticities for all educational categories), there is a negative growth relationship between growth and employment. In contrast, those with secondary schooling and higher all have positive, although inelastic, ratios between GDP growth and employment growth. Those with primary education yield mixed output labour elasticity results. In sum, then, the general trend for the simple elasticity results suggests that, over the 17-year post-apartheid period, the South African economy was mostly geared towards a growth model largely dependent on medium-skilled to high-skilled labourers with educational attainment no less than secondary schooling. This trend, where the relatively more educated contribute more positively to economic growth, will ultimately characterise the nature of returns to production in South Africa’s growth trajectory.
4.2. Education as a determinant of growth: An econometric approach
A more sophisticated approach to investigating the responsiveness of growth on labour is by estimating the Cobb–Douglas production function via an econometric modelling method (ordinary least squares [OLS] or other non-linear models). The distinct advantage of the Cobb–Douglas function is that it is relatively easy to identify whether the estimated coefficients and the resulting returns to scale on the factors are broadly in line with common sense, while controlling for other factors. The most basic, conceivable, two-factor production function of the Cobb–Douglas form is:(2)
where Y is output, K is physical capital stock, L is labour input, and A is total factor productivity (TFP). Subscript t denotes time, and α and δ the marginal effect of the factors labour and capital on growth.Footnote3 Transforming this simple production function into logarithmic scales allows for the linear regression to estimate the parameters of the factor inputs – their productivities – while controlling for other factors as shown in the following. Our goal is to unpack the coefficients of labour by education, controlling for multiple biases and inconsistency issues in the regression.
Despite its resourcefulness, this construction of the Cobb–Douglas regression has two major econometric problems. Firstly, in this set up, the TFP captured by the composite error term δt as residuals in the OLS is assumed to be an independent stock measure of the unobserved forces of productivity. However, it is highly unlikely that technology, innovation, and institutions, as captured by the TFP, do not correlate with labour’s own productivity. For example, only the educated workers (a portion of labour) know how to comprehend and manipulate sophisticated technology and innovation in order to reap the benefits of TFP for better growth outcomes. This ‘simultaneity’ issue (in the case of an independent variable correlating with the residual term) will render the coefficients of factors biased and inconsistent. The same issue is true for returns on capital and TFP. Secondly, between labour and capital, each factor with the residual term may be non-linearly correlated (Olley & Pakes Citation1996). In the latter case, using the linear models would not be appropriate here.
To address these issues, we devised two major adjustments in the regression to try to ameliorate the potential for biased and inconsistent results of the coefficients. Firstly, we used a series of narrower definitions of labour for factor inputs in the regression. More specifically, we not only estimated coefficients for labour using the labour force definition, but also for employment, the working-age population, and the total population; by educational cohort. The decomposition of labour by education is permitted here because it satisfies the assumption of additive separability of labour input, and, of course, we needed the coefficients for each educational cohort to investigate the responsiveness of different groups of labour on economic growth. Secondly, for capital inputs and to address the issue of non-linearity in the model, we used the two-stage approach proposed by Olley & Pakes (Citation1996) to try to first isolate any potential linkage between capital and TFP through investment, and estimate the non-linear relationship between capital and TFP.
presents the basic OLS results using the simple translog model of the Cobb–Douglas production function, assuming that the TFP is non-intractably invested in either capital or labour. The estimation was run using the PALMS labour data as well as capital and investment data (used in and ) from the SARB for 1995 and 2012. Again, for the sake of analytical completeness, we estimated the coefficients for all four definitions of labour. There were approximately 50 observations for each of the defined labour categories. The estimates suggest that all of the sums of returns to scale between labour and capital (i.e. α + δ) are greater than one and all of the coefficients are positive (except labour using the total population as proxy), irrespective of the definition used for labour. This suggests that the South African economy is experiencing increasing returns to scale.Footnote4 This is a significant result and emphasises that production increases despite a lower increase in labour or capital inputs.
Table 3. Simple two-factor Cobb–Douglas production function model (OLS results), 1995–2012.
Table 4. OLS with investment: 1995–2012.
Table 5. OLS with educational cohort: 1995–2012.
One of the main drivers of production expressed in the literature on endogenous growth, which the simple two-factor production function of Cobb–Douglas does not account for, is investment. In Romer’s (Citation1990) endogenous growth model, investment as savings of capital is one of the key determinants of economic growth rate in reaching the steady state of economic growth equilibrium. presents the results for input coefficients including investment growth. The result exhibits largely the same trend of labour productivity as the original regression. The most significant change is the coefficient for labour using the population definition as proxy, which changed from −0.425 to 0.800. Notice also that the magnitudes (and the significance) of capital abates in the presence of investment as a factor of production (when the population definition is used as a proxy for labour). Investment or general level of technology in the economy is commonly captured by the time trend as an independent variable in the regression when no reliable proxy data for investment are available. To demonstrate this, the regression results in Tables A2 and A3 in show the OLS results with time trend. It is clear that when investment enters the production function as an exogenous variable, the coefficient for time trend in Table A3 becomes zero and statistically insignificant for all definitions of labour except for the population.
Clearly, investment plays an important role in determining the growth rate of the economy in order to have caused such a great shift in the productivity coefficients. This also implies that the translog model of OLS methodology used thus far without the investment variable has been mis-specified. Finally, labour productivity for employment and labour becomes lower and less than capital’s coefficient after investment has been taken into account.
presents the elasticities of labour to output by education after controlling for investment and capital trends for all definitions of labour. The goal is to extrapolate the coefficient measures of the magnitude of percentage change in output, given one percentage change in labour in the educational category, in order to identify which labour-education category has the strongest relationship with economic growth. The labour-education category with the highest positive coefficient means that it has the strongest positive associative relationship with output change, and is therefore potentially the most productive in the economy. Note that we still have not corrected for non-linearity of input factors which may render the results biased and inconsistent.
The results show that, for labour in employment (the first column in the tables), output labour elasticities for matric-holders and degree-holders are positive and statistically significant at 0.275 and 0.119 respectively, while certificate-holders have a negative coefficient significance of output at −0.135. Controlling for other factors such as investment and capital, employed workers with less than a matric qualification do not have a significant associative relationship with economic growth. In terms of the labour force, secondary schooling, matric-holders, and certificate-holders’ productivities are significant; although certificate-holders’ productivity is still negative at −0.191. Degree-holders’ labour output coefficient by education using the labour force definition becomes insignificant. In terms of the working-age group and the total population, individuals with primary, secondary, and degree qualifications – following the logic earlier of interpreting these elasticities as the population’s potential for growth – are positively associated with output movements.
The results in Tables 4 and 5 present a powerful picture emphasising the associative relationship between growth and tertiary education. At the same time, the negative coefficients observed for certificate-holders in are an indication of the lack of growth associated with a FET certificate. A matric certificate returns a more positive relationship to growth than a FET certificate. This emphasises the systemic flaws of the FET system as part of the higher education system, because it is unlikely to produce candidates that will contribute productively to economic growth. The only segment of the higher education system that is positively associated with all but one measure of growth is the university sector.
4.3. Education and growth: An extended econometric model
The Olley & Pakes (Citation1996) methodology for estimating microproductivity is a two-stage, semi-parametric method that controls for both simultaneity and non-linear issues. The first stage of the approach involves the capital accumulation process linking stocks and flows of capital as follows:(3) Here K, the capital stock, is as defined in the original specification and I is the investment flow. This relationship is well conceived in practice as an indisputable connection between investment and capital, and, together, the resulting interaction with production. The centrepiece of Olley & Pakes’s (Citation1996) methodology is the argument that this capital accumulation process can be broadly captured by the contemporaneous values of capital and investment as a polynomial function to the third or fourth order: ωt = f(It, Kt). Using this productivity function, the first-stage estimating equation can be written as:
(4)
The coefficients for the logarithmic terms of labour – or the output elasticity of labour by education (Lt – a vector) α – allow us to unpack the associative relationship between labour and output.
presents the first-stage regression results of Olley and Pakes’s methodology for all definitions of labour. The control variables for capital are made up of polynomials of both capital and investment up to the third order acting as controls, not for interpretation. These controls are used to act as filters to ‘clean’ the capital input factors of simultaneity issues, and, in so doing, making the coefficient estimates for labour consistent. As before, we do not include a constant term here because our model assumes that the effect of TFP is invested within labour by various levels of education as human-capital gains. All four general definitions of labour are included for the sake of analytical completeness and to see whether there is any cause for misspecification compared with the previous OLS regressions.
Table 6. First-stage Olley and Pakes methodology with educational cohorts.
The results in are both interesting and powerful. Firstly, unlike the coefficients for labour by education earlier, elasticities that are of significance do not change sign. The elasticity coefficient for matrics is no longer significant. This indicates that there was a simultaneity issue in the OLS regression and that the estimated coefficients using the Olley and Pakes regression are robust. Employed workers with degrees have a positive associative relationship in production, with an elasticity of 0.104 in the economy, which is statistically significant at the 95% interval. No other groups of labour input with an educational attainment below that are significant, and certificate-holders’ labour-to-output elasticity is indistinguishable from zero. Results for elasticities using more general definitions of labour show that individuals with secondary schooling also have a positive relationship with economic growth, although this is simply the result of an intense massification of secondary-schooling attendees in the period under review in the labour force, the working-age group, and, therefore, the total population. In terms of employment, they are not positively associated with output.
In sum, then, after controlling for simultaneity and non-linearity issues in the OLS regressions, the labour-employment elasticity for degree-holders is the only coefficient for labour in the Cobb–Douglas equation that yielded any sign of significance, irrespective of the labour definition used. This unbiased, consistent employment output elasticity can also be inverted to a labour output elasticity of 9.615, which suggests that a one percentage change in output could potentially yield a 9.615% change in employment growth for degree-holders, holding all else equal. These results indicate that degree-holders who are employed in the labour market are the most closely associated with the movements of economic growth, and thus classical theory of an efficient labour market suggests they are the most ‘productive’ factor of labour input employed in the economy. Regression results using other labour definitions (labour force, working-age group, and the total population) showed that individuals with secondary schooling underwent a period of massification alongside economic growth during the period. These individuals are not associated significantly with output growth.
From this analysis, it becomes evident that economic growth returns are only being extracted from the university component of the education system. The FET certificate or diploma provides insignificant returns to growth. The higher level of unemployment found with a FET qualification provides descriptive evidence of the less than optimal contribution to the economy. The FET college system should in theory be a critical part of skills development in South Africa, but the institutional capacity is suggested to be inadequate to address the skills demand as a result of the quality and variation of programmes offered (Mayer et al. Citation2011:26). The schooling system has also been shown not to be a productive element of South Africa’s growth path, which is not surprising given the low quality of the education system. The quality of both the schooling and the FET college system is hampering labour market absorption of those qualified with less than a university degree, as well as their contribution to economic growth.
5. Conclusion
The objective of this study was to investigate the dynamics of the relationship between growth, productivity, and education. Education is a strong predictor of labour market outcomes in terms of employment and is, in turn, a determinant of economic growth. A striking result of this research is the lack of contribution, on average, to economic growth from those workers with schooling as well as some form of post-schooling (but non-degree) certification. The only cohort that contributed significantly to economic growth as measured by the Olley and Pakes methodology was degree-holders – suggesting that this would be the most productive education cohort.
This becomes evident if we consider South Africa’s labour demand trajectory that has systematically excluded lower levels of education, facilitating high rates of unemployment of school leavers. We find that employment grew for degree-holders in terms of high-skilled occupations, whereas the certificate cohort saw employment growth in the high-skilled and medium-skilled cohort. Certificate-holders, however, also saw fairly high levels of unemployment, suggesting that there is an oversupply of this cohort in the market, and the varying occupational absorption at different skill levels is indicative of the wavering quality of the FET system. The poor contribution to economic growth from FET (and related) graduates suggests, at one level, that the fiscal investment in FET colleges has not generated the desirable outcome. In this respect, it is critical that a more optimal return to this investment is realised for certificate-holders to truly gain from, and indeed in turn drive, South Africa’s growth process.
Disclosure statement
No potential conflict of interest was reported by the authors.
Notes
1FET colleges offer a National Certificate Vocational (NCV), a National Diploma, and a number of other specialised education and training programmes. The NCV programme can take up to three years and is offered in a number of fields, including the built environment, tourism, education and development, mechanics, safety in society, and hospitality. The NCV was designed to replace the National Technical Certificate and has a Grade 12 or Grade 11 entry requirement, but may accept Grade 9 or Grade 10 in exceptional cases. The National Diploma can be taken in certain Grade 12 subjects, small business management and financial management, which would often be taken by someone who has not obtained a matric qualification. For ease of reference, we term both certificate and diploma under ‘certificate’ in the analysis.
2One possible explanation for the rapid increase in the demand for tertiary educated workers is the highly unionised labour market which provides firms with the incentive to invest in stable, skill-intensive capital. However, proving this would require further evidence beyond the scope of this research.
3The sum of two parameters (α and δ) is the returns to scale of the inputs in the production process and could be seen as the productivity associated with the factor inputs. If the sum of the two parameters is greater than one, it would imply increasing returns to scale; if the sum equals one, it would indicate constant returns to scale; and if the sum is less than one, it would point to decreasing returns to scale.
4The results estimated by Arora (Citation2005) also find increasing returns to scale using inputs of labour (0.8) and capital (0.7) during the 1980–2003 period.
References
- Aghion, P & Howitt, P, 1998. Endogenous growth theory, MIT Press, Cambridge, MA.
- Arora, A, 2005. The emerging offshore software industries and the U.S. economy. Brookings Trade Forum, 399–409. doi:10.1353/btf.2006.0003.
- Barro, RJ, 1991. Economic growth in a cross section of countries. Quarterly Journal of Economics 106(2), 407–43. doi: 10.2307/2937943
- Barro, RJ, 1997. Determinants of economic growth: A cross-country empirical study. MIT Press, Cambridge, MA.
- Benhabib, J & Spiegel, MM, 1994. The role of human capital in economic development: Evidence from aggregate cross-country data. Journal of Monetary Economics 34(2), 143–73. doi: 10.1016/0304-3932(94)90047-7
- Brynjolffson, E & McAfee, A, 2014. The second machine age: Work, progress and prosperity in a time of brilliant technologies. WW Norton, New York, NY.
- Krueger, AB & Lindahl, M, 2001. Education for growth: Why and for whom? Journal of Economic Literature 39(4), 1101–36. doi: 10.1257/jel.39.4.1101
- Lucas, R, 1988. On the mechanics of economic development. Journal of Monetary Economics 22, 3–42. doi: 10.1016/0304-3932(88)90168-7
- Mankiw, NG, Romer, D & Weil, D, 1992. Contribution to the empirics of economic growth. The Quarterly Journal of Economics 107(2), 407–37. doi: 10.2307/2118477
- Mayer, M, Gordhan, S, Manxeba, R, Hughes, C, Foley, P, Maroc, C, Lolwana, P & Nell, M, 2011. Towards a youth employment strategy for South Africa, Development Planning Division Working Paper Series No. 28. Development Bank of Southern Africa, Gauteng, South Africa.
- Nelson, R & Phelps, E, 1966. Investment in humans, technological diffusion, and economic growth. American Economic Review 56, 69–75.
- Olley, S & Pakes, A, 1996. The dynamics of productivity in the telecommunications industry. Econometrica 64(6), 1263–98. doi: 10.2307/2171831
- Romer, PM, 1990. Human capital and growth: Theory and evidence. Carnegie-Rochester Conference Series on Public Policy, Elsevier 32(1), 251–86. doi: 10.1016/0167-2231(90)90028-J
- Sala-I-Martin, X, Doppelhofer, G & Miller, RI, 2004. Determinants of long-term growth: A Bayesian averaging of classical estimates (BACE) approach. American Economic Review 94(4), 813–35. doi: 10.1257/0002828042002570
- Sianesi, B & Van Reenen, J, 2003. The returns to education: Macroeconomics. Journal of Economic Surveys 17(2), 157–200. doi: 10.1111/1467-6419.00192
- Temple, T, 2001. Growth effects of education and social capital in the OECD countries. OECD Economic Studies 2001(2), 57–101. doi: 10.1787/eco_studies-v2001-art11-en
- Van der Berg, S, Burger, C, Burger, R, De Vos, M, Du Rand, G, Gustafsson, M, Shepherd, D, Spaull, N, Taylor, S, Van Broekhuizen, H & Von Fintel, D, 2011. Low quality education as a poverty trap. University of Stellenbosch, Department of Economics, Stellenbosch.