
ABSTRACT
The purpose of this research is to examine the influence of travel and tourism competitiveness (measured by the Travel & Tourism Competitiveness Index [TTCI]) on the national economic competitiveness of sub-Saharan Africa (SSA) countries (measured by the Global Competitiveness Index [GCI]). The aim is to identify critical factors for improving competitiveness of SAA countries from the area of tourism competitiveness. The study was conducted using the following methods: regression, cluster and grey relational analysis (GRA). Results reveal that travel and tourism competitiveness has a high impact on national competitiveness in the analysed group of countries. The study identified three homogeneous groups within SSA countries according to the TTCI pillars. The different impact of the TTCI on the GCI is determined in each of these three homogeneous groups of countries. The outcomes of this study could provide recommendations for tourism development policy-makers in SSA countries based on the results of GRA.
1. Introduction
Data from the World Travel & Tourism Council (Citation2012) indicate constant growth of travel and industry development in the world. Travel and tourism (T&T) has become one of the largest and fastest growing industries (Page & Connell, Citation2009) and a powerful means of economic development (Rhodri & Long, Citation1999). The sub-Saharan Africa (SSA) region has little share in the global tourism market. In 2011, the SSA region received 3.3% of world tourist arrivals. Tourism can have an important role in the economic development of the majority of SSA countries. Therefore, it has been emphasised that tourism directly contributed 2.7% to the gross domestic product (GDP) of SSA countries in 2013 (World Travel & Tourism Council, Citation2014). ‘More than 200 million people are underemployed in SSA and 10 million more seek jobs every year. There are an estimated 5.3 million direct tourism jobs across SSA’ (Christie et al., Citation2013:22). There is a correlation between the T&T influence on many industries within a national economy and, especially, tourist arrivals and trade (Fry et al., Citation2010). Besides, ‘tourism’s total direct and indirect employment impact is 12.8 million jobs in SSA’ (Christie et al., Citation2013:1). In SSA countries, visitor exports generated US$29.5 billion (6.4% of total exports) in 2013. T&T investment in 2013 was 5.7% of total investment (World Travel & Tourism Council, Citation2014). SSA countries attracted 34.7 million visitors in 2013 (3.19% of total world tourist arrivals) and 35.9 million visitors in 2014 (3.17% of total world tourist arrivals) (UNWTO, Citation2015:4).
Tourism is also an important export opportunity for SSA countries (US International Trade Commission, Citation2009) to increase foreign exchange revenues. SSA has considerable tourism potential, bearing in mind some resources for development of the so-called nature-based tourism, eco-tourism, archaeological-heritage tourism and cultural tourism. However, the SSA region has a lot of barriers to tourism development such as poverty, bad business climate, insufficient marketing and dissemination of information about the tourist destination (Saayman & Du Plessis, Citation2003), lack of elementary human needs, healthcare, education, free movement of labour, poor traffic and other infrastructure, sparse domestic investment, political climate, civil wars and political support for tourism. The list of constraints and limiting factors is long and not exhaustive.
Not all SSA countries have been equally successful in T&T, which finally reflects on their different competitive position. The main reasons for variation in tourism competitiveness between SSA countries are different (richness of natural resources, different development of transport and tourism infrastructure, affinity for T&T, quality of human resources). Thirty-one countries, observed in the focus of this study, are differentiated by the critical tourism development factors. SSA has considerable unused potential for further tourism growth and competitiveness enhancement. These facts will demand great efforts from SSA policy-makers in the future regarding the realisation of the innovative politics with the aim of T&T competitive position improvement. Some SSA countries implemented the ‘policy of low volume/high value’ (Harvey, Citation1992). The economic development of SSA countries and the progress towards a higher competitiveness of the national economy in the future should be based on various determinants and resources that lead to tourism sector development and its competitiveness.
The competitiveness of the national economy has an impact on the competitiveness of all its sectors, including the T&T sector. However, the purpose of this research is to investigate a particularly important impact of T&T competitiveness on the national economy competitiveness level in SSA countries.
The World Economic Forum (WEF) defines competitiveness as ‘the set of institutions, policies, and factors that determines the level of the productivity of a country’ (WEF, Citation2013a:4). The OECD has provided a generally accepted definition of tourism competitiveness:
Tourism competitiveness for a destination is about the ability of place to optimise its attractiveness for residents and non-residents, to deliver quality, innovative, and attractive (e.g. providing good value for money) tourism services to consumers and to gain market shares on the domestic and global marketplaces, while ensuring that the available resources supporting tourism are used efficiently and in a sustainable way. (Dupeyras & MacCallum, Citation2013:7)
Firstly, it is important to identify the current influence of tourism development in SSA countries on their achieved national economy competitiveness level. The task of this analysis is going to be the examination of the impact of 14 pillars of the Travel & Tourism Competitiveness Index (TTCI) on the Global Competitiveness Index (GCI) in SSA countries. The aim of the research is the identification of the critical factors for improving the competitiveness of SAA countries in the tourism sector. The outcomes of this study provide considerations and recommendations for development policy-makers in the SSA region and point out the necessity of improving the performance of certain T&T pillars or factors to provide a greater contribution to the country’s competitiveness level. These recommendations are based on the results of grey relational analysis (GRA).
2. Theoretical considerations
The growth of the tourism sector is relevant for the ‘health’ of national economies. There are many factors, resources, impacting the competing advantage of nations (Porter, Citation1990). Tourism sector development stimulates economic growth and job creation (Beech & Chadwick, Citation2006; Cooper et al., Citation2008). The development of a country’s T&T sector is important for the advancement of their competitive position in the world rankings. The concept of competitiveness has been the object of numerous studies and analyses (Kozak & Rimmington, Citation1999; Pearce, Citation1997; D’Hauteserre, Citation2000; Dwyer et al., Citation2000). Competitiveness is one of the key issues for tourism and an important area for policy-makers in creating strategies for T&T development in both the developed and less developed tourist countries. Taking into consideration different models of destination competitiveness, as well as drivers and determinants of destination competitiveness (Ivanov & Webster, Citation2013), it is necessary to define a portfolio of objective and subjective indicators that can be useful for quantifying the level of competitiveness of any destination (Dwyer & Chulwon, Citation2003). The improvement of the competitive position of the tourism sector should be in accordance with the principles of sustainable development. Ritchie and Crouch point out that the ‘nature of competitiveness and sustainability is in constant evolution’ (Ritchie & Crouch, Citation2003:8). Mihalic (Citation2000) and Hassan (Citation2000) stress as relevant the environmentally sustainable principle in the tourism sector. Heath (Citation2002, Citation2003) considered a model to enhance sustainable tourism competitiveness.
In order for the tourism sector to play an important role in the national economy, it is necessary to develop a set of different competitive advantages. Namely, ‘comparative advantages (e.g. low labour costs and attractive exchange rates) had long been believed to be the only contributing factor to a successful tourist market’ (Tsai et al., Citation2009:525). Also, ‘comparative factors are close to primary tourism supply (natural, cultural, and social attractiveness)’ (Kulcsar, Citation2009:123).
Several SSA countries are rich in natural and other resources and there are numerous tourism products that can result from them. Some available resources of the SSA countries can create the comparative advantages for tourism development in the future. The most relevant group of tourism products in SSA countries are: safari, which is defined as ‘big-five watching’ (it can be done from a vehicle, on elephant’s back or on foot), sightseeing, hiking, bird watching; beach tourism, lake tourism and watersports; cultural products in terms of archaeology, village tourism, cultural heritage, historic architecture and traditional markets; or business products in terms of conferences, meetings and trade.
Competitiveness is not always transformed into economic benefits (Webster & Ivanov, Citation2014). To convert comparative advantages into a visible economic benefit, it is necessary that the SSA countries offer high-quality products. In this sense, the key necessary aspects of the tourism product quality improvement and the level of its competitiveness are the following: tourism assets, visitor accommodation, transport to, from and within the country, infrastructure components, the receptiveness of local populations to tourists, the skills of the range of officials and employees in the tourism sector, and the safety and security the destinations (The World Bank, Citation2013:5). The professional and efficient functioning of tour operators is essential for improving the competitive advantage in tourism. It is pointed out that ‘Africa has a competitive edge in wildlife tourism. To maintain these market segments and to take full advantage of this competitive edge, improvements to service standards and to ground operator professionalism are crucial’ (The World Bank, Citation2011:4).
Many researchers stress different determinants of tourism competitiveness. In the literature, Bălan, Balauru and Vegheş emphasise the relevance of ‘economic competitiveness, a social and cultural competitiveness, an environmental competitiveness, a political competitiveness and a technologically-based competitiveness’ (Bălan et al., Citation2009:980). In addition to these determinants, the previously mentioned researchers emphasise the importance of infrastructure, available resources, laws and regulations as important for achieving competitive advantage in T&T. Other authors point out the following competing factors (Thitthongkam & Walsh, Citation2011): epidemic diseases, economic situation, media, disaster, crime and war, technology, marketing plan, culture, education, environmental issues, demographic change and other factors. Tourism sector policy-makers and managers in tourism organisations have an important role in identifying the most relevant factors which influence the country’s tourism competitiveness. In addition, they ‘must identify and explore competitive advantages and analyse the destination's competitive position’ (Lin & Huang, Citation2009:270).
It is necessary to find a set of indicators to create an adequate framework for tourism competitiveness evaluation of a country. Thus, according to the OECD, in the evaluation of the country’s tourism competitiveness, the key relevant indicators for policy-makers are the following (Dupeyras & MacCallum, Citation2013:7–8): tourism direct GDP, inbound tourism revenues per visitor by source market, overnight stays in all types of accommodation, exports of tourism services, labour productivity in tourism services, purchasing power parity and tourism prices, visa requirements to enter the country, natural resources and biodiversity, cultural and creative resources, visitor satisfaction and a national tourism action plan. Conceptual frameworks for monitoring the tourism competitiveness are given by Ritchie & Crouch (Citation2003). They show three levels of competition (companies and products, national industries, and national economies) and the four elements of competitiveness (the structure, the level of the territory, the stakes, and the tools) (Crouch & Ritchie, Citation1999:141). Navickas & Malakauskaite (Citation2009) also deal with the analysis of the factors that impact competitiveness: price competitiveness (Managing et al., Citation2005), infrastructure development, ecology-related indicators, technological advancement, human resource, market openness and social development indicators. Measurement of competitiveness has attracted attention in the literature on tourism (Cracolici et al., Citation2008). Many researchers deal with the problem of T&T competitiveness of SSA countries (Chen & Devereux, Citation1999; Heath, Citation2002, Citation2003; Saayman & Du Plessis, Citation2003).
For African countries, more precisely for SSA countries, T&T is treated as a sector which can help to reduce the problem of poverty. ‘Through tourism it is hoped that the remarkable growth rate projected and the higher expenditure profile of tourists will help to generate economic growth, investment and employment and consequently, make an important contribution to poverty reduction’ (Okech, Citation2010). Both Nkurayija (Citation2011) and Mpofy (Citation2012) argue in their articles about the globalisation relevance for tourism development and the improvement of SSA countries’ competitiveness. The globalisation brings to SSA countries numerous advantages related to the number of tourists, employment and income, but ‘while striving to benefit from this growing industry, Sub-Saharan African countries need to closely monitor the negative economic, socio-cultural and environmental aspects of globalisation’ (Mpofy, Citation2012). In that sense, it is necessary to make the ‘balance between traditional economic and business management skills with an increasing need for sensitive environmental management capabilities’ (Cooper et al., Citation2008:480).
3. Information basis, methodology and hypothesis
The aforementioned information about SSA countries is intriguing and it is a motivation for a more detailed examination of the contribution of T&T competitiveness to the national economy competitiveness. This study is based on the data contained in the WEF (Citation2013a) publication titled The Global Competitiveness Report 2013–2014, as well in the WEF (Citation2013b) publication titled The Travel & Tourism Competitiveness Report 2013.
The WEF (Citation2013a) methodology for measuring the competitiveness of countries systematises the key factors into 12 groups. The three sub-indices of GCI are the following: basic factors, efficiency factors and innovation factors. The competitiveness sub-indices and pillars within GCI are presented in . The composite GCI is the result of measuring many indicators within each of these pillars.
Table 1. GCI and TTCI components – sub-indices and pillars.
The WEF methodology for measuring the T&T competitiveness systematises the key competitiveness factors into three groups of sub-indices or 14 groups of determinants, so-called pillars. The three sub-indices of the TTCI are the following: the T&T regulatory framework, T&T business environment and infrastructure, and T&T human, cultural, and natural resources (). More information about scores and ranks of these pillars for 2013–14 can be found in The T&T Competitiveness Report 2013 of the WEF. The TTCI is the unweighted average of the value of the aforementioned sub-indices.
The relationship between tourism sector and national economy competitiveness is bi-directional. However, in this article the authors tested the hypothesis that the achieved level of the T&T competitiveness in the SSA countries has a significant influence on the level of their national economy competitiveness.
The following methods are used in this research: regression analysis, cluster analysis (Veal, Citation2011) and the GRA. The aim of regression analysis was to estimate the influence of the TTCI and its pillars on the GCI and this method was applied twice. First, the simple linear regression analysis was applied in order to estimate the TTCI influence on the GCI. The second analysis was based on the multiple linear regression model, where all pillars within the TTCI were independent variables.
Cluster analysis is the method of multivariate analysis and serves for the classification of countries according to their characteristics (Jovanović et al., Citation2014). Given the number of countries included in the research (31 countries), the appropriate method is a hierarchical cluster analysis. This method, in contrast to the k-means cluster analysis, does not require a large sample. Hierarchical cluster analysis starts from individual objects (countries) that connect to larger groups (i.e. clusters). The application of cluster analysis resulted in homogeneous groups of countries according to the tourism competitiveness level.
GRA analysis is a segment of the Theory of Grey System (Cui et al., Citation2009:84). The essence of this analysis is a relationship between two series. ‘GRA is a quantitative analysis to explore the similarity and difference of development trends among elements used to measure the relation among elements’ (Huang & Lin, Citation2009:1132). GRA can be used for comparison of the level of competitiveness of the national economies. GRA is used in the article for ranking countries within a cluster according to pillars with the aim of identifying critical factors for improving competitiveness of SSA countries from the area of tourism competitiveness and formulating relevant recommendations. The research is realised in SPSS (Statistical Package for the Social Sciences) Statistics 19.
4. Results and discussion
4.1. Examining the impact of pillars within the TTCI on the GCI in the SSA countries
The results of simple regression analysis () indicate that B = 0.801 (p < 0.0001), meaning that there is positive statistically significant influence of the TTCI on the GCI (). According to this result, it can be concluded that the initial hypothesis of the research is confirmed.
Figure 1. Linear regression model.
Table 2. Results of regression analysis (2013).
The regression analysis is also used to examine the influence of the pillars within the TTCI on the GCI. The results of the analysis show how T&T competitiveness factors (pillars) impact the level of national competitiveness (measured by the GCI). Tourism infrastructure (B = 0.332) and Ground transport infrastructure (B = 0.295) pillars have the highest influence on the GCI among the analysed pillars in the SSA countries. Cultural resources (B = 0.189), Policy rules and regulations (B = 0.173), Safety and security (B = 0.161), Price competitiveness in the T&T industry (B = 0.158), Natural resources (B = 0.137) and Human resources (B = 0.127) have a modest influence on the GCI. Natural resources is the only pillar with a statistically significant influence (p = 0.018) on the GCI.
4.2. Examining the heterogeneity of the SSA countries and the impact of pillars within the TTCI on the GCI according to clusters
The aim of this part of research is to examine the heterogeneity of the SSA countries according to the pillars within the TTCI using cluster analysis. The final score of each pillar is calculated as a simple mean of the elements that constitute each pillar. The number of elements of each pillar is different. The final scores of pillars are used as variables in clustering in order to avoid attributing the greater importance to pillars which have a larger number of elements. The hierarchical cluster analysis of the SSA countries () determined the following structure of clusters:
Cluster 1: Seychelles, Mauritius, South Africa and Cape Verde;
Cluster 2: Namibia, Gambia, Botswana, Kenya, Rwanda, Senegal, Zambia, Tanzania, Uganda, Ghana, Zimbabwe, Ethiopia, Cameroon and Malawi.
Cluster 3: Swaziland, Mozambique, Cote D’Ivoire, Nigeria, Burkina Faso, Mali, Benin, Madagascar, Lesotho, Guinea, Sierra Leone, Burundi and Chad.
Figure 2. Dendogram using the Ward method (hierarchical cluster analysis).
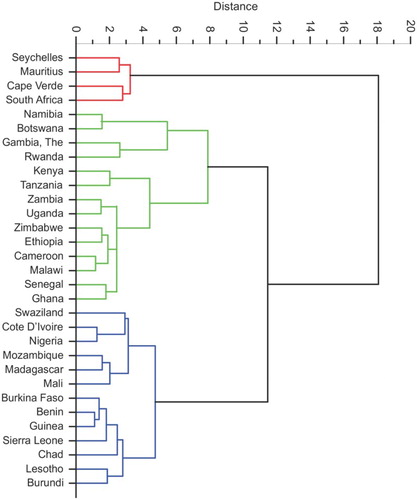
Cluster 1 has the best values for the pillars within the TTCI. Cluster 2 includes countries with lower values of the pillars scores within the TTCI compared with Cluster 1. Finally, Cluster 3 consists of the countries with the lowest values of the pillar scores within the TTCI ().
Table 3. Mean values of pillars within the clusters.
The values of the regression model parameters (i.e. the regression coefficients) are estimated by applying the least-squares method in a linear regression model. The values of these coefficients by clusters are presented in .
Table 4. Value of regression coefficients – influence of TTCI on GCI (2013).
According to the value of regression coefficients, in countries grouped in Cluster 1 there is the weakest impact of the TTCI on the GCI. Competitiveness in tourism has the strongest, and statistically significant, impact on the national competitiveness in the second cluster, and somewhat weaker impact in the third cluster.
4.3. Identifying critical pillars by applying GRA
The purpose of this segment of the research is to identify the critical (problematic) pillars according to identified clusters in order to formulate guidelines for policy-makers in the development of T&T sector. Identifying critical pillars is done using the GRA.
Calculation of the Grey relational coefficients (GRCs) represents the basis of GRA analysis. The calculation procedure (Huang & Lin, Citation2009) for these coefficients implies, firstly, normalisation of the analysed data, so that they are reduced to the same scale. In this case, there is no normalisation because the WEF data are already normalised (reduced to a scale from one to seven). According to the Grey relational methodology, parameter values in the selected sample are compared with reference series. Elements which are necessary for the calculation of the GRCs may be generally represented as follows:(1) where X0 is a referential series with k entities, while x1, … , xN are the data series which are compared with referential series.
In this case, the referential series consists of maximum values of pillars within the TTCI, thus k = 14. Each country in the sample represents a separate series. In accordance with the defined clusters, the number of countries included in the analysis is as follows: Cluster 1, N1 = 4; Cluster 2, N2 = 13; and Cluster 3, N3 = 14.
The absolute difference (Δ0i) of the compared series and the referential series should be obtained using the following formula:(2) and the maximum and the minimum difference should be determined.
The GRC (γ0i) between the series being compared with the referential series for the jth value (i.e. in this case the pillar) are obtained by the following formula:(3) where
.
The initial step in this analysis is determining the target values for pillars within the TTCI. The reference value is the maximum value of a given pillar on a global level. presents the countries to which these values refer.
Table 5. Target values for pillars within the TTCI.
The next step in the GRA is determining the weights. These weight determinations should be assigned to each pillar. In the procedure of weight calculation, the first decision that must be made is a choice between equal and differential weighting. This decision will greatly affect the final result. Equal weighting is a referential procedure adopted in most applications. Statistical methods have a very important role in the process of obtaining differential weighting. One of the possible methods is regression analysis. The weights are based on the regression coefficients (), by which the impact of the pillar within the TTCI on the GCI is estimated (calculated weights presented in ).
The next step in the implementation of the GRA is to calculate the deviation of pillar values from the target values.
Based on the determined deviations, using Equation (2), the values of the GRC for each country within a defined cluster were calculated. The next step in the analysis is to determine the weighted GRC on the basis of the GRC and the calculated weights (). Weighted GRCs are the basis for the ranking of countries within the cluster according to pillars, as shown in to .
Table 6. Ranking of countries according to value of GRC – Cluster 1.
Table 7. Ranking of countries according to value of GRC – Cluster 2.
Table 8. Ranking of countries according to value of GRC – Cluster 3.
After completion of the GRA analysis and ranking of countries within the clusters according to pillars, it can be observed that, in Cluster 1, Cape Verde is a country that has the largest number of critical pillars. For tourism development policy-makers it is important to direct activities toward improving pillars – Health and hygiene, Ground transport infrastructure, Tourism infrastructure, Information Communication Technology (ICT) infrastructure and Natural resources – and thereby increase the contribution that the countries in this cluster have to national economy competitiveness (measured by the GCI). For tourism development policy-makers in South Africa it is important to direct activities toward improving pillars: Safety and security, Prioritisation of T&T, Human resources and Affinity for T&T. In Mauritius it is important to improve the pillars Environmental sustainability, Air transport infrastructure and Cultural resources. Finally, for future tourism development in Seychelles it is important to improve Policy rules and regulations and Price competitiveness in the T&T industry (see ).
In Cluster 2, which is defined as a homogeneous group of countries by cluster analysis, after ranking the countries according to the weighted GRC two sub-groups of countries with higher levels of homogeneity were noticed. Thus, Madagascar, Lesotho, Guinea, Sierra Leone, Burundi and Chad are countries within the cluster that are located at the bottom of the rank list. To increase the contribution of Cluster 2 to overall competitiveness, special attention should be paid to Chad, which lags behind, according to the largest number of pillars (Policy rules and regulations, Safety and security, Health and hygiene, Price competitiveness in the T&T industry, Affinity for T&T, Cultural resources), and then to the improvement of the pillars Prioritisation of T&T, ICT infrastructure and Cultural resources in Burundi, and Air transport infrastructure, Human resources and Natural resources in Lesotho. For tourism development policy-makers in Madagascar it is important to direct activities toward improving Environmental sustainability. In Guinea it is important to improve Ground transport infrastructure. Finally, for future tourism development in Siera Leone it is important to improve Tourism infrastructure (see ).
In Cluster 3, Ethiopia, Cameroon, Malawi, Zimbabwe and Rwanda are separated as countries which have the highest number of critical pillars in the field of tourism. To increase the contribution of Cluster 3 to overall competitiveness in the tourism area, it is necessary to improve the pillars Policy rules and regulations, Ground transport infrastructure, Tourism infrastructure and Affinity for T&T in Ethiopia, as well as Environmental sustainability and Prioritisation of T&T in Cameroon. For tourism development policy-makers in Rwanda it is important to direct activities toward improving pillars ICT infrastructure and Cultural resources. In Zimbabwe it is important to improve Policy rules and regulations and Human resources. Finally, for future tourism development in Malawi it is important to improve Air transport infrastructure and Affinity for T&T (see ).
5. Conclusion
This study focuses on 31 countries of the SSA region. The majority of countries in the region show the underdevelopment of tourism and a low position in the world rankings according to the TTCI, and low pillar values within the TTCI. The general view is that the average value of pillars within the TTCI, based on the WEF report, is significantly lower in relation to the maximum possible score which amounts to seven. However, despite having a small share in the global tourism market, this region has significant potential for future development and tourist attraction. Tourism is also an important export chance for the SSA countries. Not all SSA countries have been equally successful in T&T, because of economic, social, political and environmental determinants of the T&T development, which finally reflects on their different competitive position.
The result of this research confirms the hypothesis that there is a high impact of T&T competitiveness on the national competitiveness in the analysed group of countries. Namely, research results have confirmed that the improvement of tourism competitiveness could significantly contribute to increasing the competitiveness level of SSA countries.
For the purpose of the research, SSA countries were classified into three homogeneous groups by cluster analysis because of their heterogeneity according to achieved level of T&T development. The estimated values of regression coefficients lead to the conclusion that in countries grouped in Cluster 1 (Seychelles, Mauritius, South Africa and Cape Verde) there is the weakest impact of the TTCI on the GCI. At the same time, this cluster has the best performances related to T&T development. Competitiveness in tourism has the strongest impact on national competitiveness in the second cluster (Namibia, Gambia, Botswana, Kenya, Rwanda, Senegal, Zambia, Tanzania, Uganda, Ghana, Zimbabwe, Ethiopia, Cameroon and Malawi), while a somewhat weaker impact is noticed in the third cluster (Swaziland, Mozambique, Cote D’Ivoire, Nigeria, Burkina Faso, Mali, Benin, Madagascar, Lesotho, Guinea, Sierra Leone, Burundi and Chad).
This research can serve as a basis for a more detailed analysis of individual components (elements) within the TTCI pillars. SSA countries have many possibilities for improving their performances that influence the TTCI competitiveness level on the world rank list. These possibilities for improvement of the T&T development are identified using the results of GRA.
Following the GRA analysis and ranking of countries within the clusters according to the TTCI pillars, this research has identified critical factors (pillars) for each of SSA countries. These factors should be in the focus of the tourism development policy-makers with the aim of improving the level of tourism sector competitiveness, and consequently increasing the contribution of the tourism sector competitiveness to the national economy competitiveness in the future.
Disclosure statement
No potential conflict of interest was reported by the authors.
References
- Bălan, D, Balaure, V & Vegheş, C, 2009. Travel and tourism competitiveness of the world’s top tourism destinations: An exploratory assessment. Annales Universitatis Apulensis Series Oeconomica 11(2), 979–87.
- Beech, J & Chadwick, S, 2006. The business of tourism management. FT Prentice Hall – Financial Time, London.
- Chen, L & Devereux, J, 1999. Tourism and welfare in Sub-Saharan Africa: A theoretical analysis. Journal of African Economics 8(2), 209–27. doi: 10.1093/jae/8.2.209
- Christie, I, Fernandes, E, Messerli, H & Twining-Ward, L, 2013. Tourism in Africa: Harnessing tourism for growth and improved livelihoods. International Bank for Reconstruction and Development. The World Bank, Washington.
- Cooper, C, Fletcher, J, Fyall, A, Gilbert, D & Wanhill, S, 2008. Tourism: Principles and practice. Pearson Education Limited, London.
- Cracolici, MF, Nijkamp, P & Rietveld, P, 2008. Assessment of tourism competitiveness by analysing destination efficiency. Tourism Economics 14(2), 325–42. doi: 10.5367/000000008784460427
- Crouch, GI & Ritchie, JRB, 1999. Tourism, competitiveness and societal prosperity. Journal of Business Research 44, 137–52. doi: 10.1016/S0148-2963(97)00196-3
- Cui, J, Dang, Y & Liu, S, 2009. Study on novel property of some grey relational analysis models. Journal of Grey System 12(2), 83–88.
- D’Hauteserre, A, 2000. Lessons in managed destination competitiveness: The case of Foxwoods Casino report. Tourism Management 21(1), 23–32. doi: 10.1016/S0261-5177(99)00097-7
- Dupeyras, A & MacCallum, N, 2013. Indicators for measuring competitiveness in tourism: A guidance document. OECD Tourism Papers, 2. OECD Publishing.
- Dwyer, L & Chulwon, K, 2003. Destination competitiveness determinants and indicators. Current Issues in Tourism 6(5), 369–414. doi: 10.1080/13683500308667962
- Dwyer, L, Forsyth, P & Rao, P, 2000. The price competitiveness of travel and tourism: A comparison of 19 destinations. Tourism Management 21, 9–22. doi: 10.1016/S0261-5177(99)00081-3
- Fry, D, Saayman, A & Saayman, M, 2010. The relationship between tourism and trade in South Africa. South African Journal of Economics 78(3), 287–306. doi: 10.1111/j.1813-6982.2010.01245.x
- Harvey, C, 1992. Botswana: Is the economic Miracle over? Journal of African Economics 1(3), 335–68.
- Hassan, SS, 2000. Determinants of market competitiveness in an environmentally sustainable tourism industry. Journal of Travel Research 38(3), 239–49. doi: 10.1177/004728750003800305
- Heath, E, 2002. Toward a model to enhance Africa’s sustainable tourism competitiveness. Journal of Public Administration: New partnership for Africa’s Development, Special Issue 1(37), 327–53.
- Heath, E, 2003. Towards a model to enhance destination competitiveness: A Southern African perspective. http://www.repository.up.ac.za/dspace/bitstream/handle/2263/6058/Heath_Towards(2003).pdf?sequence=1 Accessed 20 November 2014.
- Huang, Y & Lin, C, 2009. Constructing grey relation analysis model evaluation of tourism competitiveness. Journal of Information and Optimization Sciences 30(6), 1129–38. doi: 10.1080/02522667.2009.10699931
- Ivanov, S & Webster, C, 2013. Globalisation as a driver of destination competitiveness. Annals of Tourism Research, 43, 628–33. doi: 10.1016/j.annals.2013.07.010
- Jovanović, S, Janković Milić, V & Krstić, B, 2014. Homogeneity analysis of South-eastern European countries according to tourism competitiveness performances. Economic Research 27(1), 207–20.
- Kozak, M & Rimmington, M, 1999. Measuring tourist destination competitiveness: Conceptual consideration and empirical findings. International Journal of Hospitality Management 18(3), 273–83. doi: 10.1016/S0278-4319(99)00034-1
- Kulcsar, N, 2009. Rural tourism in Hungary: The key of competitiveness. Proceedings of FIKUSZ ‘09 Symposium for Young Researchers. Budapest Tech Keleti Károly Faculty of Economics, 121–7. https://www.researchgate.net/publication/228645500_Rural_tourism_in_Hungary_the_key_of_competitiveness Accessed 17 November 2014.
- Lin, CT & Huang, YL, 2009. Tourism competitiveness evaluation in Asian countries applying grey relational analysis and sensitivity analysis. Journal of Grey System 21(39), 269–78.
- Managing, M, Durbarry, R & Sinclair, MT, 2005. Tourism competitiveness: Price and quality. Tourism Economics 11(1), 45–68. doi: 10.5367/0000000053297202
- Mihalic, T, 2000. Environmental management of a tourist destination: A factor of tourism competitiveness. Tourism Management 21, 65–78. doi: 10.1016/S0261-5177(99)00096-5
- Mpofy, TPZ, 2012. Implications of globalization on sustainable tourism growth and development in Sub-Saharan Africa. ZOU International Research Conference 2012. Harare. 30–31 August. http://www.lis.zou.ac.zw:8080/dspace/ Accessed 7 December 2014.
- Navickas, V & Malakauskaite, A, 2009. The possibilities for the identification and evaluation of tourism sector competitiveness factors. Engineering Economics 1(61), 37–44.
- Nkurayija, J de la C, 2011. The impact of globalization on Africa’s development: Rwandan tourism as key to mobilize revenue and investment. http://www.culturaldiplomacy.org/academy/content/pdf/participant-papers/2011/april/biec-roa-nua/the_impact_of_globalization_on_africas_development-_rwandan_tourism_as_key_to_mobilize_revenue_and_investments-_dr._nkurayija.pdf Accessed 21 January 2014.
- Okech, RN, 2010. Tourism development in Africa: Focus on poverty alleviation. The Journal of Tourism and Peace Research 1(1). http://www.icptr.com/wp-content/uploads/2010/05/Okech-Tourism-development-in-Africa-25-05-10.pdf Accessed 17 January 2014.
- Page, S & Connell, J, 2009. Tourism – A modern synthesis. South-Western Cengage Learning, Andover, United Kingdom.
- Pearce, DG, 1997. Competitive destination analysis in Southeast Asia. Journal of Travel Research 35(4), 16–24.
- Porter, ME, 1990. The competitive advantage of nations. The Free Press, New York.
- Rhodri, T & Long, J, 1999. Improving competitiveness: Critical success factors for tourism development. Local Economy 14(4), 313–28.
- Ritchie, JRB & Crouch, GI, 2003. The competitive destination: A sustainable tourism perspective. CABI Publishing, Wallingford, United Kingdom.
- Saayman, M & Du Plessis, E, 2003. Competitiveness of South Africa as a tourist destination. South African Journal for Research in Sport, Physical Education and Recreation 25(2), 57–66.
- The World Bank, 2011. Tour operators: A critical connector between source markets and Africa. The State of Turism in Africa 2(1). http://www.traveltalkmedia.com/ATA_stateoftourism_AFRICA_11.pdf Accessed 17 December 2014.
- The World Bank, 2013. Tourism in Africa: Harnessing tourism for growth and improved livelihoods. http://www.worldbank.org/content/dam/Worldbank/document/Africa/Report/africa-tourism-report-2013-overview.pdf Accessed 20 December 2014.
- Thitthongkam, T & Walsh, J, 2011. An analysis of factors influencing the competitiveness of the Thai tourism industry. 2010 International Conference on Business and Economics Research, IACSIT Press. Kuala Lumpur, Malaysia, 1, 138–41.
- Tsai, H, Song, H & Wong, KKF, 2009. Tourism and hotel competitiveness research. Journal of Travel & Tourism Marketing 26(5–6), 522–46. doi: 10.1080/10548400903163079
- US International Trade Commission, 2009. Sub Saharan Africa: Effects of infrastructure condition on exports competitiveness. Third annual report, Publication 4071, April. www.usitc.gov/publications/332/pub4071.pdf Accessed 14 January 2014.
- UNWTO (World Tourism Organization), 2015. UNWTO tourism highlight. http://www.e-unwto.org/doi/pdf/10.18111/9789284416899 Accessed 6 August 2015.
- Veal, AJ, 2011. Research methods for leisure & tourism. FT Prentice Hall, London.
- Webster, C & Ivanov, S, 2014. Transforming competitiveness into economic benefits: Does tourism stimulate economic growth in more competitive destinations? Tourism Management 40, 137–40. doi: 10.1016/j.tourman.2013.06.003
- WEF (The World Economic Forum), 2013a. The global competitiveness reports 2013–2014. http://www.weforum.org/reports/global-competitiveness-report-2013-2014 Accessed 18 January 2014.
- WEF (The World Economic Forum), 2013b. The travel & tourism competitiveness report 2013. http://www.weforum.org/issues/travel-and-tourism-competitiveness Accessed 20 January 2014.
- World Travel & Tourism Council, 2012. Travel & tourism economic impact 2012 world. http://www.wttc.org/site_media/uploads/downloads/world2012.pdf Accessed 17 January 2014.
- World Travel and Tourism Council, 2014. Travel and tourism economic impact 2014, Sub–Saharan Africa. http://www.wttc.org/-/media/files/reports/economic%20impact%20research/regional%202015/subsaharanafrica2015.pdf Accessed 6 August 2015.