
ABSTRACT
This article examines the link between financial sector development and savings mobilisation in South Africa for the period 1980–2012. Taking the life-cycle hypothesis as our theoretical background and using Johansen co-integration that allows for hypothesis testing, the empirical results revealed a long-run relationship between savings, interest rates and financial sector development. We find an inverse relationship between the interest rate and savings, implying that South Africans are net borrowers because the income effect overwhelms the substitution effect. This in part explains the low level of savings in recent time. Important policy lessons for boosting the national savings rate are discussed.
1. Introduction and background to the study
Examining the determinants of savings has been an area of active academic and policy research. This is evidenced by the number of studies carried out in this area (Chowdhury, Citation2001; Odhaimbo, Citation2007; Khan & Hye, Citation2010; Sahoo & Dash, Citation2013). These studies highlight the pivotal role played by savings in enhancing sustainable economic growth through their effect on investment. Further, domestic savings tend to provide the economy the wherewithal for financing domestic fixed capital formation, which, in turn, affects economic growth.
To illustrate the importance of savings, Blanchard & Milesi-Ferretti (Citation2011) suggest that when a country has a high level of savings this helps in reducing the current account deficit. In the event that there are not enough savings, a country is likely to experience current account deficit or may fail to maximise on investments in the domestic economy.
The need to enhance domestic savings arises because external finance is argued to have been ineffective in reducing credit constraints common in many developing countries (Addison, Citation2007; Ang, Citation2010). However, it is argued that lack of appropriate financial systems which are able to efficiently pool savings of households to make them available to borrowers has been the contributing factor (Kelly & Mavrotas, Citation2008). Nevertheless, the available studies in this area have been inconclusive. While some studies have established a positive relationship between savings and financial sector development (Liu & Woo, Citation1994; Granville & Mallick, Citation2004; Odhiambo, Citation2008; Ang, Citation2010), others have found a negative relationship between the two variables (Chowdhury, Citation2001; Khan & Hye, Citation2010).
The studies which support financial sector development argue that the financial sector enhances the efficiency with which mobilised resources are channelled into productive use. Khan & Hye (Citation2010) argue that a developed financial system is characterised by improved saving opportunities, which also includes higher deposit rates, and a number of savings options which offer better returns. These resources will be channelled to productive sectors and hence promote economic growth. On the other hand, a number of studies argue that financial sector development eases credit constraints and may weaken the incentives for individuals to save (Bayoumi, Citation1993; Jappelli & Pagan, Citation1994; Ang, Citation2010).
South Africa’s financial system is relatively well developed. The country’s banks in terms of soundness were rated second out of 144 countries in the 2012/13 period (World Economic Forum, Citation2013). In addition, the stock market was ranked number 16 worldwide as of 2014 (World Economic Forum, Citation2013), with a well-developed and a liquid bond market. The stock market is also ranked within the top 20 worldwide in terms of derivative contracts traded (Richards, Citation2013). If the first strand of the literature is correct, then one should anticipate a good savings culture and well-drilled financial system supporting savings mobilisation.
However, despite the developments in the financial sector, South Africa’s aggregate savings have been on the decline. Corporate savings as a percentage of gross domestic product (GDP) stood at 3% between 2000 and 2008, from 5.6% in the 1990s and 6.6% in the 1980s. Moreover, the savings rate in South Africa is low in relation to that of some emerging countries. Aggregate savings as a percentage of GDP as of 2011 stood at 16.6% in South Africa, and although this compares favourably with Brazil (17.23%) it is low compared with other BRICS countries such as India (34.98%), China (52.78%) and Russia (33.76%). This applies to other developing countries in Africa such as Nigeria (24.41%) and Botswana (26.15%).
The low levels of savings being experienced in the country suggest that the country has to rely on external finance to meet its investment needs. However, other types of external finance – for example, portfolio investment – have proved to be uncertain. This becomes important given the high levels of unemployment and investment needs being experienced in the country.
South Africa presents a good case to carry out this study for a number of reasons. Firstly, South Africa experienced robust economic growth from 1994 to 2007, for some periods averaging above 5% (Hanival & Maia, Citation2008), although the surge in growth was not accompanied with a growth in national savings. The country has undergone a series of financial sector reforms and achieved rapid deepening of its financial system. This was supposed to have led to an increase in savings; however, the evidence is to the contrary. Also it is interesting to note that the majority of studies carried out in South Africa on the determinants of savings have largely utilised other conventional variables, not necessarily the role played by the financial sector. This becomes important given that the financial sector can either promote or weaken the mobilisation of savings. Given this background, this study examines the determinants of savings in South Africa, specifically the roles of financial deepening and its impact on savings in South Africa.
The study is structured as follows: Section 2 presents an overview of financial development in South Africa. Section 3 reviews the literature whilst Sections 4 and 5 provide the methodology and interpretation of the results.
2. Overview of savings performance in South Africa
South Africa has been experiencing a decline in its national savings rate over the past decades (Harjes & Ricci, Citation2006). As indicated in , the components of domestic savings and the national saving ratio for the period 1990–99 amounted to 16.5%. However, this rate slowed to 15.2% between 2000 and 2012.
Figure 1. Trends in savings as a percentage of gross domestic product. Source: South African Reserve Bank (Citation2014).
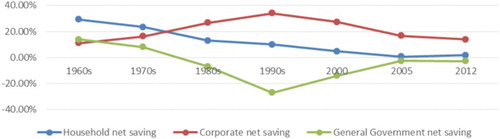
Luüs (Citation2007) shows that household saving in South Africa has declined drastically in relative importance. The same applies to government saving, which has become a negative item. Corporate saving is the component which is positive and has thus assumed a much more important role in South Africa.
Using data from the South African Reserve Bank, Luüs (Citation2007) shows that during the 1960s net household saving in South Africa averaged 6.9% of the GDP. However, this declined to 5.9% in the 1970s, 3.2% in the 1980s and 1.7% in the 1990s. From a ratio of 0.8% in 2000, net household saving diminished to a negligible 0.1% in 2005. The decline in savings was attributed to changes in lifestyles since the beginning of the 1980s. Luüs (Citation2007) argues that this was due to inflation of house prices and equity prices at the time, which exposed individuals to more debt. Financial deregulation in the banking sector also created new financial products, increasing consumer credit. At its high in 1972, net household saving constituted 12.4% of household disposable income. The comparable figure for 2006 was −0.3%. In contrast, net corporate saving constituted on average 2.6% of gross domestic saving in the 1960s, 4.3% in the 1970s, 6.6% in the 1980s, 5.6% in the 1990s and around 3.7% from 2000 to 2005. The high levels of domestic savings in the 1960s to the 1980s were attributed to high gold prices which resulted in high profits for mining companies at that time.
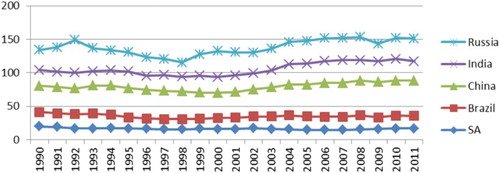
In comparison with other emerging countries, however, South Africa lags behind on the gross domestic savings as a percentage of GDP, as illustrated in . Using data from the World Bank for 1990–2010, the average savings rate in South Africa stood at 16.4% compared with 19% for Brazil, 44% for China, 26% for India and 32% for Russia.
Figure 2. Gross domestic savings as a percentage of gross domestic product (1990–2010). Note: SA = South Africa.Source: World Bank Development Indicators (Citation2013).
The low levels of savings in South Africa becomes worrisome considering the importance of domestic saving in financing domestic fixed capital formation.
3. Theoretical framework and literature review
The available evidence on the link between financial sector development and saving behaviour broadly divides into those at individual country level and cross-country studies. Of the available empirical studies, some authors have relied on methods which seek to establish a long-run relationship between the level of savings and economic growth using a variety of time series models (see Chowdhury, Citation2001; Quartey, Citation2005; Odhiambo, Citation2008; Ang, Citation2010).
Starting with the work of Quartey (Citation2005), the author analysed the impact of financial sector development on savings and poverty in Ghana for the period 1970–2001 employing the Johansen co-integration test and Granger causality. Empirical results revealed that there is no evidence of a causal relationship between financial sector development and savings in Ghana. However, these results were contrary to Adenutsi (Citation2010) who employed the structural vector autoregressive (VAR) model. The author argues that the model ameliorates the analysis of various economic issues by eliminating the problem of identification of the contemporaneous and dynamic relationships between a set of macroeconomic variables and the appropriate policy instruments. The results revealed that financial sector development has enhanced the performance of commercial banks by way of savings mobilisation but adversely impacted on the long-run economic performance directly. This result is consistent with Asamoah (Citation2008) for the same country.
Odhiambo (Citation2008) also employed the Johansen co-integration test in Tanzania for the period 1968–2001, and established that financial sector deepening positively influences the level of domestic savings. However, in a study of Kenya using trivariate Granger causality, the author did not find a causal relationship between financial development and savings.
There are studies which have also employed the autoregressive (AR) distributed lag model. This model is considered robust taking into account that it is able to test for the existence of a long-run relationship regardless of whether the underlying time series are individually I(1) or I(0). Of these studies, Ang (Citation2010) analysed the impact of the financial system on savings in Malaysia for the period 1960–2007. Empirical results revealed that financial deepening impacts positively on savings. However, on the other hand it was found that the development of the insurance markets and liberalisation of the financial system tend to reduce the level of savings in Malaysia. Employing the same model, Khan & Hye (Citation2010) carried out a similar study in Pakistan for the period 1988–2008. The authors found that financial sector development was found to have negatively affected the level of savings both in the short run and the long run. However, employing the same model in the United Kingdom, Granville & Mallick (Citation2004) found that financial sector development promotes savings and hence economic growth.
At the cross-country level, Kelly & Mavrotas (Citation2008) carried out a study on 17 African countries for the period 1972–94 employing the Pedron panel co-integration test, which the authors argue allows one to investigate heterogeneous panels, in which heterogeneous slope coefficients, fixed effects and individual specific deterministic trends are permitted. The results were inconclusive, however, even though a positive relationship was established in many of the countries. The authors argue that as much as strengthening the weak financial systems in Africa is crucial, careful consideration should be given to channels through which the financial system can improve the level of savings. Thus the authors argue that much significance should be given to improving the overall macroeconomic stability, proper regulation and supervision of local banks as well as the regulatory environment for micro-finance institutions to be appropriate policy directions, along with encouraging the provision of savings facilities. These results are in agreement with Sahoo & Dash (Citation2013) for a study in South Asia.
The majority of the studies which have been done in South Africa, mostly by researchers of South African origin, have largely focused on examining the determinants of savings, employing other variables and not necessarily financial sector development. The available studies include Simleit et al. (Citation2011) who examined the determinants of household savings in South Africa and found out that interest rates, upturns in business cycles and the wealth effect do explain the decline in savings rates in South Africa. These results do not correspond with Aron & Muellbauer (Citation2000), however, who established that a rising interest rate has a positive effect on the level of savings. The authors also noted that there is a partial offset between household savings and government savings in South Africa. Prinsloo (Citation2000) in a separate study highlighted low levels of income compounded by high levels of unemployment as another important factor contributing to the low levels of savings in South Africa.
In another study, Odhiambo (Citation2006) examined the impact of financial liberalisation on domestic savings in South Africa from 1987 to 2000. The author employed two measures of financial sector development: real deposit rate and money supply at a percentage of GDP (M2/GDP). The empirical results revealed that there is a positive relationship between domestic savings mobilisation and financial development. However, the measure of financial development employed by the author (M2/GDP) has been criticised by a number of studies. Levine & Zervous (Citation1998) argue that this measure does not indicate whether the liabilities are those of banks, the central bank or other financial intermediaries. In addition, the author shows that the measure does not indicate where the financial system allocates capital. This study resolves this shortcoming by employing three measures of financial development.
4. Methodology and data
4.1. Model specification
The analytical framework used in the study is based on the life-cycle hypothesis. This model assumes that consumers live for a fixed number of periods and wish to smooth their consumption path. It is also assumed that the endowments available to individuals when they are young are small, so they would like to borrow when young in order to smooth consumption over their life cycle. The model was augmented with other variables to take into account key macroeconomic activities and institutional settings in South Africa.
Based on the theoretical considerations discussed, the study benefits from a model developed by Ang (Citation2010). The augmented model is specified as follows:(1) where S/GDP is savings as a percentage of GDP, I/GDP is income represented as a percentage of GDP, Age represents dependency, PS/GDP is public investment as a percentage of GDP, FD/GDP is financial development as a percentage of GDP and Ir is the rate of interest.
The empirical model to be used in the study can be estimated as follows:(2)
4.2. Definition of variables and a priori expectations
The Keynesian view on savings postulates that savings depends on income, such that an increase in income is likely to result in an increase in savings. This is supported by other prior studies such as Masson et al. (Citation1998), Loayza et al. (Citation2000) and Ang (Citation2009).
Age measures the dependency rate. Age constitutes categories of 0 to 14 years and over 65 years. The life-cycle hypothesis theory postulates that dependency encourages dissaving, and thus a negative relationship between savings and age is expected. This is supported by Loayza et al. (Citation2000).
PS measures public savings. According to Ricardian equivalence an increase in public savings is assumed to be met with a decrease in private savings. A negative relationship between the two is therefore expected.
Financial development (FD) is measured by a number of variables to obtain robust results. It is measured by bank credit to the private sector as a ratio of GDP, money supply as measured by M2 and the market capitalisation as a percentage of GDP. Although Ang (Citation2010) argues that the a priori sign of the three measures cannot be determined prior to empirical investigation, in this case a positive relationship between the measures of financial sector development and savings is expected. There are two strands of theory which explain the impact of financial sector development on savings. One strand postulates that development of the financial sector improves resource mobilisation and hence savings (Sahoo & Dash, Citation2013). On the other hand, it is argued that financial sector development can make access to finance easy and hence boost consumption (Nair, Citation2006).
Ir is the rate of interest; the relationship between the interest rate and savings is highly dependent on the substitution and income effects, and also whether individuals are net savers or net borrowers. If people are net borrowers, an increase in the interest rate may cause the income effect to dominate the substitution effect. In this case, savings will fall rather than increase. The Keynesian view breaks down here. However, if individuals are net savers, an increase in the interest rate will favour the future relative to current consumption. The substitution effect will be large, and savings will increase.
4.3. Data sources
Data utilised in the study are from 1980 to 2012, in quarterly series. The choice of the study period is to take into account the period after which many people in South Africa had access to finance, particularly after liberalisation in the 1980s. Data for the variables are obtained from the South African Reserve Bank online query (income, public savings, M2, interest rate), the World Bank (bank credit to the private sector, age) and the Johannesburg Stock exchange (market capitalisation). Age was decomposed from yearly to quarterly data utilising Denton’s (Citation1971) method of interpolation. The method was chosen because of its ability to produce an interpolated series that closely follows the growth rate of the indicator series.
4.4. Estimation technique
The study seeks to establish whether there is a long-run relationship between the variables of interest employing the Johansen co-integration test. However, prior to employing the Johansen approach to co-integration, the time series properties of the variables were established through unit root tests.
The study employed the augmented Dickey–Fuller (ADF) test, the Phillips–Perron (PP) test and the Ng–Perron test to check for the stationarity of the variables as well as determining the order of integration of the variables. The Ng–Perron test was developed by Ng & Perron (Citation2001) and has a number of important features which makes it unique. Firstly, the method applies the generalised least squares procedure in de-trending the time series (Awan et al., Citation2011). Argyro (Citation2009) argues that this approach improves the power of the tests in the case of a large AR root. It also reduces the size distortions when there is a large negative moving average (MA) root in the variable which has been differenced. Argyro further shows that the Ng–Perron test uses a modified lag selection criteria. This is an improvement to the ADF and PP tests in which the lag selection procedures are argued to be under-fitting in the event of a large negative MA root. Since the Ng–Perron test has several advantages compared with the ADF and PP tests, it will take precedence when there is conflict.
4.5. Co-integration tests
Co-integration tests will establish whether there is a long-term relationship between the variables of interest. In the event that there is evidence of co-integration, this will be an indication that variables share a certain type of behaviour in terms of their long-term fluctuations. Prior to testing for co-integration, however, the lag length to incorporate in the VAR was selected empirically. This is important to avoid spurious rejection or acceptance of estimated results and to have standard normal error terms that do not suffer from non-stationary, autocorrelation or heteroskedasticity.
The lag length was chosen based on the different information criterions which include Aikaike’s information criterion (Akaike, Citation1973), the Schwarz information criterion (Schwarz, Citation1978) and the Hannan–Quinn criterion (Hannan & Quinn, Citation1979). Of these criterions, Khim-SenLiew (Citation2004) argues that Aikaike’s information criterion has been popularly adopted in economic studies. Khim-SenLiew suggests that the criterion is able to pick up the correct lag length at least half of the time in small samples. Second, its performance increases substantially as the sample size grows.
The Johansen co-integration test used in the study is discussed as follows. Assuming that Xt is the n × 1 vector of variables, the intra-impulse transmission process of which is to be captured by the study, the dimension of Xt (i.e. n) is 6, given the six variables of the analysis. Using matrix algebra notations, a six-variable structural dynamic economic model for the study can be stated as:(3) where В is the matrix of variable coefficients.
Xt is the 6 × 1 vector of observations at time t of the variables of the study; that is, vector X is defined as:(4)
Also, μ is the vector of constants, Γ is a matrix polynomial of appropriate dimension and εt is a diagonal matrix of structural innovations that have zero means, constant variance and are individually serially uncorrelated – that is,
The vector error correction model (VECM) was estimated to analyse the joint behaviour of the series in the dynamic system. The VECM specification provides both short-run and long-run adjustments. The short run provides the error correction model (ECM-1). ECM-1 was expected to be negative and statistically significant as evidence that in the event that there is disequilibrium in the short term, the variables will adjust to their long-run equilibrium.
The Granger causality tests were also carried out to determine any correlation between the current value of savings and the past values of other variables. The model assumes that time series involved in the analysis are stationery and sensitive to lag length selection, hence the need for conducting stationarity tests and determining the proper lag length as discussed earlier. The test thus seeks to answer the following question: do past changes in financial sector development cause changes in savings in South Africa?
5. Empirical results and conclusion
5.1. Descriptive statistics
presents the summary statistics for all variables used in the study.
Table 1. Summary statistics.
It is interesting to note that the mean value of public savings is negative, suggesting that South Africa has been experiencing a decline in national savings in the majority of the years under consideration. One consequence of the availability of cheap credit in South Africa has been the shift away from future consumption in favour of current consumption, a trend that is reflected in the low savings rate. One would expect that with numerous financial products to encourage savings, both at the private and public sector levels, the savings rate would have shown an upward trend.
Domestic credit to the private sector and value of shares surpass 110% of the GDP. A number of studies on finance and economic growth (Easterly et al. Citation2000; Cerra & Saxena, Citation2008; Arcand et al., Citation2011) argue that the marginal benefits which are derived from financial sector development when it has surpassed the 110% threshold will be negative. This applies more to domestic credit to the private sector.
5.1.1. Unit root tests: level series
The ADF and PP tests report that all variables to be used in the study are non-stationary in their levels. The variables were first examined for the level of integration and the results are presented in and .
Table 2. Unit root tests: first difference series.
Table 3. Ng–Perron test in first difference series.
shows that all of the variables are stationary in first differences. This therefore suggests all that was required was to difference the series once to make them stationary. However, the Ng–Perron test was also carried out for a robust check.
Consistent with the ADF and the PP, the Ng Perron also confirmed that the variables are not stationary at level series. However, all variables are stationary in the first difference. Having established the order of integration of the variables, the next step was to determine the optimum lag length to be used in the study. In choosing the optimum lag length, the information criterions produced conflicting results. As supported by a number of literature studies (Takaendesa, Citation2006; Asteriou & Hall, Citation2011), the standard approach is to examine the model with different lags. The lag length selection results show that the information criterions selected two different lags, lag 2 and lag 9. Thus the study utilised both lag 2 based on the other information criterions, as well as lag 9 based on the likelihood ratio (LR) test. In addition, a number of studies have shown that a lag of 2 is not enough to solve the problem of residual correlation in the errors, which will also support the use of longer lags.
Using a lag length of 2, the results indicate that there is one co-integrating relationship. However, for robustness a lag length of 9 as chosen by the LR test was also employed, and the results are presented in and respectively.
Table 4. Johansen co-integration technique results.
Table 5. Johansen co-integration technique results.
illustrates that there are seven co-integrating relationships, showing that the variables of interest have a long-run relationship. The interest of this study is not to analyse the interaction between the variables, but to establish whether there is a long-run relationship between the variables. Therefore, from and , the null hypothesis of no co-integration was rejected at a 0.05 level of significance from both the trace statistic and the maximal eigenvalue at none, indicating that there is a co-integrating relationship among the variables. With this evidence it can be interpreted that South Africa’s savings rate and income, age, public savings, M2, bank credit to the private sector, value of shares and interest rate were moving together in the long run. Given that a long-term relationship exists between the variables of interest, a VECM was estimated.
Given that the interest of the study was to examine the response of the savings to income, age, public savings, M2, value of shares traded and the rate of interest, the co-integrating vector normalised on savings is presented in .
Table 6. Vector error correction model.
As presented in , all variables enter the long-run equation significantly and the signs and magnitudes also appear reasonable. As indicated in the long-run equation, the magnitude of the coefficient of income (0.25) shows that the propensity to save is low. For an increase in income of R1, about 25 cents is allocated towards savings with the rest being consumed. The results are, however, consistent with the a priori expectations suggesting that the level of household savings in South Africa grows with the increase in income and corroborate the findings of Prinsloo (Citation2000) for South Africa, Loayza et al. (Citation2000) on cross-country studies, Ang (Citation2009) in the case of India and China, and Ang (Citation2010) for Malaysia.
The empirical results also provide support for the view that demographic factors do play a role in determining the level of savings in South Africa. The magnitude of the age variable is very high and significant. This is consistent with the a priori expectation that age dependency encourages dissaving. These results are also consistent with Loayza et al. (Citation2000) and Cronje & Roux (Citation2010).
Table 7. Vector error correction model.
Table 8. Vector error correction Granger causality test results.
Public savings have a negative coefficient which suggests that government savings result in a reduction in savings in South Africa. This is consistent with Ang (Citation2010) and Simleit et al. (Citation2011). This does not provide support for the Ricardian equivalence hypothesis.
The three measures of financial sector development are all positively related to savings. This suggests that financial deepening has played a beneficial role in the accumulation of savings in South Africa. This result is consistent with the a priori expectations and corresponds to the findings of Ozcan et al. (Citation2003), Odhiambo (Citation2006), Kelly & Mavrotas (Citation2008) and Ogwumike & Ofoegbu (Citation2012) in the case of Nigeria. This implies that authorities should continue to pursue policies aimed at developing the financial system as well as expanding the access of it to the general masses since this facilitates the mobilisation of savings.
The interest rate coefficient is negative and significant. This corresponds to the income effect dominating the substitution effect hypothesis and is supported by the findings of Odhiambo (Citation2006) and Simleit et al. (Citation2011). This suggests that the majority of South Africans are net borrowers. Therefore, an increase in the interest rate is likely to cause the income effect to dominate the substitution effect, resulting in a fall in savings.
5.2. Vector error correction model
Having established the presence of co-integration, the VECM was specified to analyse the short-term interaction between the variables.
The results presented in indicate that the Granger causal relationship can be seen based on the value of ECT-1 for every variable in the table. Based on the result of the VECM test, it is found that the value of ECT-1 for the savings variable is significant and negative. This proves that the variables of income, age, public savings, bank credit to the private sector, M2, value of shares and interest rate tend to Granger cause savings. In other words, the savings variable in the equation bears the burden of a dispersed error correction of short-term balance to achieve long-term balance as much as 42% within a quarter. This is supported by Puah & Jayaraman (Citation2007) and Wongbangpo & Sharma (Citation2002).
5.3. Vector error correction Granger causality tests
Granger causality tests were estimated to examine causality in the vector error correction system. Granger causality tests provide the direction of causality. Interest in this study was to establish the variables which Granger cause savings, not necessarily how savings interact with the other variables. The results show that income and the two measures of financial development (credit to the private sector and value of shares traded) Granger cause savings. This is consistent with the long-run co-integration results and corroborates the a priori expectations.
6. Conclusion and recommendations
This study focused on examining the relationship between financial sector development and savings behaviour in South Africa. Based on a review of the literature, a model linking financial development and savings was adopted. The Johansen test confirmed the presence of co-integration. This therefore implied that there is a long-run relationship between savings and its determinants. The VECM was also estimated to analyse both the long-run and the short-run interaction between the variables. The results established that financial sector development has facilitated the accumulation of savings in South Africa, which was the aim of the study. Authorities should therefore further develop the financial system in order to facilitate the mobilisation of savings in South Africa. This can be achieved through adopting financial reforms, which opens up the banking sector that is dominated by the big four banks. This will increase competition in the industry through ensuring that market-determined interest rates are charged. In addition, such a policy will encourage financial innovation and attract more savers into the financial system. The study also established that there is no support for the Ricardian equivalence hypothesis in South Africa given that public savings crowd out private savings. Government expenditure which is unnecessary should be avoided. The negative relationship between savings and the interest rate suggests that the majority of South Africans are net borrowers. This suggests that in the event that there is an increase in interest rates, costs of borrowing will increase, hence reducing the amount of money which can be directed towards savings. There is need for education towards the use of financial products so that people are not over-indebted.
References
- Addison, T, 2007. International finance and the developing world: The next twenty years. In Mavrotas, G & Shorrocks, A (Eds.), Advancing development: Core themes in global economics, (pp. 1–18). Palgrave Macmillan, Basingstoke.
- Adenutsi, DE, 2010. Financial development, bank savings mobilisation and economic performance in Ghana: Evidence from a multivariate structural VAR. International Journal of Development Research and Quantitative Techniques 2(1), 3–24.
- Akaike, H, 1973. Information theory as an extension of the maximum likelihood principle. In Petrov, BN & Csaki, F (Eds.), Second international symposium on information theory (pp. 267–281). Akademiai Kiado, Budapest.
- Ang, JB, 2009. Household saving behaviour in an extended life cycle model: A comparative study of China and India. Journal of Development Studies 45(8), 1344–1359. doi: 10.1080/00220380902935840
- Ang, J, 2010. Savings mobilisation, financial development and liberalization: The Case of Malaysia, MPRA Paper No. 21718.
- Arcand, J, Berkes, E & Panizza, U, 2011. Too much finance? International Monetary Fund Working Paper, WP/12/161.
- Argyro, K, 2009. Testing the fisher effect in OECD countries: An empirical investigation. Master’s Thesis, University of Macedonia.
- Aron, J & Muellbauer, J, 2000. Personal and corporate saving in South Africa. The World Bank Economic Review 14(3), 509–544. doi: 10.1093/wber/14.3.509
- Asamoah, GNA, 2008. The impact of the financial sector reforms on savings, investments and growth of gross domestic product in Ghana. International Business & Economic Research Journal 7(10), 73–84.
- Asteriou, D & Hall, SG, 2011. Applied econometrics: A modern approach using eviews and microfit. Revised edition. Palgrave Macmillan, London.
- Awan, A, Asghar, N & Rehman, H, 2011. The impact of exchange rate, fiscal deficit and terms of trade on external debt of Pakistan: A cointegration and causality analysis. Australian Journal of Business and Management Research 1(3), 10–24.
- Bayoumi, T, 1993. Financial deregulation and household saving. The Economic Journal 103, 1432–1443. doi: 10.2307/2234475
- Blanchard, O & Milesi-Ferretti, GM, 2011. Why should current account balances be reduced, IMF Staff Discussion Note SDN/11/03.
- Cerra, V & Saxena, SC, 2008. Growth dynamics: The myth of economic recovery. American Economic Review 98(1), 439–457. doi: 10.1257/aer.98.1.439
- Chowdhury, AR, 2001. The impact of financial reform on private savings in Bangladesh. United Nations University, World Institute for Development Economic Research, Discussion Paper No. 2001/78.
- Cronjé, M & Roux, A, 2010. Creating a savings culture for the black middle class in South Africa – policy guidelines and lessons from China and India. University of Stellenbosch Business School 4(2).
- Denton, FT, 1971. Adjustment of monthly or quarterly series to annual totals: An approach based on quadratic minimization. Journal of the American Statistical Association 66, 99–102. doi: 10.1080/01621459.1971.10482227
- Easterly, W, Islam, R & Stiglitz, J, 2000. Shaken and Stirred, Explaining Growth Volatility. Annual Bank Conference on Development Economics, 1-13. Washington, DC: World Bank.
- Granville, B & Mallick, S, 2004. Pension reforms and saving gains in the United Kingdom, Journal of Policy Reform 7(2), 123–136.
- Hanival, S & Maia, J, 2008. An Overview of the Performance of the South African Economy since 1994. http://www.npc.gov.za/…/Economy2/An%20economic%20performance.pdf Accessed 15 April 2013.
- Hannan, EJ & Quinn, BG, 1979. The determination of the order of an autoregression. Journal of the Royal Statistical Society 41, 190–195.
- Harjes, T, & Ricci, LA, 2006. What drives saving in South Africa? https://www.imf.org/external/pubs/nft/2006/soafrica/eng/…/sach4.pdf Accessed 10 June 2014.
- Jappelli, T & Pagan, M, 1994. Savings, growth and poverty: How close are the links? World Bank Research Working Paper, No. 3203.
- Kelly, R & Mavrotas, G, 2008. Savings and financial sector development: Panel cointegration evidence from Africa. The European Journal of Finance 14(7–8), 563–581. doi: 10.1080/13518470801890602
- Khan, REA & Hye, QMA, 2010. Financial liberalization and demand for money: A case of Pakistan, University Library of Munich, Germany, MPRA Paper 34795.
- Khim-SenLiew, V, 2004. On autoregressive order selection criteria. Computational Economics 0404001, EconWPA.
- Levine, R & Zervos, S, 1998. Stock markets, banks and economic growth. American Economic Review 88, 537–558.
- Liu, L & Woo, WT, 1994. Saving behaviour under imperfect financial markets and the current account consequences. The Economic Journal 104(424), 512–527. doi: 10.2307/2234628
- Loayza, N, Schmidt-Hebbel, K & Servén, L, 2000. What drives private saving across the world? Review of Economics and Statistics 82(2), 65–181.
- Luüs, C, 2007. Household saving behaviour and its promotion in South Africa, Absa Group Economic Research. http://www.financialmarketsjournal.co.za/5thedition/householdsaving.htm Accessed 10 August 2013.
- Mackinnon, JG, Haug, AA & Michelis, L, 1999. Numerical distribution functions of likelihood ratio tests for cointegration. Journal of Applied Econometrics 14(5), 63–577. doi: 10.1002/(SICI)1099-1255(199909/10)14:5<563::AID-JAE530>3.0.CO;2-R
- Masson, PR, Bayoumi, T & Samiei, H, 1998. International evidence on the determinants of private saving. The World Bank Economic Review 12, 483–501. doi: 10.1093/wber/12.3.483
- Nair, LR, 2006. Financial sector liberalization and household savings in India. Indian Institute of Capital Markets 9th Capital Markets Conference Paper.
- Ng, S & Perron, P, 2001. LAG length selection and the construction of unit root tests with good size and power. Econometrica, Econometric Society 69(6), 1519–1554. doi: 10.1111/1468-0262.00256
- Odhiambo, NM, 2006. Financial liberalisation and savings in South Africa: An empirical analysis. African Review of Money Finance and Banking, 61–74.
- Odhiambo, NM, 2007. Financial depth, savings and economic growth in Kenya: A dynamic causal linkage. Science Direct Economic Modelling 25(2008), 704–713.
- Odhiambo, NM, 2008. Interest rate reforms, financial depth and savings in Tanzania: A dynamic linkage. Savings and Development 32(2), 141–158.
- Ogwumike, FO & Ofoegbu, DI, 2012. Financial liberalisation and domestic savings in Nigeria. The Social Sciences 7(4), 635–646. doi: 10.3923/sscience.2012.635.646
- Ozcan, K, Gunay, A & Ertac, S, 2003. Determinants of private savings behaviour in Turkey. Applied Economics 35, 1405–1416. doi: 10.1080/0003684032000100373
- Prinsloo, J, 2000. The saving behaviour of the South African economy. South African Reserve Bank Occasional Paper No. 14, 1–34.
- Puah, CH & Jayaraman, TK, 2007. Macroeconomic activities and stock prices in a South Pacific Island economy. International Journal of Economics and Management 1(2), 229–244.
- Quartey, P, 2005. Financial sector development, savings mobilization and poverty reduction in Ghana, UNU World Institute for Development economics research (UNU-WISER).
- Richards, J, 2013. Overview of the financial services sector in South Africa. http://www.frontiermarketnetwork.com/article/2347-overview-of-the-financial-services-sector-in-south-africa#.UpYZWSeKJ2E Accessed 27 November 2013.
- Sahoo, P & Dash, RK, 2013. Financial sector development and domestic savings in South Asia. Economic Modelling 33, 388–397. doi: 10.1016/j.econmod.2013.04.018
- Schwarz, G, 1978. Estimating the dimension of a model. The Annals of Statistics, 6, 461–464. doi: 10.1214/aos/1176344136
- South African Reserve Bank, 2014. Annual report. SARB, Pretoria.
- Simleit, C, Keeton, G & Botha, F, 2011. The determinants of household savings in South Africa. Journal for Studies in Economics and Econometrics 35(3), 1–20.
- Takaendesa, P, 2006. The behaviour and fundamental determinants of the real exchange rate in South Africa. Rhodes University, Unpublished.
- Wongbangpo, P & Sharma, SC, 2002. Stock market and macroeconomic fundamental dynamic interaction: ASEAN-5 countries. Journal of Asian Economics 13(1), 27–51. doi: 10.1016/S1049-0078(01)00111-7
- World Bank Development Indicators, 2013. World Databank, Washington, DC.
- World Economic Forum, 2013. The global competitiveness index 2011–2012 rankings and 2012–2013 comparisons. http://www.weforum.org/reports/global-competitiveness-report-2013-2014 Accessed 27 October 2013.