ABSTRACT
With the introduction of the Quarterly Labour Force Survey since 2008, a newly derived variable, namely underemployed, has become available. It is derived according to the ‘time-related’ approach (i.e. those who are employed, but would like to work longer hours and are available to work longer hours in the near future). However, underemployment could also be derived according to the ‘inadequate employment situations’ approach (e.g. under-utilisation of skills, over-qualification). Because underemployment is a seriously under-researched topic in South Africa, this article investigates the extent of underemployment according to these two definitions, before examining whether the characteristics of the two groups of underemployed are significantly different.
KEYWORDS:
JEL CODE:
1. Introduction
Since the advent of democracy in South Africa, policy changes to promote equality have been occurring in spheres such as education, health care and within the labour market. There have been numerous measures enforced by the government with the aim of, amongst others, reducing unemployment, poverty, inequality, labour market discrimination and rigidities.
One of the major socio-economic issues the country is still grappling with to date remains the persistently high unemployment level. In the second quarter of 2016, the unemployment rate was 26.6%, way above the Accelerated and Shared Growth Initiative for South Africa (ASGISA) goal of reducing this rate to 15% by the end of 2014, with 5.63 million labour force being unemployed. Over the years, labour market analysis has focused mainly on the employed versus the unemployed, discouraged work-seekers also being accounted for. However, as the labour market grows in terms of complexity, the mere distinction between employed and unemployed may be inadequate. Also, economic policies around job creation always seem to focus on increasing the number of employed or setting out goals to create a certain number of new jobs within a particular period. However, little attention is paid to the extent to which jobs occupy people in terms of work hours and the way in which it utilises their skills and qualifications. The capacity of the labour force is therefore often disregarded.
Labour agencies in various developed countries have seen the need to consider that unemployment rates may not be an adequate measure of labour under-utilisation. Some of the employed may not have their potential labour resources being fully utilised. This presents an issue for economists, because the under-utilised labour is not recoverable. Even more unsettling is that the loss of skills and future career path consequences for individuals may be hampered for a longer duration than is expected, impacting the labour force in a manner that could exacerbate structural problems in an economy.
With the introduction of the Quarterly Labour Force Survey (QLFS) by Statistics South Africa (Stats SA) since 2008, a new variable called ‘underemployment’ has been available.Footnote1 One drawback is that this variable only relates to the time-based approach, which in brief terms associates with individuals who are employed and are willing and able to work longer hours but cannot for various reasons. Nonetheless, underemployment can also be analysed in the context of the ‘inadequate employment situations’ approach which highlights the under-utilisation of skills or over-qualification.
To date, the majority of existing studies focus on the characteristics of the unemployed, the causes of unemployment and policy options to alleviate unemployment (Kingdon & Knight, Citation2004; Banerjee et al., Citation2008; Bhorat, Citation2009, Citation2012). However, there is a need to investigate underemployment in South Africa because there are currently only few local studies on it, and most of these studies did not examine underemployment in great depth (to be discussed later). This study aims to fill the existing research gap by examining underemployment using the time-based and inadequate employment approaches. The rest of the article is structured as follows: Section 2 presents the conceptual framework and theoretical framework as well as a review of past local and international studies, Section 3 explains the methodology and data as well as the results of the empirical data analysis, and Section 4 concludes the study.
2. Literature review
2.1. Conceptual framework
There are two commonly adopted approaches to distinguish the underemployed, namely the time-based approach and the inadequate employment situations approach. In the former approach, underemployed refer to those employed who work fewer hours than they wished for, while the underemployed in the latter approach stand for the situation where workers find themselves in professions or jobs where their skills, training and experience are under-utilised (Bonnal et al., Citation2009:317; Wilkins & Wooden, Citation2011:14). This in turn implies that these persons are not given the opportunity to fully utilise their productive ability, despite the fact that they are willing to work more effectively (Greenwood, Citation1999:3).
In the QLFS, time-based underemployed represent workers who: (1) are willing and available to work additional hours AND (2) only worked fewer than 35 hours during the reference week AND (3) are able to start the extra work within the next four weeks (Yu, Citation2009:20). In contrast, the International Labour Organization (ILO) defines underemployed as those who, during the reference week, were both willing to work additional hours and available to work these additional hours, but in reality they worked fewer than a certain number of hours (Greenwood, Citation1999:4). In other words, the ILO definition only considers criteria (1) and (2).
While Stats SA does not distinguish the underemployed using the inadequate employment situations approach, the ILO does so by identifying them as the employed who desire to change their existing work situation, on condition that their current work situation limits both their competencies and their well-being (Greenwood, Citation1999:8). Wilkins & Wooden (Citation2011:16) argue that there are three explicit types of inadequate employment situations: skills-related underemployment; excessive working hours; and income-related underemployment.
Skills under-utilisation or over-qualification occurs if the persons find themselves in a particular work situation where the qualifications and skills they possess are too advanced (Kazan, Citation2012:1). This happens because the tasks and competencies their jobs require them to do and have respectively do not require ‘that level’ of expertise and skill. Thus, the persons’ skills are under-utilised and they are over-qualified for the position.
Skills-related underemployment could be classified into intra-skill and inter-skill underemployment (Glyde, Citation1977:258): the former occurs when individuals who belong to a particular skill group are unable to utilise their skills in the same way as the others in the same skill group, due to reasons like discrimination by employers; the latter takes place when the individuals in a particular skill group have trouble employing a particular skill because it is less sought after when compared with other skills that entail the same investment cost.
Examining over-qualification in greater depth, it can be measured using four approaches of which two are considered to be subjective while the remaining two are objective (McGuinness, Citation2006): the first subjective approach asks the worker directly whether he/she perceives he/she is over-educated or not; the second subjective approach entails asking the worker to make a comparison between his/her own subjective assessment of the minimum education requirements of his/her current job and to his/her attained education level (Wilkins & Wooden, Citation2011:26). In the first objective approach, an employed is over-qualified if his/her years of education are one standard deviation above the mean years of education associated with his/her relevant occupation category (McGuinness, Citation2006:396);Footnote2 while the second objective approach assesses over-qualification by determining the education level required by an individual in relation to his/her job title and before comparing this required level with his/her actual level, with the aid of information obtained from professional job analysts.Footnote3
McGuinness (Citation2006) as well as Wilkins & Wooden (Citation2011) argue that the subjective measures may have led to derivation of higher likelihood of underemployment than using objective measures. Issues arise from the quality of data collected, because workers may not have the best understanding of the requirements of the job in terms of qualification. However, the objective approaches are not without shortcomings; the measurement of over-qualification by means of the standard deviation approach has undergone criticism because the choice of cut-off points is arbitrary. In addition, as the standard deviation method makes use of the assumption of symmetry, it has been argued that it is unrealistic. Lastly, in the situation where a certain occupation comprises a large proportion of workers who are classified as being over-educated, this may result in an under-estimation of the actual level of over-qualification. This is attributed to the fact that the high proportion of over-educated workers will bring about a rise in the occupational average as well as the associated cut-off points (McGuinness, Citation2006:396). Alternatively, in the case of the occupation dictionary approach, it has also been criticised for being unrealistic. One reason for this is centred on the fact that this approach assumes that the educational requirements are the same for all jobs which fall within the same occupation code. Furthermore, these dictionaries are not updated on a regular basis and as a result the assumption is made that job requirements (in terms of the educational level required in this case) are constant over time. Finally, even at extremely disaggregated levels, heterogeneity exists within occupations (Wilkins & Wooden, Citation2011:25).
Reference has been made to underemployment as being either qualitative or quantitative. Qualitative underemployment refers to individuals who accept employment associated with a level below their qualification, skill and experience levels, while quantitative underemployment takes place when individuals find themselves in employment where the required work hours are less than what they desire (this is often found in non-voluntary part-time work) (Ruiz-Quintanilla & Claes, Citation1994:5). Furthermore, visible and invisible underemployment could be distinguished (Barker, Citation2007:177): visible underemployment refers to persons who work less than normal hours on an involuntary basis. These individuals are seeking to or desire working longer hours or even on a full-time basis. In contrast, invisible underemployment means the misallocation of labour resources, which implies workers with low levels of productivity or the under-utilisation of skills.Footnote4
Few studies have even referred to the unemployed as being part of the underemployed (Clogg et al., Citation1986; Slack & Jensen, Citation2002). Finally, underemployment brings about a number of consequences relating to economic outcomes as well as measures of the general well-being and self-esteem of individuals, in the areas of life satisfaction, job satisfaction and wages (Altman, Citation2007:7; Wilkins & Wooden, Citation2011:25).
2.2. Theoretical framework
represents a graphical illustration of time-based underemployment. Assume the person spends 16 hours on either work or leisure each day. This person is currently employed at an hourly wage of W, but would have preferred to work 11 hours per day (as indicated by point A), attaining a utility level of U3. However, this individual is unfortunately offered employment that requires him or her to work only three hours per day (point B). As a result, this person attains a lower utility level of U1. The person is underemployed at point B, because he/she prefers to work an additional eight hours per day. Shorter work hours are associated with a lower wage income (Y1) as compared with the prospective income that the individual would have earned (Y2) had he/she been fully employed.
Figure 1. Underemployment: time-based approach.
The examination of skills under-utilisation or over-qualification may spark thoughts of the human capital theory, which expects that the investment in education and training results in better labour market outcomes in terms of higher labour income. However, the presence of skills-related underemployment may implicitly contradict this theory. Assuming the individual has a bachelor degree, he/she would want to be offered a higher wage (W3) by involving in a highly-skilled occupation, as shown in . The individual therefore hopes to attain a utility of U3 which is found at point E, and earns a total wage income of Y3 by working 10 hours. However, the individual eventually could only find employment in a semi-skilled occupation which requires a lower educational qualification (e.g. Matric) than the level he possesses (bachelor degree). This job is in turn accompanied by a lower wage (W1) which means that the equilibrium point will now be at point C. This point is also associated with a lower level of utility (U1) and total wage income (Y1), even though the daily work hours remains the same at 10 hours.
Figure 2. Underemployment: over-qualification approach.
The dotted budget line in this figure stands for another person with a post-Matric certificate and finds a job requiring the same level of qualification at a wage of W2 (which is higher than W1 but lower than W3). This person is fully employed and earns a total labour income of Y2. To conclude, comparing the outcome of the first person (who possesses a bachelor degree but is underemployed by involving in a job that only requires Matric) with that of the second person (who holds a post-Matric certificate and is fully employed in a job that requires the same qualification), this implies that if underemployment (skills under-utilisation for the first person) takes place, it contradicts the expected outcome of the human capital theory that higher educational qualifications would lead to higher labour earnings.
Researchers, from a theoretical perspective, have also associated this under-utilisation of skills with notions of misalignment in terms of person–job fit. Person–job fit, as the name implies, indicates how well the skills and competencies of an employee matches their job and its demands (McKee-Ryan & Harvey, Citation2011:971). Based on this theory, underemployment indicates a lack of fit and as a result is associated with negative labour market outcomes. Relating this back to the budget line/indifference curve analysis, the fact that the first employee (from ) was only able to find semi-skilled employment instead of highly-skilled employment related to his or her field of study verifies the situation of a misalignment between the skills and competencies of the person and their job.
2.3. Review of past studies
There are only six local studies at the time of writing. Altman (Citation2003), whilst primarily examining whether jobless or job-creating growth took place during 1994–2001, briefly examined underemployment by defining them as those working in the informal sector, domestic services (private households) and subsistence agriculture. She found that these underemployed accounted for 14% of all employed in 1994 before rising to 21% in 2001. Altman (Citation2003:9–10) also mentioned that the underemployed wished to work longer hours and enjoy secure employment, better benefits and higher remuneration. The other study by Altman (Citation2009) briefly examined the time-based underemployed in 2008 and found that they were more likely to be female blacks aged 15 to 24 years, residing in KwaZulu-Natal and Free State; Yu (Citation2009) also examined underemployment briefly and found the majority of underemployed were blacks and females, involving in unskilled occupations (nearly 60% share). Mathebula (Citation2013) conducted econometric analysis to consider the determinants of time-related underemployment, and found that females and those without post-Matric qualifications, residing in urban areas, with limited contract duration and working in the community, social and personal services as well as real estate, financial intermediation, insurance and business services occupations were significantly more likely to be underemployed.
Moleke (Citation2005) conducted a primary survey on the labour market outcomes of 2600 university graduates who obtained their post-Matric qualifications in 1990–1998. He first found that 16% of the graduates were underemployed, working as administrators, operators or trainees (these jobs do not necessarily require a bachelor degree), with the underemployment likelihood relatively higher for graduates coming from the field of Economic and Management Sciences, followed by Humanities and Arts. Nonetheless, the extent of underemployment reduced over time, as a huge 93% of the respondents reported that only entry-level or lower-level ability was required in their first job but this dropped to 75% in their current job. This result suggests that upward labour mobility took place, because some graduates who were originally underemployed later found work that matched their education/skills better. Also, the graduates initially had low reservation wages and preferred to be underemployed rather than unemployed; but over time, some of them searched for a better job and became fully employed (Moleke, Citation2005:23).
Schoeman et al. (Citation2010) examined the role labour conflict played in the persistence of macro underemployment (using capital/labour ratio as the proxy variable) during 1970–2004. The econometric analysis indicated that there was a significantly positive relationship between strike frequency and capital/labour ratio. That is, underemployment results through a switch in technology being the channel; bad labour relations have been shown to contribute to the choice of more capital-intensive techniques and hence less labour-absorptive measures. The co-integration analysis showed that once labour has been replaced by capital, a reversal is not likely (Schoeman et al., Citation2010:286). Capital is highly inflexible even in the long run. Thus the long-term effects on underemployment due to structural reasons in an economy cannot be easily remedied.
Numerous international studies investigated the extent and nature, predictors and consequences of underemployment. Golub & Hayat (Citation2014) cited the main reason for underemployment in Africa as a dualistic labour market that is deficient of labour demand. A predominance of informal-sector employment and agricultural activities exists, which results in underemployment rather than open unemployment. In a report presented at the G20 Labour and Employment Ministerial Meeting (OECD Citation2014:7), underemployment was characterised by workers in informal, low-paid, part-time low-productivity agricultural employment. It was also found that informal employment in many low-income sub-Saharan African countries accounted for 80% of total employment. The formal sector was not successful in creating sufficient jobs to absorb the labour force, thereby resulting in growing underemployment.
Wilkins & Wooden (Citation2011) examined involuntary part-time employment in the OECD countries and the underemployment rate ranged from 0.4% in Hungary to 4.3% in Italy. Bell & Blanchflower (Citation2013) adopted the same definition, asking British workers whether they felt constrained by their working hours. A composite index (which took unemployment rate and willingness of workers to supply extra work hours into consideration) was derived, and it was found that underemployment has risen sharply since the recession in 2008. Tam (Citation2010) also found that underemployment rates in the United Kingdom rose during recession as labour demand declined.
Walling & Clancy (Citation2010) as well as Cam (Citation2014) found that underemployment likelihood in the United Kingdom was typically higher for women than men, but varies across demographics and work-related factors. Those involved in part-time jobs, sales and customer services were associated with a greater likelihood of underemployment (Cam, Citation2014:15). Sengenberger (Citation2011) found that time-based underemployment rose over the period 1990–2005 although results varied across countries. Time-related underemployment was higher for women than men. Wilkens (Citation2006) similarly found underemployment to be more prevalent among females. Ansah (Citation2012) found that most of Ghana’s work activities took place in agriculture and the informal economy, and the time-based underemployment rate was higher in urban areas at 7.6% versus rural areas at 3.5% (Ansah, Citation2012:109). Denu et al. (Citation2005) found serious time-based youth underemployment in rural areas, as the mean weekly work hours of rural youth employed (21.3 hours) were significantly lower when compared with urban youth employed (36.8 hours).
The studies associated with the over-qualification definition typically adopted either objective measures or subjective measures as discussed in Section 2.1. First, Felstead & Green (Citation2013) examined the 2012 UK survey data to determine the extent of qualification mismatch with the job as reported by the respondents. They found higher rates of over-qualification for youth aged 20 to 24 years, those engaged in part-time work in services industries. Fleming & Kler (Citation2008) found that 34.36% of the employed in Australia were over-educated, with a majority of them being young adults having formal qualifications but limited work experience.
Mosca & Wright (Citation2011) considered graduate underemployment in the United Kingdom. If a graduate was employed in an occupation with a skills requirement lower than a bachelor degree, this constituted underemployment. It was found that a quarter of graduate employed were involved in non-graduate jobs 3.5 years after graduation. Quality of the institution, subject of study and award classification were statistically significant in the econometric analysis to explain the underemployment likelihood. In contrast, an interdisciplinary view of underemployment in Canada during 1997–2011 was taken by Reynolds (Citation2012), by examining involuntary part-time, over-qualification, involuntary temporary work, low-wage employment and unemployment. It was found that the youth (15 to 24 years) experienced a greater likelihood of labour under-utilisation through temporary work and minimum wages (Reynolds, Citation2012:11). Another objective measure to determine over-qualification is the standard deviation approach. Studies using this approach (Groot, Citation1996; Groot & Van den Brink, Citation2000; Bauer, Citation2002) yielded lower incidence of underemployment than subjective measures.
For studies using the subjective approaches, in Bonnal et al.’s (Citation2009) study, respondents were asked whether they thought they were underemployed, and the underemployment rates were 24.0% and 25.2% in 2004 and 2005 respectively in Alabama. Finally, few studies focused on examining the consequences of underemployment: Kazan (Citation2012) found during recession that employers would make use of more part-time staff, leading to the under-utilisation of the workforce. Hence, Kazan raised some concerns that organisations should address various risks associated with the under-utilisation of labour, such as low morale, workplace stress and low productivity. Fleming & Kler (Citation2008) found that across their six measures of satisfaction, over-qualified workers were less satisfied, while Wilkens (Citation2006) found that mean job satisfaction was lower amongst part-time workers.
To conclude, the majority of the local and empirical studies derived the profile of the underemployed (females, youth, residing in rural areas and working in services industries), but there are hardly in-depth studies that examined whether the characteristics of various groups of underemployed differed significantly, and whether there was any relationship between underemployment, unemployment and economic growth.
3. Empirical findings
3.1. Data and methodology
This section adopts the time-based and over-qualification approaches to examine underemployment in South Africa, using data from the 1995–1999 October Household Surveys (OHSs), 2000–2007 Labour Force Surveys (LFSs) and 2008–2016 QLFSs conducted by Stats SA.
As far as the derivation of the time-based underemployment is concerned, as discussed earlier, this variable is available (derived by Stats SA using the three key criteria) in the QLFS 2008–2016 datasets. However, it is also possible to distinguish the time-based underemployed in the LFSs 2000–2007, because all three key questions (see Section 2.1) were asked in these surveys. However, with regard to the third criterion, the question was asked as ‘if extra work was available, would you be able to start such work in the next four weeks?’ in the LFSs but rather asked as ‘would you have liked to work more hours than you actually worked, provided the extra hours had been paid?’ in the QLFSs.Footnote5 Hence, the time-based underemployment estimates may not be entirely comparable between the LFSs and QLFSs. In the OHSs, because the question on the third criterion was not asked, time-based underemployed could only be derived by considering the respondents’ answers to the first two criteria (i.e. the ILO ‘lenient’ approach is adopted), and the number of time-based underemployed could be over-estimated to some extent for the OHSs.
Two approaches are adopted to determine over-qualification. The first approach considers the educational requirement for each occupation category. in Appendix 1 outlines the required education level for each broad occupation category, as indicated by Stats SA (Citation2008). Hence, an employed worker is classified as underemployed if he/she is employed in an occupation where the required education level is below his/her educational attainment level. For example, if someone with Matric works in an elementary occupation (which only requires primary education), he/she would also be classified as underemployed. A second and perhaps more appropriate method to distinguish the underemployed using the over-qualification approach is that the education years of someone in a particular occupation category is at least one standard deviation above the mean of the employed in this occupation category.
The demographic, educational and work characteristics of the two groups of underemployed are compared with those of the other (fully) employed to examine whether the characteristics of the three groups differ significantly, before Heck probit regressions are conducted to find out who are significantly more likely to be classified as underemployed.
3.2. Number of underemployed
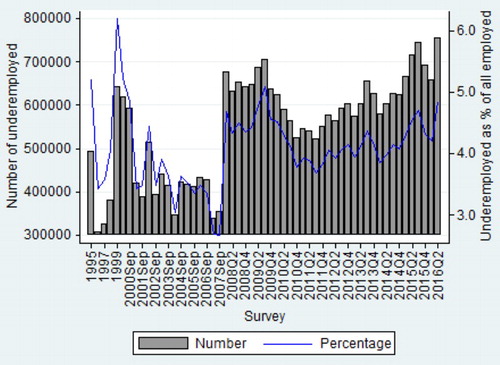
shows that the number of time-based underemployed has been fluctuating between 307 000 and 755 000 during the 1995–2016 period. These underemployed accounts for 2.7 to 6.2% of all employed. This proportion was the highest in OHS 1999 (6.2%) right after the Asian crisis, but the lowest in the LFS 2007 September survey (2.7%) just before the global economic recession took place.
Figure 3. Underemployment derived from the time-based approach, 1995–2016. Source: Authors’ own calculations using OHS 1995–1999, LFS 2000–2007 and QLFS 2008–2016 data.
Moving on to underemployment from the two over-education approaches, as mentioned earlier, one big drawback of the first approach (educational requirement for each occupation category) is that the educational requirement for each occupation is unchanged in all surveys, even though the employed are more educated over the years (see in Appendix 1 in the case of South Africa, especially for the black and coloured population groups). Thus, the share of underemployed has nearly doubled due to the general level of education increasing. This is evidenced in in Appendix 1, which shows that the number of underemployed increased from 1.5 million in 1995 to 4.3 million in the second quarter of 2016, while the share of these underemployed as proportion of all employed increased from 15.7% to 27.7%.
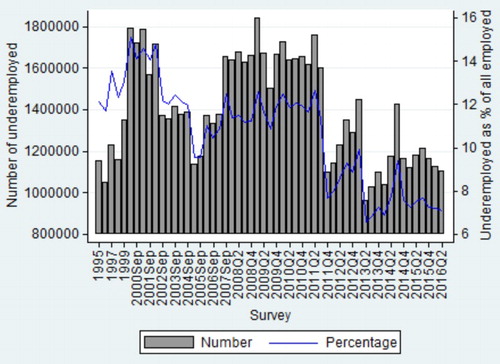
The discussion in Section 2.3 indicates that little empirical work has been done using this second approach (one standard deviation method). shows that there is no discernible trend in underemployment under this approach, with the number of underemployed fluctuating around 1.2 million in 1995 to 1.1 million in the second quarter of 2016. The share of underemployed according to this approach as a proportion of all employed hovered in the 6.5 to 15.0% range. This share was the highest in LFS 2000 March but the lowest in QLFS 2013 second quarter.
Figure 4. Underemployment derived from the over-qualification approach (years of education exceed one standard deviation of the mean years of education of the relevant occupation category), 1995–2016. Source: Authors’ own calculations using OHS 1995–1999, LFS 2000–2007 and QLFS 2008–2016 data.
For the remainder of this study, under-employed using this second over-qualification approach, along with the time-based unemployed, would be the focus of the remaining empirical analysis. Finally, in Appendix 1 shows the number of under-employed (from the two aforementioned approaches) and its share of all employed during 1995–2016. A downward trend could be observed in the 2009–2016 period, as the underemployed’s share of total employed decreased from 16.3% to 11.7%.
3.3. Profile of the underemployed
presents the profile of the following three groups of employed in 2008 and 2015: Group (1) underemployed derived under the time-based approach; Group (2) underemployed derived under the ‘one standard deviation’ over-qualification approach; and Group (3) other employed (who were not distinguished as underemployed in the two aforementioned approaches).
Table 1. Demographic characteristics of various groups of employed, 2008 versus 2015.
For all three groups, the majority of underemployed were blacks. This share was clearly the lowest (just above 60%) in both years for Group (2). The white share under the over-qualification definition was significantly higher and increased from 25.91% to 29.24%. Males accounted for a significantly lower share of underemployment at approximately 40% for Group (1). This finding implies that females are more willing to work extra hours, because they are highly associated with involuntary part-time work. The gender share of underemployed was more equitable in Group (2). In Group (3), the female share was significantly lower (41.31 and 42.88%) than the male share in both years when compared with Group (1).
The majority of employed in all three groups were aged 24 to 44 years at the time of the surveys, and there was no significant difference in the mean age across the few groups, except that the 15 to 24 age cohort’s share was significantly higher for Group (1) versus Group (2). Across both underemployment definitions, the majority of the underemployed resided in Gauteng, Kwa-Zulu Natal and Western Cape. The people in Group (2) were significantly more educated (14 years on average), compared with 8.5 years for Group (1).
presents the work characteristics of the three groups. On average, Group (1) only worked approximately 20 hours per week, but the mean work hours were significantly higher in the other groups: 42 and 45 hours for Groups (2) and (3) respectively. People in Group (1) were associated with significantly shorter tenure (mean 3.5 years), compared with the other two groups (mean 6 to 8 years).
Table 2. Work characteristics of various groups of employed, 2008 versus 2015.
The majority of underemployed in Group (1) worked in elementary occupations or were domestic workers (they accounted for about two-thirds share in total). The broad industry categories accounting for the greater share of underemployed were private households, community services and wholesale and retail trade for Group (1), and community services, financial intermediation, manufacturing and private households for Group (2).
shows that a significantly higher proportion of Group (2) worked as employees (86%), while a significantly lower proportion worked in the private sector (77 to 78%), compared with Group (1). Only about 20% of underemployed in Group (2) worked in the informal sector, but this proportion was much higher for Group (1) (73% in 2008 and 62% in 2015). These findings confirm what was found by the studies reviewed in Section 2.3; that is, the time-based underemployed were more heavily involved in informal-sector work. Finally, Group (1) was associated with inferior working conditions when compared with Group (2), because a significantly lower proportion in the former group were entitled to pension funds, paid leave, medical aid, written permanent employment and unemployment insurance fund (UIF) contributions by employers.
presents the field of study of the employed with post-Matric qualifications.Footnote6 For both Groups (1) and (2), the majority of underemployed studied in the fields of ‘education, training, development’, ‘business, commerce, management’, ‘engineering’ and ‘health care’ at universities/technikons/colleges. This finding is consistent with the 2005 Moleke study that underemployed was prevalent amongst the Economic and Management Sciences, and Humanities and Arts graduates.
Table 3. Field of study of underemployed, 2013–2015.
examines the composition of the labour force by presenting the share of underemployed, other employed and unemployed. Whilst the results are self-explanatory, a few interesting findings deserve attention: for the whites, the unemployed share was the lowest (6.90%) but the underemployed share was the highest (16.60%) compared with other race groups; for the 15 to 24 age cohort, just above half of them were unemployed but only 4.20% were underemployed; and labour force participants with bachelor degrees enjoyed the smallest unemployment likelihood (6.81%) but the greatest underemployed probability (47.17%). The last two columns of the table show the unemployment rates and underemployment rates. Both rates were higher for blacks, females and Northern Cape residents. Also, the unemployment rate decreased but the underemployment rate rose moving across the more highly-educated categories.
Table 4. Underemployment rates and unemployment rates in 2015.
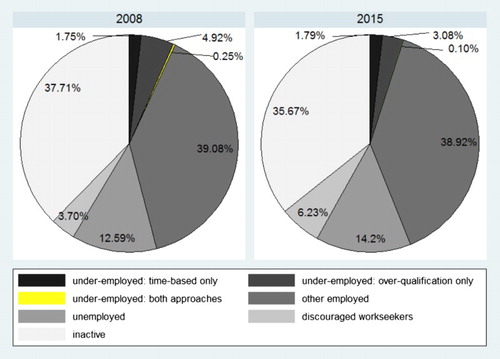
differs slightly from by showing the composition of the working-age population (i.e. discouraged workseekers and inactive are included) in 2008 and 2015, and the results were similar in both years: slightly above one-third were inactive, nearly 40% were not underemployed while 5 to 6% were underemployed.
Figure 5. Composition of working-age population, 2008 and 2015. Source: Authors’ own calculations using QLFS 2008 and 2015 fourth quarter data.
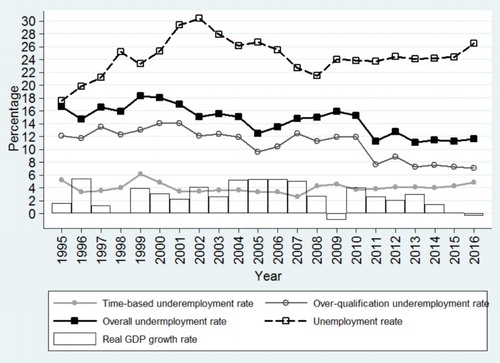
Finally, , and in Appendix 1 examine the relationship (if any) between underemployment, unemployment and real gross domestic product (GDP) growth rates, and the correlation coefficient (−0.4205) between the time-based underemployment rate and the real GDP growth rate was the strongest. This confirms the findings of Kazan (Citation2012) that underemployment likelihood was greater during recession.
Figure 6. XY scatter: time-based underemployment rates and real GDP growth rates. Source: Authors’ own calculations using OHS 1995–1999, LFS 2000–2007, QLFS 2008–2016 and South African Reserve Bank (SARB, Citation2016) data.
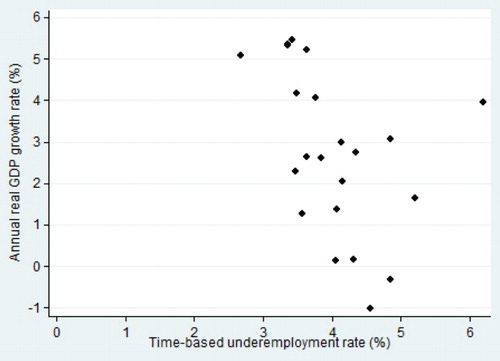
Table 5. Correlation coefficients: underemployment, unemployment and economic growth.
3.4. Econometric analysis on the likelihood of being underemployed
Probit regressions were run to estimate the marginal fixed effects of different potential influences on the likelihood of a worker being underemployed (regardless of whether the worker was distinguished as underemployed under the time-based or over-qualification approach) in 2008 and 2015. The independent variables are demographics (gender, race and age), years of work experience, province, industry categories and working in the public or private sector, formal or informal sector, or as employee or employer.
The results are presented in . Females were significantly associated with about 1% greater likelihood of being underemployed relative to their male counterparts after controlling for other differences. Controlling for race, Indians were significantly less likely to be underemployed. Their prevalence decreased by 1.5 percentage points from 6.86% in 2008 to 5.12% in 2015. Blacks were 3% significantly more likely to be underemployed whilst coloureds were nearly 3% significantly less likely to be underemployed relative to whites in 2015. There was a significant and concave relationship between age in years and underemployment probability, meaning as one got to be a middle-aged worker, there was a greater likelihood to be underemployed.
Table 6. Probit regressions on likelihood of being underemployed, 2008 and 2015.
Accounting for place of residence, in 2008 the employed residing in the Northern Cape, Free State, Mpumalanga and KwaZulu-Natal provinces were more likely to be underemployed relative to those staying in the Western Cape. The marginal fixed effect was greatest for KwaZulu-Natal. Those residing in Limpopo and Gauteng province were significantly less likely to be underemployed relative to those staying in the Western Cape. For the other provinces the results were insignificant. In 2015, only the employed staying in the Limpopo province were significantly less likely to be underemployed than those in the Western Cape province.
In both surveys, there was a significantly convex relationship between years of experience and the likelihood of underemployment. This suggests that those employed with very fewer years of experience could be reluctantly underemployed (e.g. youth), while those with longer years of experience may be the more elderly workers who work shorter hours as they are approaching retirement.
Accounting for the industry of the employed, workers in the mining, manufacturing, wholesale and retail, transport, construction, finance and community services sectors were significantly less likely to be underemployed relative to those employed in the skilled agriculture sector in 2008. In 2015, only workers in the wholesale and retail as well as private household sectors were significantly more likely to be underemployed. Finally, employees were significantly less likely to be underemployed in both years (the marginal effect was about 3%) as compared with self-employed/employers, while those working in the informal and public sectors were significantly more likely to be underemployed.
4. Conclusion
Since 1994, the South African government has made huge investments and policy changes to improve labour productivity and efficiency in the operation of the labour market. However, after two decades, the economy still shows a great slack in production and a failure to fully assimilate all available labour. Using the human capital theory as a point of reference, this study has discussed the nature, level and trends of underemployment in South Africa, as well as the relationship between underemployment, unemployment and economic growth.
The snapshot of the time-based approach shows that 3 to 6% of the employed were underemployed, whilst for the inadequate employment approach between 6 and 15% of workers are underemployed. The prevalence of underemployment was greater for individuals who were blacks, females and working in elementary occupations or private households and the informal sector. It was also found that economic recession was negatively associated with the time-based underemployment rate.
To conclude, this is the first South African study to thoroughly examine the underemployed by adopting both time-related and inadequate employment approaches. More in-depth research could still be conducted on underemployment in future, such as total income foregone due to underemployment, the econometric relationship between underemployment and the business cycle indicators, the likelihood of the underemployed being fully employed over time (this would require panel data) and possible labour market policies to deal with underemployment.
Disclosure statement
No potential conflict of interest was reported by the authors.
Additional information
Funding
Notes
1 It will be explained later that time-based underemployment could also be estimated for the 1995–2007 labour surveys.
2 The use of this one standard deviation method is being used more frequently even though arguments exist which state that measures based on occupation mode instead of mean are more likely to be desired (Wilkins & Wooden, Citation2011:25).
3 In South Africa, the information on the required educational level in each broad occupation category can be obtained from the South African Standard Classification of Occupations.
4 This discussion implies that visible underemployment and quantitative underemployment in essence are strongly associated with time-based underemployment, while invisible underemployment and qualitative underemployment are similar to underemployment according to the inadequate employment situations approach.
5 In the LFSs, the respondents could choose from one of these categories: (1) yes; (2) no; (3) don’t know. In contrast, the respondent could choose from one of these categories in the QLFSs: (1) yes, in the current job; (2) yes, in taking an additional job; (3) yes, in another job with more hours; (4) no; (5) don’t know.
6 This question has only been asked in the QLFS since the 2012 third quarter. Because the sample size of the people answering this question was small, the 2013 first quarter to 2015 fourth quarter data were appended to derive the results presented in .
References
- Altman, M, 2003. Jobless or job creating growth? Some preliminary thoughts. Proceedings of the 2003 TIPS (Trade & Industrial Policy Strategies)/DPRU (Development Policy Research Unit) Annual Forum, 8-10 September, Johannesburg.
- Altman, M, 2007. Youth labour market challenges in South Africa. HSRC (Human Sciences Research Council) Press, Cape Town.
- Altman, M, 2009. The state of youth: Labour market status and policy challenges. HSRC (Human Sciences Research Council) Press, Cape Town.
- Ansah, JW, 2012. Our jobs, our survival: A review of the national employment policy of Ghana. International Journal of Sociology and Anthropology 5(4), 107–15.
- Banerjee, A, Galiani, S, Levinsohn, J, McLaren, Z & Woolard, I, 2008. Why has unemployment risen in the New South Africa? Economics of Transition Journal 16(4), 715–40. doi: 10.1111/j.1468-0351.2008.00340.x
- Barker, F, 2007. The South African labour market: Theory and practice. 5th edn. Van Schaik Publishers, Pretoria.
- Bauer, T, 2002. Educational mismatch and wages: A panel analysis. Economics of Education Review 21(3), 221–9. doi: 10.1016/S0272-7757(01)00004-8
- Bell, DNF & Blanchflower, DG, 2013. How to measure underemployment? Peterson Institute for International Economics Working Paper Series 13-7. Peterson Institute for International Economics, Washington DC.
- Bhorat, H, 2009. Unemployment in South Africa: Descriptors and determinants. Conference proceedings, the Fourth IZA (Institute for Study of Labor)/World Bank Conference on Employment and Development, 4-5 May 2009, Bonn.
- Bhorat, H, 2012. A nation in search of jobs: Six possible policy suggestions for employment creation in South Africa. Development Policy Research Unit Working Paper 12/150. Development Policy Research Unit, Cape Town.
- Bonnal, M, Lira, C & Addy, SN, 2009. Underemployment and local employment dynamics: New evidence. The Review of Regional Studies 39(3), 317–35.
- Cam, S, 2014. The underemployed: Evidence from the UK labour force survey. Cardiff School of Social Sciences Working Paper Series No.152. School of Social Sciences, Cardiff.
- Clogg, CC, Sullivan, TA & Mutchler, JE, 1986. Measuring underemployment and inequality in the work force. Social Indicators Research 18(4), 375–93. doi: 10.1007/BF00300489
- Denu, B, Tekeste, A & Van der Deijl, H, 2005. Characteristics of youth unemployment, underemployment and inadequate employment in Ethiopia. Employment Strategy Papers. Employment Strategy Paper 2005/07. International Labour Organisation, Geneva.
- Felstead, A & Green, F, 2013. Skills in focus: Underutilization, overqualification and skills mismatch: patterns and trends. Joint Skills Committee, Edinburgh.
- Fleming, CM & Kler, P, 2008. I’m too clever for this job: A bivariate probit analysis on overeducation and job satisfaction in Australia. Applied Economics 40(9), 1123–38. doi: 10.1080/00036840600771254
- Glyde, GP, 1977. Under-employment: Definition and causes. Journal of Economic Issues 11(2), 245–60. doi: 10.1080/00213624.1977.11503434
- Golub, S & Hayat, F, 2014. Employment, unemployment, and underemployment in Africa. WIDER Working Paper 2014/014. World Institute for Development Economics Research (WIDER), Helsinki.
- Greenwood, MA, 1999. International definitions and prospects of underemployment statistics. Proceedings for the Seminario sobre Subempleo, 8-12 November, Bogota.
- Groot, W, 1996. The incidence of, and returns to overeducation in the UK. Applied Economics 28(10), 1345–50. doi: 10.1080/000368496327895
- Groot, W & Van den Brink, H, 2000. Skills mismatches in the Dutch labor market. International Journal of Manpower 21(8), 584–95. doi: 10.1108/01437720010379493
- Kazan, M, 2012. Underemployment: Implications for organizations. Economic Research Institute, Redmond.
- Kingdon, GG & Knight, J, 2004. Unemployment in South Africa: The nature of the beast. World Development 32(3): 391–408. doi: 10.1016/j.worlddev.2003.10.005
- Mathebula, I, 2013. The determinants of time-related underemployment in South Africa. Statistics South Africa, Pretoria.
- McGuinness, S, 2006. Over-education in the labour market. Journal of Economic Surveys 20(3), 387–418. doi: 10.1111/j.0950-0804.2006.00284.x
- McKee-Ryan, FM & Harvey, J, 2011. “I have a job, but … ” A review of underemployment. Journal of Management 37(4), 962–96. doi: 10.1177/0149206311398134
- Moleke, P, 2005. Finding work: Employment experiences of South African graduates. HSRC (Human Sciences Research Council) Press, Cape Town.
- Mosca, I & Wright, RE, 2011. Is graduate under-employment persistent? Evidence from the United Kingdom. The Institute for the Study of Labour (IZA) Discussion Paper Series No. 6177. Bonn, Institute for the Study of Labour.
- OECD (Organization for Economic Cooperation and Development), 2014. Preventing unemployment and underemployment from becoming structural. Unpublished report prepared for the G20 Labour and Employment Ministerial Meeting, 10-11 September, Melbourne.
- Reynolds, L, 2012. The incidence and persistence of youth underemployment: The Canadian context. Public Policy and Governance Review 4(1), 5–18.
- Ruiz-Ouintanilla, SA & Claes, R, 1994. Determinants of underemployment during the early career: A longitudinal multi-country study: Centre for Advanced Human Resource Studies (CAHRS) Working Paper 94-06. Centre for Advanced Human Resource Studies, Ithaca.
- Schoeman, CH, Botha, I & Blaauw, PF, 2010. Labour conflict and the persistence of macro underemployment in South Africa. South African Journal of Economic and Management Sciences 13(3), 272–92.
- Sengenberger, W, 2011. Beyond the measurement of unemployment and underemployment: The case for extending and amending labour market statistic. International Labour Organisation, Geneva.
- Slack, T & Jensen, L, 2002. Race, ethnicity, and underemployment in nonmetropolitan America: A 30-year profile. Journal of Rural Sociology 67(2), 208–33. doi: 10.1111/j.1549-0831.2002.tb00101.x
- SARB (South African Reserve Bank), 2016. Online statistical query. [Online]. http://www.resbank.co.za/Publications/QuarterlyBulletins/Pages/QBOnlinestatsquery.aspx Accessed 24 August 2016.
- Stats SA (Statistics South Africa), 2008. South African Standard Classification of Occupations (SASCO). Statistics South Africa, Pretoria.
- Tam, H, 2010. Characteristics of the underemployed and the overemployed in the UK. Economic and Labour Market Review 4(7), 8–20. doi: 10.1057/elmr.2010.92
- Walling, A & Clancy, G, 2010. Underemployment in the UK labour market. Economic and Labour Market Review 4(2), 16–24. doi: 10.1057/elmr.2010.21
- Wilkens, R, 2006. Personal and job characteristics associated with underemployment. Australian Journal of Labour Economics 9(4), 371–393.
- Wilkins, R & Wooden, M, 2011. Economic approaches to studying underemployment. In Feldman, D & Maynard, D (Eds.), Underemployment: Psychological economic and social challenges. Springer, New York, pages 13–34.
- Yu, D, 2009. The comparability of Labour Force Survey (LFS) and Quarterly Labour Force Survey (QLFS). Stellenbosch Economic Working Papers 08/09. Stellenbosch University, Stellenbosch.
Appendix 1
Figure A1. Mean years of education of the employed in all race groups, 1995–2016. Source: Authors’ own calculations using OHS 1995–1999, LFS 2000–2007 September, QLFS 2008–2015 fourth quarter and QLFS 2016 second quarter data.
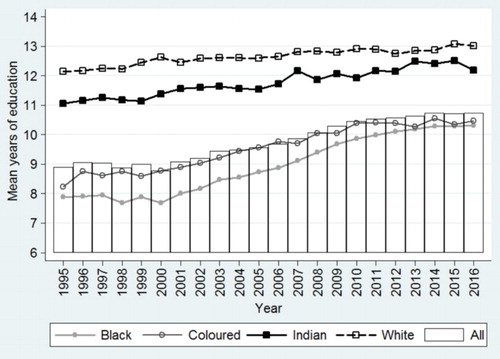
Figure A2. Underemployment derived from the over-qualification approach (years of education exceed the required level of education in the relevant broad occupation category), 1995–2016. Source: Authors’ own calculations using OHS 1995–1999, LFS 2000–2007 and QLFS 2008–2016 data.
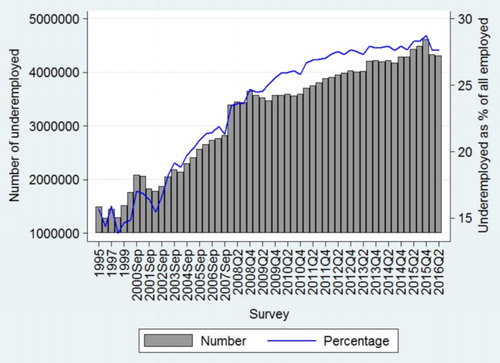
Figure A3. Underemployment, unemployment and real GDP growth rates, 1995–2016. Source: Authors’ own calculations using OHS 1995–1999, LFS 2000–2007, QLFS 2008–2016 and SARB data.