
ABSTRACT
This paper investigates the relationship between housing as an asset and the accumulation of other assets. Using data from a longitudinal research project stretching over nearly 25 years, we have found that besides actual income, there have also been improvements in self-perceived wealth ranking, asset holding, housing size, infrastructure access and human capital. Not all households have however benefited or been found to be better off. We have found that those households who had settled in Freedom Square after 1994 were indeed better off than the earlier settlers. Asset building is a slow process, one driven by stability (accessing urban land and secure tenure), finding an address, accessing education and finding work or remaining employed (though not necessarily in this particular sequence). Contrary to what the Department of Human Settlements suggests, we have found little evidence that informal settlement dwellers build assets by means of the secondary housing market.
1. Introduction
By the early 1970s, upgrading informal settlements had become conventional wisdom. Before this date, institutionalised self-help had been practised, but only selectively. Turner’s (Citation1976) work and that of the World Bank were instrumental in mainstreaming informal settlement upgrading worldwide. The developing world, however, has not always seen informal settlement upgrading or housing provision as an anti-poverty strategy (Dani & Moser, Citation2008). By the mid-1990s, asset-based welfare had become a prominent feature in the linking of housing, asset building and welfare, especially in the US. This followed the initial work on capabilities by Sen (Citation1993) and the application of the sustainable livelihoods approach in rural development. Moser (Citation2006:5) defines assets as ‘a stock of financial, human, natural or social resources that can be acquired, developed, improved and transferred across generations’, and notes that this stock ‘generates flows or consumption, as well as additional stock’. By the mid-2000s, asset-based approaches had also found their way into urban research in the developing world (Rakodi & Lloyd-Jones, Citation2002). At the same time, poverty research was increasingly taking account of housing and household assets and self-assessed (or ‘self-perceived’) wealth ranking in addition to income. To date, however, very few studies have attempted to clarify the role of informal settlement upgrading in poverty alleviation. And we lack longitudinal studies and panel surveys of informal settlement upgrading (see Moser & Felton, Citation2007, as an exception).
The study traces the extent to which informal settlement upgrading has helped to alleviate poverty in Freedom Square informal settlement in Mangaung (the municipality that includes Bloemfontein). The research is innovative in two ways: in providing findings about a single settlement that is supposed to have benefited from informal settlement upgrading over more than two decades and in using the self-assessment method through a structured questionnaire survey to collect data on self-perceived wealth, household assets, financial assets, housing and infrastructure assets, income and human capital. Based on the evidence of self-assessed wealth ranking of household assets, financial assets, income, human capital and access to infrastructure, we have found some increase in the levels of wealth of some of the households. More importantly, we have found second-generation households (who had settled in Freedom Square after 1994) to be substantially better off than first-generation households (who had settled here between 1990 – the year in which the settlement was established – and 1994). We do not wish to create the impression that either access to land or ownership is solely responsible for changes in asset generation or indeed that there is a sequential rule of asset generation. For example, while we acknowledge the role of substantial economic growth between 2000 and 2008 in terms of creating household assets, we nonetheless argue that the stability created by means of ownership and the informal settlement upgrading project, coupled with a fairly good location in respect of the regional economy, played equally important roles. Added to this, much of the work on the relationship between housing, employment, wealth and the economy is based on various assumptions. Though this research represents an attempt to better understand this nexus, we do not claim to have simple, universal answers to these interrelationships.
2. The literature
2.1. Informal settlement upgrading
In the 1970s and 1980s, sites and services became a prominent response to the need to upgrade informal settlements (Skinner & Rodell, Citation1983; Skinner et al., Citation1987) and Turner’s work was instrumental in this regard (Turner, Citation1976). Turner’s work in Latin America emphasised self-help and dweller control in housing processes, but informal settlement upgrading and self-help were already being practised in many parts of the world before the 1970s (Harris, Citation1998). In their support for informal settlement upgrading in the early 1970s, the World Bank used sites and services as a means of reducing the role of governments in housing delivery (World Bank, Citation1993). Households themselves were to be responsible for constructing their houses and loans were provided by the state or the World Bank only for infrastructure. By the early 1990s, the World Bank had refined its policy proposals and emphasised in situ upgrading and sustainability, and whole-sector development (World Bank, Citation1993).
The available literature entertains issues pertaining to informal settlement upgrading and poverty alleviation (Hammock et al., Citation1981; Keare, Citation1983; Klaasen & Van Pelt, Citation1987), but the connection between the two was debated largely along politico-economic lines. A recent systematic review assessing the potential benefits of slum upgrading strategies concludes that it is impossible to draw ‘firm conclusions on the effect of slum upgrading strategies on health and socio-economic wellbeing’ (Turley et al., Citation2013:2).
2.2. Asset generation
The concept of asset-based development is rooted in Sen’s work on capabilities and freedoms (Sen, Citation2000). In practice, Sen’s work was used in the sustainable livelihoods approach (mostly applied in rural contexts) and asset-based welfare (mostly applied in urban contexts). The guiding principle of asset-based welfare is that consumption mechanisms (providing cash welfare transfers) are unlikely to take people out of poverty. The logical conclusion is that welfare should support the creation of assets that could help people escape from poverty. It has been argued that creating assets might provide pathways out of poverty (Sherraden, Citation1991), and further that assets create agency (Dietz & Haurin, Citation2003). In the US, where asset-based welfare is well established, the emphasis is on homeownership, education and savings, and, more importantly, on how these are linked.
In the Global South, the sustainable livelihoods approach was originally applied in rural settings (Dani & Moser, Citation2008). It was not long, however, before asset-based approaches (closely related to the sustainable livelihoods approach) were also being applied in urban settings (Rakodi & Lloyd-Jones, Citation2002). The asset-building approach to dealing with poverty changed from simple poverty alleviation to ‘a broader mandate, incorporating risk prevention and mitigating factors as well as the perennially necessary safety nets’ (Moser, Citation2006:43). Assets may usefully be discussed in terms of the five ‘capitals’ – human, financial, social, physical and natural. ‘Human capital’ is people’s education, health, skills and ability to work, ‘financial capital’ is savings and access to credit, ‘social capital’, usually intangible, is the rules and norms associated with social relations, social structures and organised activities, ‘physical capital’ is equipment and infrastructure, which could include housing, and ‘natural capital’ is the environment, including land.
In recent years, attention has turned to the role of housing in poverty alleviation (Boonyabancha, Citation2008). Eight points are relevant here. First, housing (in our case, informal settlement upgrading) creates stability (Lemanski, Citation2011). The energy that is commonly expended in the process of acquiring a legitimate space in urban areas could either be used to find work, to engage in self-employment or to improve education levels (Moser, Citation2006). Urban access and secure tenure are paramount in this process (Boonyabancha et al., Citation2012). Second, housing can contribute to well-being (both physical and mental) (Moser, Citation2006). Good health in turn ensures better labour-market participation. Third, a business can be run from a house or a room can be rented out for income (Ford Foundation, Citation2006). Fourth, housing assets (and other assets) may have psychological benefits, creating a sense of safety, control and freedom (Dietz & Haurin, Citation2003). And owning assets (including housing) may help to reduce risky behaviour and encourage long-term planning (Ford Foundation, Citation2006). Fifth, housing can lead to asset building via a series of steps (Dani & Moser, Citation2008), the first of which is substantial investment in housing. Though this initial investment may have little direct effect on poverty, it provides a platform for investing in human capital and other assets. Other steps could include finding employment, improving levels of education or accumulating household assets but these need not follow a strict sequential process. Sixth, asset building has substantial intergenerational value (Moser & Felton, Citation2007). Children whose parents had to struggle to find a place in the city are generally better off than their parents and the stability of a legitimate stand or house gives them access to education (human capital), and thus to employment. Seventh, slow processes of asset accumulation are the norm and rapid acquisition of assets is the exception (Moser & Felton, Citation2007). And finally, asset accumulation should not always be seen in financial and economic terms. Many asset-accumulation processes could well be associated with legitimate access, social networks and human capital. It is therefore not always appropriate to view asset building as connected with homeownership, developing a secondary housing market and taxation systems (Solimano, Citation2006).
Asset-building or asset-accumulation strategies have been subjected to a fair amount of criticism that is mostly levelled at the neo-liberal tendencies apparent in some of these strategies. Some of the supposed gains associated with extending homeownership in the US have been questioned (Clarke, Citation2013). Claims regarding the psychological value of asset building have likewise been criticised for, among others, lacking theoretical depth (Dietz & Haurin, Citation2003). Most criticism has been levelled at asset-building policies in the Global South. These have often been operationalised by means of extensive land-titling programmes. In this respect, De Soto’s promotion of land titling has been severely criticised (Gilbert, Citation2002b). The main criticism was against the emphasis on a single mechanism, such as land titling or ownership, to reduce poverty. Despite criticism being levelled at titling programmes as a ‘silver bullet’ to create property wealth and take people out of poverty, there is, according to Lemanski (Citation2011:62), ‘widespread agreement that legal property ownership or tenure security in some form is vital for socio-economic empowerment’.
3. Background
3.1. South African informal settlements, housing policy and poverty alleviation
The development of a post-apartheid housing policy can be traced back to the Urban Foundation, an NGO (Non-Governmental Organisation) funded by the private sector, and later the Independent Development Trust (Huchzermeyer, Citation2001). The former sponsored some of the first ‘sites and services’ programmes in the mid-1980s and the latter was set up in the early 1990s by the apartheid government as a continuation of this process, to service 100 000 urban stands. Our case study area, Freedom Square, received money from the Independent Development Trust. The principle of a capital subsidy was already entrenched when, between 1992 and 1994, the National Housing Forum created a new housing policy for South Africa. Some researchers saw the new policy as a negotiated policy (Tomlinson, Citation2006); others saw it as a case of ‘scan globally, reinvent locally’ (Gilbert, Citation2002a:1), and still others emphasised the neoliberal nature of the policy and the influence of the World Bank (Huchzermeyer, Citation2001). More recently, Venter et al. (Citation2015) have emphasised the hybrid nature of the South African housing policy.
Severe criticism has been levelled at the capital subsidy programme (the main subsidy instrument since 1994) for failing to deal with informal settlement upgrading (Huchzermeyer, Citation2004; Huchzermeyer & Karam, Citation2006). In 2004, when a revised housing policy called ‘Breaking New Ground’ was released, a renewed attempt was made to call attention to the importance of informal settlement upgrading. Huchzermeyer (Citation2006) notes that the new policy on informal settlements envisaged poverty reduction through well-located land, in situ upgrading, secure tenure, the delivery of social and economic facilities, the provision of services, reduction of vulnerability and social inclusion. Breaking New Ground emphasised housing as an asset – something that provides a platform for future extension. Towards the end of the 2000s, social policy began to stress the importance of assets and, more specifically, of housing assets as an anti-poverty strategy (Cross, Citation2008). Yet this policy shows little sign of integration between housing policy and a wider range of asset-building strategies.
In essence, much of the existing research is concentrated at two poles. At the one pole it is conceptually and theoretically rich though empirically shallow, while at the other it is empirically rich but conceptually underdeveloped. A number of studies have considered asset building in respect of access to mortgage finance (Shisaka Development Management Services, Citation2011; Venter et al., Citation2015) and climbing the housing ladder (Shisaka Development Management Services, Citation2004). Very few of the households who have benefited from a housing subsidy or an informal settlement upgrading project have used their house as a financial asset in a formal market. Several researchers are consequently rather cynical about any large-scale migration up the housing ladder (Lemanski, Citation2011). In fact, some have challenged the provision of homeownership, suggesting that it might serve only to increase vulnerability in the long term. However, while informal trading also represents a form of asset generation (Gunter & Scheepers, Citation2012), the role of the South African Housing Programme as a mechanism to ensure restorative justice should also be acknowledged (Gunter, Citation2013). Given the existence of these debates, our focus is to consider asset building from a wider perspective than only titling and ownership, while, at the same time, acknowledging both the value and the limitations associated with titling.
Government policy generally emphasises the importance of titling, ownership and a market-driven approach to the property market and to asset building. For example, the programme theory of the Department of Human Settlements states that poverty will be alleviated through access to mortgage finance and climbing the housing ladder (Department of Human Settlements, Citation2014). Our research results show that although these aspects probably do contribute, a number of other factors are probably equally important.
4. Methods
Our cross-sectional surveys, cohort surveys conducted in 1993, 1998 and more recently panel surveys in 2008 and 2014, in addition to a baseline survey in 1990 (Botes et al., Citation1991), have laid the foundation for this paper. These are indicators that have been used since the early 1990s. The datasets compiled between 1990 and 2008 are from cross-sectional surveys and have been used longitudinally (Marais & Ntema, Citation2013). Up to 2008 the surveys had a narrow housing focus. The 2014 survey was a panel survey in which we conducted follow-up structured interviews with 173 of the 200 households sampled in 2008 (our paper focuses exclusively on the 173 households we did in 2008 and 2014). It also included a wider range of household and financial assets and participants’ self-assessments of their wealth or poverty at the time. Self-assessment of poverty, as a research method, is rapidly gaining acceptance not only globally (Stutzer & Frey, Citation2010) but also in South Africa (Posel, Citation2014). One of our self-assessment questions asked respondents to imagine a six-rung ‘wealth’ ladder, with the poorest people in South Africa standing on the lowest rung and the richest on the highest, the sixth. Once our respondents had given us their current rating (for 2014), we asked them to rate their household in 2008 (at the time of the financial crisis) and at the time of settling in Freedom Square (for most of our sample this was between 1990 and 1994). Some of our questions required them to recall what assets they had owned in the past. Recall is a legitimate method of research, but we acknowledge that it has its drawbacks (Moss & Goldstein, Citation1979). We therefore treat recall data as indicative rather than hardline empirical data.
Our methods differ from the usual in three ways. First, as explained above, the data were collected over a substantial period, from October 1990 to 2014. Second, because consumption-based measures of development and wealth have become increasingly important since the early 1990s (Carter & May, Citation2001), instead of using income as the main indicator of poverty we used household and financial assets and a self-assessed ranking of economic status. And third, as our original surveys (1990, 1993, 1998 and 2008) focused mainly on housing and did not ask for historical data on some of the assets or self-assessed wealth ranking, in the 2014 survey we asked respondents about their current household and financial assets and self-assessed wealth ranking and to recall these for 2008 and the date of first settling in Freedom Square.
We distinguished between first- and second-generation households. First-generation households (64%) are those who settled in Freedom Square before and during the 1992–4 upgrading and second-generation households (36%) are those who settled there from 1995 onwards. Reasons given for settling after 1995 were: being married to someone in Freedom Square (8%), inheritance (33%), having bought the house (27%), and other reasons (4%). The remaining 28% did not answer the question.
provides an overview of the factors we sought to capture, the assets we asked about, and the dates for which data are available.
Table 1. Overview of assets, data and survey procedure.
We are aware that comparing different household surveys that were designed with different purposes in mind is not an ideal way of doing this longitudinal research. We are also concerned about income data because it remains notoriously difficult to record income data correctly. We accept that some inconsistencies may indeed be attributable to difficulties in this regard. An assessment of assets and self-perceived ranking might therefore generate better results (this despite the issue pertaining to recall).
5. Results and discussion
The following is a brief history and description of Freedom Square, a settlement which developed in the early 1990s and received funds for upgrading between 1992 and 1994 (see ) (Marais & Ntema, Citation2013). The early 1990s saw large-scale influxes of people onto open land adjacent to many former black townships. It is within this context that Freedom Square developed in 1990 as an informal settlement adjacent to the former black township of Bloemfontein, Mangaung (Botes et al., Citation1991). Between 1968 and 1990, black urbanisation was channelled away from Bloemfontein to Thaba Nchu and Botshabelo (about 55 km east of Bloemfontein) by means of decentralisation subsidies, bus subsidies and the policy of orderly urbanisation (Marais et al., Citation2016). This meant that no low-income housing opportunities were created in Bloemfontein or in the Mangaung Township between 1968 and 1990. The initial funding to Freedom Square provided ownership of a stand, water on the stand, waterborne sanitation and electricity. This meant that, for the first time since 1968, provision was made for low-income housing in Bloemfontein. In 1996, the post-apartheid government added a consolidation subsidy to the already existing subsidy that financed the site and services. This enabled the households in Freedom Square to obtain a standard 24 m2 house between 1996 and 1999.
Figure 1. Location of Freedom Square. Sources: Marais and Ntema (Citation2013).
5.1. Self-assessment of poverty
shows that the percentage of respondents who rated themselves as being on the first rung of the ladder decreases between the date when they first settled in Freedom Square (for most respondents between 1990 and 1994, when upgrading commenced, but for second-generation households this date is later) and 2008 but a substantial percentage remain on the first rung from 2008 to 2014. The percentage on the bottom third (rungs one and two) decreases between the date of first settling and 2008, but remains the same between 2008 and 2014 (28.9%). The percentage in the top third (rungs five and six) remains largely the same between the date of first settling and 2008 but decreases between 2008 and 2014 (from 9.3% to 6.9%), this probably being the result of the global financial crisis and the 2009 South African recession – both of which resulted in negative economic growth and increased unemployment (the latter having increased from 22.3% in 2007 to 25.5% in 2010). The trend in the middle (rungs three and four) is very consistent: from 54.6% at the date of first settling in Freedom Square to 61.3% in 2008 and 64.1% in 2014 (despite some growth in the middle having come from respondents whose rating dropped from rungs five and six). We see upward trends in the overall average rank of our sample, from 2.86 at the date of first settling to 3.03 in 2008 and 3.08 in 2014. We also see that the 2008 average in Freedom Square is higher than the national average for South Africa (see Posel, Citation2014). An important observation is that the first generation’s 2014 rating (2.9) is lower than the second generation’s (3.3). This finding supports findings of international literature (Moser & Felton, Citation2007).
Table 2. Perceived wealth ranking in Freedom Square at time of first settling in Freedom Square, in 2008 and in 2014.
shows the direction in which the ratings changed between the three periods. Nearly two-thirds (65.7%) of the respondents thought their economic status had either remained the same or improved since they had first settled in Freedom Square, and 71.5% thought it had remained the same or improved between 2008 and 2014. Looking at the trend (not shown in the table) since the respondents first settled in Freedom Square, we found that 38% displayed a consistent upward trend, 16.4% remained stable, 15.2% were volatile (both up and down) and 30.4% displayed a downward trend.
Table 3. Changes in perceived wealth ranking in Freedom Square.
The fact that 65.7% of our respondents thought their economic position had stayed the same or improved since settling in Freedom Square and the fact that their average perceived ranking was higher than the actual national average suggest that the upgrading of the settlement was beneficial. We do however acknowledge that this was not true of all households. Second-generation residents ranked their economic status substantially higher than the original settlers. Many of the second-generation residents were people who had ‘inherited’ their houses from their parents and probably benefited from the fact that their parents had found stability in having secure tenure in Freedom Square. Obviously, some of these second-generation households could well have been better off before settling in Freedom Square. Within this context, the spatial-economic integration of various income groups should be seen as a positive – given the original targeted nature of the subsidy (i.e. meant for households earning less than R800 a month in 1992).
5.2. Household assets
The number of assets owned by low-income households is an important indicator for understanding poverty in these households. compares the total number of household assets of the kind listed in at the three dates under consideration.
Table 4. Household assets at time of first settling in Freedom Square, in 2008 and in 2014.
We see a substantial decline in the percentage of households with no assets or only one. On first settling in Freedom Square, 64.1% of the households had zero or one asset. By 2008 this percentage had dropped to 35.2% and by 2014 to 21.3%. There was a consequent increase in the percentage of households with two or three assets so that by 2014, 62.4% of households had two or three assets. This represents an increase since 2008 when the figure stood at 47.4% and an even bigger increase from the date of settling in Freedom Square (28.3%). The percentage of households who had four or more assets increased from 7.5% at the time of settling in Freedom Square to 17.4% in 2008, only to drop to 16.2% by 2014. This trend of some decline in the highest asset groups corresponds to the decline from rungs five and six in the perceived wealth ranking. The trends in respect of the average number of assets are much like those observed in the responses to the questions on perceived wealth ranking. Broadly speaking, assets have increased since settlement in Freedom Square. Second-generation households tend to have more assets than first-generation households. This is very similar to the trends observed in the perceived wealth rankings.
shows the direction of changes in the number of assets. Only 13% of the households had fewer assets in 2014 than at the time of settling in Freedom Square, while nearly two-thirds (63.6%) had more. The fact that 22.5% of the households had fewer assets in 2014 than in 2008 may be largely due to the effect of the global financial crisis and the South African recession. This might well have resulted in people losing their jobs and having had to sell off some assets.
Table 5. Changes in total number of household assets in Freedom Square.
The household asset data to some extent confirm the trends we observed in the perceived wealth ranking. There is an increase in household assets and second-generation households have more assets than first-generation households.
5.3. Financial assets
provides an overview of access to financial assets in Freedom Square. We can see that this access has increased since the respondents first built a shack on a stand or obtained a house in Freedom Square. Households with no or one asset decrease from 88.4% of the sample from the date of first settling to 59.5% in 2008 and 49.2% in 2014. Those with no financial assets at all show the sharpest decrease: from 68.2% at the date of first settling to 38.7% in 2008 and 24.3% in 2014. In contrast to our findings for perceived wealth ranking and household assets, we see a steady growth in the percentage with the most financial assets (more than four) between 2008 and 2014. As with household assets, the number of households who have fewer financial assets in 2014 than at the date of settling is very small at 5.2%. Nearly two-thirds of the respondents were better off in terms of financial assets than they had been when they first settled in Freedom Square. There is a small but statistically insignificant correlation between household assets and financial assets. This finding suggests that improved access to financial assets does not necessarily lead to increased number of household assets.
Table 6. Households’ access to financial assets at time of first settling in Freedom Square, in 2008 and in 2014.
Security in the form of a house is essential for accessing the financial assets listed in . A major reason for the increase in access to financial assets is the fact that the upgrading provided our respondents with an address. This leads us to wonder whether increased access to financial assets also increased the percentage of households in debt.
5.4. Housing assets
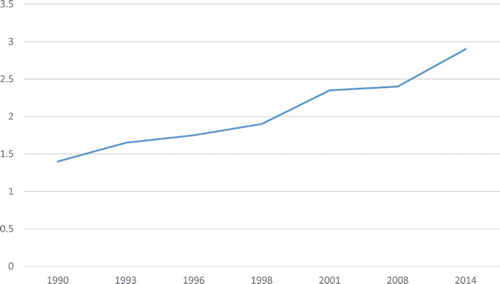
The 1992–4 upgrading, as noted earlier, gave Freedom Square residents a stand, water on the stand, waterborne sanitation and a small, two-room house. shows how the houses increased in size from 1990 to 2014. The increases between 1990 and 1996 are attributable to the owner investments, those between 1996 and 1999 to the government housing subsidy, and those since that date again to owner investments. The substantial increases in the size of the houses since 2008 come as something of a surprise. Nearly one in four respondents said at least one room had been added to their house since 2008, with the result that the percentage of houses with two rooms (as provided by government) decreased from 82.7% to 65.3% and those with four or more rooms increased from 14.4% to 26.1%. A stand and a two-room house that households expanded incrementally over time created a platform for the accumulation of assets. Interestingly enough, we see virtually no difference in house size increase between the first and the second generation, either in terms of the increase since 2008 or the existing housing size in 2014.
Figure 2. Increase in average house size in Freedom Square, 1990–2014. Sources: Botes et al. (Citation1991), Marais and Ntema (Citation2013), Marais et al. (Citation2014) panel survey.
As also noted above, a house can be used to generate income by running a business from it or letting rooms. From 2008 there was a noticeable increase in houses being used for the former purpose: 3.5% of our respondents said they were running a business from their house in 2008; in 2014 the figure was 9%. Letting a room, however, apparently decreased, dropping from 1.5% in 2008 to 0% in 2014. We discovered (from an open question about why they settled in Freedom Square) that 1.2% of our respondents were themselves renting someone else’s house in 2014, but we did not find any evidence of this in the 2008 survey data.
We also noted other forms of asset building related to housing and how these had changed over the years. In 2014, 22% of our respondents had a flower garden (up from 12.1% in 2008), 72.3% had trees (down from 82.1% in 2008), 17.9% had vegetable gardens (down from 19.1% in 2008), 24.3% had lawns (down from 26.6% in 2008) and 54.9% had burglar proofing (up from 38.7% in 2008). The increased use of burglar proofing is unfortunately indicative of South Africa’s growing crime problem, but it cannot be denied that it has a bearing on the accrual of household assets and also of increasing individualisation.
The fact that there is no marked difference in size between the houses of first- and second-generation respondents shows that the platform created by housing has been even more beneficial to the latter than the former. Effectively, the second-generation settlers have not had to face the housing struggles that confronted the original settlers (for example building their own housing units) and have thus been able to focus on other forms of asset building.
5.5. Infrastructure assets
Infrastructure provision, which is commonly associated with informal settlement upgrading, is important for health. Recent research has shown that the two most important ways to improve the health of informal settlement dwellers are shortening the distance to the water source (the farther the distance, the more negative the health indicators) and ensuring that households do not have to share a toilet with other households (Marais & Cloete, Citation2014). As already noted, the area was invaded in the early 1990s and the original settlers had no water, sanitation or electricity. With these facilities having been provided in the upgrading, today water is available at least on the stand if not in the house, and households do not have to share toilet facilities. The 2014 survey showed that 100% of our respondents had electricity, water and waterborne sanitation on the stand. But progress in incorporating water and a toilet into the houses has been slow: in 2014 the percentage of houses with water piped into the house had increased from 4.6% in 2008 to 9.8%, and 7.5% had an indoor toilet (up from 4.1% in 2008 and 0% in 1998).
Although our data do not show any direct relationship between infrastructure and health, the international and national literature make the link clear (see Turley et al., Citation2013). The international literature moreover shows that improved health ensures that low-income people are able to sell their labour more often (Moser, Citation2006).
5.6. Income and employment
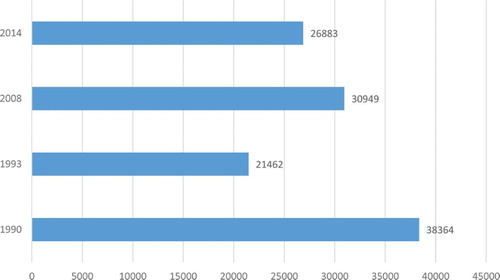
Income and employment indicators are important data in researching asset-building strategies. We were able to trace some income categories back to the early years of Freedom Square’s existence, for example comparing household income means since 1990, as shown in . It is obvious that the households in our sample were not better off in 2014 than in 1990 but, as we noted earlier, this could well have been attributable to methodological concerns associated with income. The global financial crisis and South African recession made some inroads into average income after 2008 – most likely as a result of increased unemployment. Of our sample of 173, only 10 experienced a considerable decline in household income. An important observation is the difference between first and second generations’ average annual household income: respectively 22 239 ZAR and 34 598 ZAR. We found a statistically significant correlation between the two, at 0.01, which once again shows that second-generation households are better off than first-generation households.
Figure 3. Average annual income per respondent in Freedom Square, 1990, 1993, 2008 and 2014.
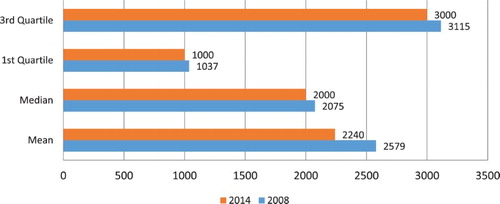
We compared a range of other indicators to see whether inequality had increased in Freedom Square between 2008 and 2014 (see ). In particular, we wanted to see whether there was a substantial increase in the amount indicating the top end of the 1st quartile, the amount indicating the top end of the 3rd quartile and the mean. Except for the mean, which had shrunk by a little more than 10%, the other indicators were largely the same. These results show little indication of increased income inequality in this settlement between 2008 and 2014.
Figure 4. Cut-off amounts for quartiles, medians and means in Freedom Square, 2008 and 2014.
5.7. Human capital development
To see whether human capital, as reflected in educational status, had improved in our sample, we once again compared the first and second generations. shows that the profile had improved since 1990 and that the second generation had done better than the first. For example, in 2014, 32% of second-generation respondents had a Grade 12 certificate but only 11% of the first generation had achieved this. As already noted, the second generation also had a higher perceived wealth ranking, more household and financial assets and were earning higher incomes.
Table 7. Changes in educational status from 1990 to 2014.
5.8. Housing as a financial asset
House trading to make a profit is central to asset-building theory although it has been criticised in the literature as being too dominant (Gilbert, Citation2002b). Profits that are made by selling one house could help to finance the next. It has already been noted that 27% of second-generation households said they had bought their house. This means that just under 10% of the houses had been traded in some form on the housing market. While other research has shown that most of these transactions were informal (Marais et al., Citation2014), Gunter and Scheepers (Citation2012) suggest that they also represent a form of asset building. It could well be that a small percentage of second-generation households were working-class people looking for cheap accommodation, which they were able to find in Freedom Square. Unfortunately, we have limited information on what happened to the original owners of the houses.
6. Conclusion
This paper fills a gap in the literature by assessing poverty levels in Freedom Square, an upgraded informal settlement in South Africa, over a period of nearly 25 years. Our evidence on many of the indicators shows that the households were generally the same or better off in 2014 than when they had originally settled there (see summary in ). This trend is however not applicable to all households and the income data suggest that incomes have probably declined over the period. The decline in reported incomes strikes us as strange and can probably be related to difficulties associated with recording accurate incomes. This once again emphasises the importance of non-monetary indicators such as assets and self-perceived ranking in studying poverty. The non-monetary indicators largely suggest improvements in asset holding in Freedom Square – many of which, in our opinion, are related to informal settlement upgrading. We however concede that substantial economic growth over the period could also have contributed to asset growth.
Table 8. Summary of the main findings pertaining to whether households are better off in Freedom Square.
The development of Freedom Square has served to provide those originally excluded from urban South Africa, namely poor households, with access to schools, better housing and better infrastructure. Being able to access a stand provided stability and coupled with economic growth over nearly 15 years, laid the foundation for asset accumulation. Although household incomes have grown only marginally (if at all), household assets, financial assets, and self-assessed wealth ranking have shown a growth trend since the settlement was established in 1990.
More importantly, the findings indicate that the second generation are better off than the first generation, the original settlers, in respect of income, household assets, financial assets, and self-assessed wealth ranking. We argue that this is partly because the first generation’s struggle to gain a place in the city and a house enabled the second generation to shift their focus from these basic aims to obtaining education, finding work and accumulating household assets. This conclusion is supported by the fact that there is virtually no difference between first- and second-generation households as regards housing size. Furthermore, this could well be the result of second-generation households having been better off when they settled there and not necessarily the result of upgrading. There are however two important considerations. The initial focus was on assisting poor households. The fact that these second-generation households are substantially better off represents a form of spatial-economic integration. Secondly, for those who inherited a house, the basis of having a house means that their energy and efforts could be applied differently. Our findings are in alignment with the literature.
Our results show that asset building takes place differently from what is envisaged in the South African housing policy called ‘Breaking New Ground’. It is a slow process, driven by accessing urban land, finding an address, obtaining an education and obtaining employment (though not necessarily in this sequence). Asset building takes place through the creation of stability (secure tenure and finding a house), better access to education and finding employment and is largely unrelated to processes in the secondary housing market or finding a mortgage. We have found little evidence of market-based asset building by the second-generation residents. Our estimate is that about 10% of the households fall in this category and that asset building among them is mainly informal. The question thus is whether the third and fourth generation will indeed be more market oriented. Having said this, we should acknowledge that there are problems with the legitimacy of the deeds register for Freedom Square and that very few of the second-generation houses that were ‘bought’ have to date been registered at the deeds office.
Although household incomes were on average smaller in 2014 than they were in 1990, overall, it is evident that the upgrading of Freedom Square has helped to alleviate poverty. When we look at the lists of household goods produced by our sample, their financial assets, their housing assets, their level of education and their perceived level of wealth, it is clear that most households in Freedom Square, particularly the second generation, are better off now than when they first settled there.
Much has been written about the importance of informal settlement upgrading in poverty alleviation. Often, the relationships are conceptual. This paper helps in understanding these relations. But we would acknowledge that our paper does not provide clear processes and mechanisms that are at play.
Finally, the question is what the methodological lessons are that one can learn from this research. In our view, obtaining reliable income data remains a major problem. We are of the opinion that the data on self-ranking and assets portray a much better picture of the reality. While future studies should either invest more effort into obtaining reliable income data or focus on expenditure, the notion of self-ranking and asset recording could well continue to play an important role in terms of better understanding poverty, asset generation and the role of informal settlement upgrading.
Disclosure statement
No potential conflict of interest was reported by the authors.
Additional information
Funding
References
- Boonyabancha, S, 2008. Upgrading Thailand’s urban settlements: A community driven process of social development. In Moser, C & Dani, A (Eds.), Assets, livelihoods and social policy. World Bank, Washington, pp. 195–214.
- Boonyabancha, S, Carcellar, F & Kerr, T, 2012. How poor communities are paving their own pathways to freedom. Environment and Urbanization 24(2), 446–61.
- Botes, L, Krige, S & Wessels, J, 1991. Informal settlements in Bloemfontein: A study of migration patterns, socio-economic profile, living conditions and future housing expectations. Urban Foundation, Bloemfontein.
- Carter, M & May, J, 2001. One kind of freedom: Poverty dynamics in post-apartheid South Africa. World Development 29(12), 1987–2006. doi: 10.1016/S0305-750X(01)00089-4
- Clarke, W, 2013. The aftermath of the general financial crisis for the ownership society: What happened to low-income homeowners in the US? International Journal of Housing Policy 13(3), 227–46. doi: 10.1080/14616718.2013.796811
- Cross, C, 2008. Housing delivery as anti-poverty: Is South Africa on the right track? Paper presented at Southern African Housing Foundation international conference and exhibition, Cape Town, 12–15 October.
- Dani, A & Moser, C, 2008. Asset-based social policy and public action in a polycentric world. In Moser, C & Dani, A (Eds.), Assets, livelihoods and social policy. World Bank, Washington, DC, pp. 3–41.
- Department of Human Settlements, 2014. Housing programme theory. Department of Human Settlements, Pretoria.
- Dietz, R & Haurin, D, 2003. The social and private micro-level consequences of homeownership. Journal of Urban Economics 54(3), 401–50. doi: 10.1016/S0094-1190(03)00080-9
- Ford Foundation, 2006. Building assets to reduce poverty and injustice. Ford Foundation, New York.
- Gilbert, A, 2002a. Scan globally, reinvent Locally: Reflecting on the Origins of South Africa’s Capital Housing Subsidy Programme. Urban Studies 39, 1911–33. doi: 10.1080/0042098022000003028
- Gilbert, A, 2002b. On the mystery of capital and the myths of Hernando De Soto: What difference does legal title make? International Development Planning Review 24(1), 1–19. doi: 10.3828/idpr.24.1.1
- Gunter, A, 2013. Creating co-sovereigns through the provision of low cost housing: The case of Johannesburg, South Africa. Habitat International 39, 278–283.
- Gunter, A & Scheepers, L, 2012. “Crisylida capital”: Hatching informal township property markets to benefit Low-income residents in Johannesburg, South Africa. Urban Forum 23, 165–80. doi: 10.1007/s12132-011-9136-7
- Hammock, J, Lubell, H, Sethuraman, S & Rafsky, W, 1981. Low-income settlement improvement through income and employment generation and integrated housing programmes. In United nations centre for human settlements (HABITAT), The residential circumstances of the urban poor in developing countries. Praeger, New York, pp. 257–74.
- Harris, R, 1998. The silence of the experts: Aided self-help housing, 1939–1954. Habitat International 22(2), 165–89. doi: 10.1016/S0197-3975(97)00038-6
- Huchzermeyer, M, 2001. Housing for the poor? negotiated housing policy in South Africa. Habitat International 25, 303–31. doi: 10.1016/S0197-3975(00)00037-0
- Huchzermeyer, M, 2004. Unlawful occupation: Informal settlements and urban policy in South Africa and Brazil. Africa World Press, Trenton, NJ.
- Huchzermeyer, M, 2006. The new instrument for upgrading informal settlements in South Africa: contributions and constraints. In Huchzermeyer, M & Karam, A (Eds.), Informal settlements: A perpetual challenge. University of Cape Town Press, Cape Town, pp. 41–61.
- Huchzermeyer, M & Karam, A. 2006. Informal settlements: A perpetual challenge. University of Cape Town Press, Cape Town.
- Keare, D. 1983. Assessing project impacts. In Yeung, YM (Ed.), A place to live: More effective low-cost housing in Asia. International Development Research Centre, Ottawa, pp. 157–70.
- Klaasen, LHJ & Van Pelt, M, 1987. Economic impact and implications of shelter investments. In Rodwin, L (Ed.), Shelter, settlement and development. Allen & Unwin, Boston, pp. 35–59.
- Lemanski, C, 2011. Moving up the ladder or stuck on the bottom rung? homeownership as a solution to poverty in urban South Africa. International Journal of Urban and Regional Research 35(1), 57–77. doi: 10.1111/j.1468-2427.2010.00945.x
- Marais, L & Cloete, J, 2014. Dying to get a house? The health outcomes of the South African low-income housing programme. Habitat International 43(1), 48–60. doi: 10.1016/j.habitatint.2014.01.015
- Marais, L & Ntema, J, 2013. The upgrading of an informal settlement in South Africa: Two decades onwards. Habitat International 39, 85–95. doi: 10.1016/j.habitatint.2012.11.001
- Marais, L, Ntema, L, Cloete, J & Venter, A, 2014. From informality to formality to informality: Extralegal land transfers in an upgraded informal settlement of South Africa. Urbani Izziv 25(Supplement), S148–S61. doi: 10.5379/urbani-izziv-en-2014-25-supplement-011
- Marais, L, Ntema, L, Rani, K, Lenka, M & Cloete, J, 2016. Reinforcing housing assets in the wrong location? The case of Botshabelo, South Africa. Urban Forum 27(3), 347–62. doi: 10.1007/s12132-016-9276-x
- Moser, C, 2006. Asset-based approaches to poverty reduction in a globalized world. Brookings Institute, Washington, DC.
- Moser, C & Felton, A, 2007. Intergenerational asset accumulation and poverty reduction in Guayaquil, Ecuador 1974–2004. In Moser, C (Ed.), Reducing global poverty: The case for asset accumulation. Brookings Institution Press, Washington, DC, pp. 18–34.
- Moss, L & Goldstein, H, 1979. The recall method in social surveys. London: University of London Institute of Education.
- Posel, D, 2014. Self-assessed well-being and economic rank in South Africa. Development Southern Africa 31(1), 51–64. doi: 10.1080/0376835X.2013.851020
- Rakodi, C & Lloyd-Jones, T, 2002. Urban livelihoods: A people-centred approach to reducing poverty. Earthscan, London.
- Sen, A, 1993. Capabilities and well-being. In Nussbaum, M & Sen, A (Eds.), The quality of life. Clarendon, Oxford, pp. 30–53.
- Sen, A, 2000. Development as freedoms. Oxford University Press, Oxford.
- Sherraden, M, 1991. Assets and the poor: A new American welfare policy. M.E. Sharpe, New York.
- Shisaka Development Management Services, 2004. Workings of township residential property markets study: Phase 3 – findings, conclusions and implications – final report. FinMark Trust, Midrand.
- Shisaka Development Management Services, 2011. Housing subsidy assets: Exploring the performance of government subsidised housing in South Africa. FinMark Trust, Johannesburg.
- Skinner, RJ & Rodell, MJ (Eds.) 1983. People, poverty and shelter: Problems of self-help housing in the third world. Methuen, London.
- Skinner, R, Taylor, J & Wegelin, E (Eds.) 1987. Shelter upgrading for the poor: Evaluation of third world experience. Island Publishing House, Manila.
- Solimano, A. 2006. Asset accumulation by the middle class and poor in Latin America: Political economy and governance dimensions. United Nations, Economic Development Division, Santiago.
- Stutzer, A & Frey, B, 2010. Recent advances in the economics of individual subjective wellbeing. Social Research 77(2), 679–714.
- Tomlinson, M, 2006. From ‘quantity’ to ‘quality’: Restructuring South Africa’s housing policy ten years after. International Development Planning Review 28(1), 85–104. doi: 10.3828/idpr.28.1.4
- Turley, R, Saith, R, Bhan, N, Rehfuess, E & Carter, B, 2013. Slum upgrading strategies involving physical environment and infrastructure interventions and their effects on health and socio-economic outcomes. Cochrane Database of Systematic Review 1(CD010067). doi: 10.1002/14651858.CD010067.pub2
- Turner, J. 1976. Housing by people: towards autonomy in building environments. Marion Byers, London.
- Venter, A, Marais, L, Hoekstra, J & Cloete, J, 2015. Reinterpreting South African housing policy through welfare state theory. Housing, Theory and Society 32(3), 346–66. doi: 10.1080/14036096.2015.1048895
- World Bank, 1993. Housing: Enabling markets to work. World Bank, Washington, DC.