
ABSTRACT
Food policy that ignores food-away-from-home (FAFH) in a developing country like South Africa will be misleading given changes in demand for food over time. This study contributes to our understanding of the factors that influence the demand for FAFH in South Africa. Using panel data from the Income and Expenditure Survey, this study analyses the effects of income and socio-demographic variables on FAFH expenditure using a double-hurdle model. The results show that small-sized households headed by younger white females/males and living in an urban settlement are most likely to purchase FAFH while male-headed households spend more than female-headed households. Furthermore, income of the household head is an important determinant of household FAFH expenditures. The income elasticity of expenditure on FAFH is inelastic and a normal good. The small size of the participation elasticities means that growth in the FAFH sector will be driven by households with existing expenditure.
1. Introduction
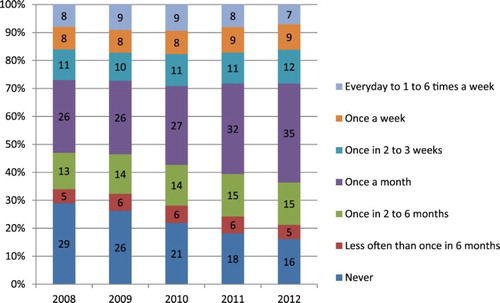
As societies globally see an increase in economic activities and longer work hours, traditional food expenditure with households preparing their own meals is expected to become less and less popular. This trend is also observed in South Africa with increasing popularity of food prepared outside the home. shows that 35% of households reportedly consumed fast food more than once per month in 2012 compared to only 26% four years earlier.
Figure 1. Frequency of fast food purchases in South Africa from 2008 to 2012. Source: Analytix Business Intelligence (Citation2013).
The theoretical argument for food-away-from-home (FAFH) is based on the classic household production theory (Becker, Citation1965; Lancaster, Citation1971) with households focusing on the efficient use of market goods, time and human capital to maximise utility. Households will trade off food-at-home (FAH) for FAFH as the opportunity cost of preparing food at home increases.Footnote1 For example, in the USA, food expenditures shares (home and away) reached the same level in 2013 despite about a 30 percentage point difference in the 1990s.Footnote2 With expenditure in FAFH increasing, traditional food demand models that do not take into consideration such changes in expenditure may be biased in estimating food demand elasticity.Footnote3
The change in the demand for FAFH is typically attributed to factors such as globalisation, urbanisation, a growing middle class and increased participation of women in the labour force. Food consumption patterns in South Africa indicate that the consumption of home cooked meals is decreasing while the consumption of fast foods is increasing. Maumbe (Citation2010) attributes this to an increase in household income, globalisation and westernisation. The FAFH industry in South Africa includes both commercial and non-commercial foodservice sectors. According to Edwards (Citation2013) the commercial foodservice sector includes restaurants (quick- and full-service establishments), taverns and pubs, lodging facilities (hotels, motels and bed and breakfasts) and recreational centres (sports clubs), while the non-commercial foodservice sector consists of schools and tertiary hostels, employee meals, hospitals and similar government establishments. The typical distinction between FAH and FAFH is based on the level of control a consumer has over the nutritional content of the food.
According to Frazão (Citation1999), consumers value the nutritional content of FAH more than FAFH, however, they are faced with the trade-off between nutrition and health benefits of FAH and convenience and health attributes of FAFH. This is important as the percentage of households getting their nutrients from FAFH increases. For instance, Americans consume approximately a third of their calorie intake via FAFH, compared to about 18% in the 1970s (Lin et al. Citation2002). Naturally, health concerns have been raised because a large body of literature supports the notion of FAFH being less healthy than FAH. Lin & Guthrie (Citation2012) showed that FAFH was higher in saturated fat and sodium, lower in dietary fibre and had a lower calcium content than FAH meals.Footnote4
As argued in several studies on FAFH in other countries (Kinsey, Citation1983; Lee & Brown, Citation1986; Lippert & Love, Citation1986; Nayga & Capps, Citation1992; Redman, Citation1980; Stewart et al., Citation2004), demand for FAFH is influenced primarily by income and demographic factors including household size, family composition, age, education, race, region and urbanisation. In general, these factors are important based on how they influence income and time at the household level. For example, the convenience factor may be important for large household size in the choice of FAFH while family composition and female labour supply may be important especially for breakfast and lunch FAFH choices. Urbanisation increases travel time and distance between home and work and can influence demand for FAFH.
Despite these studies, there is no evidence in South Africa to support these results to our knowledge.Footnote5 In addition, factors such as changes in food commodity markets, food demand, eating patterns and marketing programmes for both domestic and international restaurant businesses support the need for a local context and parameter estimates to understand the factors that influence the demand for FAFH (Min et al., Citation2004). With an improved understanding of the effect of income and socio-demographic variables on FAFH expenditure, policy makers could use these results to better understand how policies can be used to influence FAFH consumption through nutrition and health intervention programmes. Additionally, potential FAFH firms can develop appropriate marketing strategies, anticipate future trends, optimise the use of resources and recognise new business opportunities.
The purpose of this paper is to provide evidence to understand the factors that influence the observed changes in the demand for FAFH in South Africa. Food policy that ignores FAFH in a developing country like South Africa will be misleading given changes in demand for food over time. Factors such as income and other demographic variables have been shown in other countries to influence the demand for FAFH and changes in expenditure on FAFH with little evidence to show if these results hold in South Africa. This paper applies the double-hurdle model (Cragg, Citation1971) that has traditionally been used to model household consumption or labour supply decisions containing two equations to capture the correlation between the demand for FAFH and the level of expenditure that the household will spend on FAFH.Footnote6 The first hurdle determines if a consumer is a participant in the FAFH market, while the second hurdle determines the amount spent by the consumer on FAFH (Moffatt, Citation2005).Footnote7
The rest of the paper proceeds as follows. Section 2 presents a description of the theoretical framework; section 3 describes the dataset used for the empirical analysis. Section 4 presents the econometric procedure adopted in the analysis. Section 5 presents the estimation results and the paper is concluded in section 6.
2. Theoretical framework and literature review
The theory of household production (Becker, Citation1965) argues that households are both producing and utility-maximising units. This extension of classical demand theory reflects how prices, income, demographics and time constraints can influence a household’s purchase of items such as food. Furthermore, this model considers that the cost of FAH consumption includes price and time spent eating the food, preparing the food and subsequent cleaning up. Consequently, a household can allocate time to all aspects involved in consuming a meal (i.e. preparing FAH), or outsource some aspects such as preparation and cleaning up by purchasing FAFH. However, the optimal decision is subject to constraints which include the household’s finances, the opportunity cost of the household manager’s time and the cooking abilities of the household manager. Given this trade-off is based on household preference and opportunity cost, the factors that determine the degree of trade-off between FAH and FAFH is an empirical question.
Many studies such as Prochaska & Schrimper (Citation1973), McCracken & Brandt (Citation1987), Yen (Citation1993), Gould & Villarreal (Citation2006) and Bai et al. (Citation2010) found a positive relationship between income and consumption of FAFH. Higher income households typically spend more on products and services such as leisure, variety, dining facilities (for example waiters), ambience and alcohol service (Stewart et al., Citation2004). FAFH can be a type of leisure activity in which leisure is defined as the time spent outside of the labour force and household production (Stewart et al., Citation2004).
Gould & Villarreal (Citation2006) found that FAFH expenditure in urban China is positively related to income and inversely related to household size. Min et al. (Citation2004) confirm that household size is a key determinant in determining FAFH consumption in China.Footnote8 It is expected that households with more members will find preparing meals at home more economical than FAFH, which was illustrated to be true by McCracken & Brandt (Citation1987). Bulk purchases of food items can save larger households money because the per-unit cost of food is reduced with larger pack sizes. In contrast, eating at home is likely to have the highest cost, both monetary and time-wise, for single-person households (Stewart et al., Citation2004).
Traditionally, women are less likely to spend money on FAFH than males as reported in different studies (Ham et al., Citation2004; Binkley, Citation2005; Nayga & Capps, Citation1994). However, Nayga & Capps (Citation1992) demonstrate that as participation by women in the labour force increases FAFH expenditure increases. It has been suggested that there is a difference in FAFH expenditure between different population groups because of different eating habits, tastes and access to foodservice establishments (Stewart et al., Citation2004; Liu, Citation2011). Studies such as Liu (Citation2011), Binkley (Citation2005) and Bezerra et al. (Citation2013) conclude that the settlement type in which a person or household resides, is a significant determinant of FAFH expenditure.
An increasing population and movement of people into urban areas during the 1990s have caused FAFH expenditure in China to rise rapidly. Furthermore, urban population growth has been the primary driver of increased food expenditure given that per capita food expenditures have grown slowly. The change in the composition of urban food expenditures has been attributed to FAFH demand (Ma et al., Citation2006). Urban residents are likely to have higher FAFH expenditures because of their greater access to FAFH facilities (for example Prochaska & Shrimper, Citation1973; McCracken & Brandt, Citation1987; Yen, Citation1993).
Byrne et al. (Citation1998) found that age is a significant determinant of FAFH expenditure. Younger people spend comparatively more on fast food restaurants than full service restaurants, while the opposite is true for older people. It should be noted that the age factor can change with time given the potential for taste and eating habits to change over different generations. One can argue that an elderly person in year 2050 will not have the same expenditure patterns as an elderly person in 2013 (Stewart et al., Citation2004). Ma et al. (Citation2006) found that age also affects the relationship between income and FAFH demand in urban China. The expenditure elasticities for the demand for FAFH are highest for individuals over 50 (2.28), however, a decreasing trend is observed from younger people less than 20 (1.71) to older people between the ages of 36 and 50 (1.68). Additionally, they found that if the income of individuals over 50, in Spain, falls, they will most likely reduce their demand for FAFH (Angulo et al., Citation2002).
Our study differs from these studies not only by application (South Africa) but also by the size and detail in the data. Most of the studies used smaller sample size and some are only cross-sectional. Stewart et al. (Citation2004) highlight the value of a large sample size observed over time.Footnote9 Our data described in the next section are panel data with more than 20 000 households sampled in South Africa in each panel. We also applied the double-hurdle model to the data to estimate changes in FAFH demand over the two periods of 2005/6 and 2010/11.
2.1. A brief overview of the South African food-away-from-home sector
South Africa has a large number of restaurant chains which can be classified as quick- and full-service establishments. Many of the restaurant brands established in South Africa have entered the regional market by expanding into neighbouring countries such as Mozambique and Zimbabwe, while a few have entered the international marketplace primarily in the Middle East, the United Kingdom and Australia, with mixed success. Famous Brands and Spur Corporation have established themselves as the leading franchised restaurant operations in South Africa. Famous Brands consisted of 23 brands, 1881 domestic restaurants and 282 international restaurants for the financial year ending 28 February 2013, while Spur Corporation consisted of only four brands, 408 domestic restaurants and 48 international restaurants for the financial year ending 30 June 2012. Both firms are listed on the JSE (Johannesburg Stock Exchange) and have similar product offerings such as burgers, fish and pizza.Footnote10
3. Data sources
The datasets used in this study are from Statistics South Africa’s Income and Expenditure of Households Surveys (IESs) of 2005/6 and 2010/11. We used these data to estimate the effect of income and socio-demographic variables on household FAFH expenditure for South Africa. The expenditure and income values from the IESs of 2005/6 and 2010/11 were adjusted for inflation by Statistics South Africa (Statistics South Africa, Citation2008, Citation2012), and were adjusted again after appending the two datasets together; the income and expenditure values for 2010/11 were deflated.Footnote11
Post-apartheid in South Africa, the Income and Expenditure Survey is the only official source of data that tracks incomes and expenditure patterns in the country every five years starting from 1995. It is also the only nationally representative household survey conducted by Statistics South Africa that is used to measure and track changes in poverty and inequality in the country. We use the 2005/6 and the 2010/11 waves because they are comparable in the methodology used to collect the data with recall and diary method used to track incomes and expenditures. The IES of 2005/6 sampled 21 144 households, while the 2010/11 wave sampled 25 328 households (Statistics South Africa, Citation2008, Citation2012). In total 46 407 observations were used to estimate the dependent double-hurdle model.Footnote12
4. Econometric procedure
To understand the factors that determine the trade-offs between health benefits and convenience as reflected in the choice of FAH and FAFH, we model the expenditure of households for FAFH using data on annual FAFH expenditure by households in the country. The model estimates the factors that determine FAFH in South Africa using the lognormal annual household FAFH expenditure (in 2005/6 Rand) as the expenditure variable. Similar to previous studies described in the literature review section, we investigate the role that income (lognormal annual household income (in 2005/6 Rand)); gender (gender dummy of the household head (0 = male and 1 = female)); race (population group of the household head (1 = African/black, 2 = coloured, 3 = Indian/Asian and 4 = white)); and other demographic variables such as age of the household head, household size and settlement type (Rural or Urban) play in the choice and amount spent on FAFH.Footnote13 Previous studies such as Angulo et al. (Citation2002) indicate that females are less likely to choose FAFH than males. The base categories used in the regressions include male for the gender of the household head dummy variable, African/black for the population group of the household head categorical variable, Urban for the settlement type dummy variable and the 2005/6 IES survey period for the survey year dummy variable.
Data for FAFH are typically characterised by zero expenditure. Angulo et al. (Citation2002) noted that the three primary reasons for zero expenditure observations are: (1) consumers are unable to purchase the product at current prices and income levels (corner solution); (2) the survey period is too short for reporting expenditure amounts (infrequency of purchase); and (3) consumers have no interest in purchasing the product (abstention). The survey period for the IES is a diary over five periods in a year, thus the infrequency of purchase rationale is not appropriate for this study. The tobit model is convenient, however its inherent weakness is that the choice of and the value of
, given that
, is determined by the same vector of parameters. That is, the tobit model restricts the decision variables to be the same as the variables that determine the intensity of the expenditure. The standard tobit model can be represented by
(1) and
(2) where
is a latent variable representing household FAFH expenditure; and
is a set of explanatory variables. β is a vector of parameters to be estimated while
is the independently identically distributed error with mean of zero and variance of sigma (Cameron & Trivedi, Citation2010).
Estimating a model for FAFH expenditure where a large number of zero expenditure observations are present when corresponding independent variables are observed requires different models depending on the interpretation of the zeros in the FAFH expenditure. The double-hurdle model allows the errors of the participation decision and the expenditure decision to be correlated. It assumes that consumption is determined by two decisions, the first is whether to consume (participation decision) and the second is how much to spend given that the decision to purchase has been made (quantity decision). The following equations follow the notation of García (Citation2013). If denotes the observed consumption amount of the individual, it can be modelled as
(3)
(4) Letting
denote the cumulative distribution function (CDF) of a bivariate normal with correlation
, the loglikelihood function for the double-hurdle model is
(5) The average marginal effect of income was calculated for the probability of purchasing FAFH, the expected amount of expenditure on FAFH given that you purchase FAFH and the expected amount of expenditure on FAFH.
The probability of purchasing FAFH is(6) The expected amount of expenditure on FAFH given that you purchase FAFH is
(7)
Finally, the expected amount of expenditure on FAFH is
(8) The explanatory variables used in this study include household income, size, age of the head, gender of the head, population group of the head and the settlement type.
5. Estimation results
presents the results of the double-hurdle model applied to the FAFH participation and expenditure in South Africa. The participation equation illustrates which variables affect the decision to purchase FAFH. The expenditure intensity equation illustrates which variables affect the amount of expenditure on FAFH.
Table 1. Results of the double-hurdle model performed for the combined IES of 2005/6 and 2010/11.
High income households headed by younger white males and females with a small household size and living in an urban settlement are most likely to participate in the FAFH market. However, conditional on the decision to purchase FAFH, households headed by younger white males with a small household size and living in an urban settlement are likely to have the highest expenditure on FAFH. Income effect is positive in both the decision to participate in the FAFH market and total expenditure on FAFH by participating households. This is in line with studies in other countries. For example, unemployed persons in Spain are the least likely to purchase FAFH (Angulo et al., Citation2002) and Liu et al. (Citation2013) found income to be significant in determining expenditure on all types of meals (breakfast, lunch and dinner). The results of the participation equation show that income increases the predicted probability of purchasing FAFH.
Age of the household head and household size is important in determining the probability of purchasing FAFH. This is consistent with the findings by Min et al. (Citation2004) that showed household size is a key determinant of FAFH consumption. We do not find a significant difference in the likelihood of female-headed households consuming FAFH but find that female-headed households spend less on FAFH than male-headed households. This contrasts with other studies (Nayga & Capps, Citation1994; Ham et al., Citation2004; Binkley, Citation2005) that found that women are less likely to choose FAFH than males. Angulo et al. (Citation2002) found that FAFH consumption in Spain is greater for males than females because of the significant percentage of women working within the home. In South Africa, the percentage of females not working within the home may be higher than that of Spain. One explanation for the contrast in results may also be how the gender variable is defined – female-headed household vs. sex. Female-headed households are likely to have the female as the only adult and likely in the labour force to support the family.
White-headed households have the highest predicted probability of purchasing FAFH, followed by African/black, coloured and finally Indian/Asian-headed households. This result is consistent with Byrne et al. (Citation1996) that blacks are less likely to choose FAFH and consistently spend less on FAFH than white households. They argued that this may be because of the lower availability of ethnic foods in commercial eating establishments, ceteris paribus. This may be an explanation for why we find Indian/Asian-headed households consuming less FAFH food.
Households in urban settlements are likely to have the highest predicted probability of purchasing FAFH compared with households in rural settlements. Additionally, the predicted probability of purchasing FAFH was higher in 2010/11 than in 2005/6.
The results for the intensity equation show that household FAFH expenditure is predicted to increase by 32 cents when the income variable increases by one Rand, ceteris paribus. Household FAFH expenditure is predicted to decrease by 1.2% for a yearly increase in the age of the household head, ceteris paribus. Household FAFH expenditure is predicted to decrease by 8.7% for each member increase in a household, ceteris paribus. Household FAFH expenditure for a female-headed household is predicted to be 15.3% less than when the head of the household is a male, ceteris paribus. Household FAFH expenditure for an African/black-headed household is predicted to be 13.9% less than a coloured-, 31.2% less than an Indian/Asian- and 66.8% less than a white-headed household, ceteris paribus. Household FAFH expenditure for a household in an urban settlement is predicted to be 44.9% more than a household in a rural settlement, ceteris paribus. Average household FAFH expenditure was 130.5% more in 2010/11 than in 2005/6, ceteris paribus. All variables were significant in determining the amount of household FAFH expenditure.
The estimated income elasticities of household FAFH expenditure and the probability of purchasing FAFH for the combined IESs of 2005/6 and 2010/11 were estimated over the full range of income values. The probability of purchasing FAFH was found to be 0.07. This means that for every 10% increase in household income, participation in the FAFH market will increase by 0.7%. The unconditional elasticity was found to be 0.5. That is, for every 10% increase in household income, household FAFH expenditure increases by 5%. Lastly, we also estimated the conditional elasticity of FAFH in South Africa to be 0.2. That is, for households that are already spending on FAFH, household FAFH expenditure increases by 2% if income increases by 10% making the FAFH a normal good rather than a luxury one.
This estimate is higher than Egypt in Fabiosa (Citation2008) where the estimated conditional income elasticity is only 0.02. However, the unconditional income elasticity for the two countries is relatively the same with the value for Egypt estimated at 0.52. The estimates thus suggest new households participating for the first time in FAFH expenditures will drive the growth in the sector. Byrne et al. (Citation1998) estimated the income elasticity for the USA to be 0.20; 0.799 in Spain (Angulo et al., Citation2002) and 0.639 in China (Liu et al., Citation2013).
6. Concluding remarks
This paper presents some of the first evidence of how income and socio-demographic factors relate to FAFH expenditure in South Africa. Understanding how income and socio-demographic factors affect FAFH expenditure is fundamental for predicting impact of price changes and adjusting to changes in food commodity markets. Ignoring FAFH demand will lead to bad and incomplete policies that will not reflect consumer behaviour in South Africa. It can also be useful for developing appropriate marketing plans for new and existing FAFH firms and identifying and targeting specific household types. Consequently, these results will be useful to the foodservice sector and policy makers in South Africa, to identify potential customers, respond to current customers’ changing demands and develop marketing and operational strategies, and address important nutrition and health consequences, respectively.
Many results in this study agree with studies implemented in other countries like China, Egypt, Spain and the USA. Income increases the likelihood of participating in the FAFH market and the amount spent on FAFH. Male-headed households are likely to have greater FAFH expenditures than female-headed households, FAFH expenditures are likely to differ between households headed by different population groups, decrease as the age of the household head increases, decrease as households become larger and are greater for households in urban areas than those in rural settings. Furthermore, this study shows that FAFH expenditure has increased over the survey period from 2005/6 to 2010/11, which agrees with global trends.
Given similar factors affecting FAFH expenditure in South Africa as other parts of the world, South African foodservice companies in the formal sector can apply similar business models to those of western markets where income plays a less significant role in determining if households participate in the market. However, differences will exist because of South Africa’s multicultural population, which is not typical of countries such as Spain and China. The additional demand conditional on purchasing FAFH is more influential than the participation effect. This means that growth in the South African FAFH market will primarily be driven by consumers with existing expenditure.
The estimations performed and a review of players in the sector show that the South African FAFH sector is operating in a mature market. This means that the marketing strategies used should focus on brand diversification, competitive pricing regimes to equal or defeat competitors, using intensive centralised distribution centres or drop unprofitable outlets. Additionally, major growth in the sector will come from increased expenditure by households already spending on FAFH, which would require the sector, at large, to consider lower priced, and healthier and more full-service offerings to cater for lower and higher income households respectively. However, FAFH firms have stated that consumers may say they want more healthy meals options, but do not purchase these options, causing firms to discontinue these meal options.
Policy makers need to acknowledge that expenditure on FAFH is inelastic, thus lower income households that are already consuming FAFH are likely to consume less healthier alternatives such as fast food. Therefore, taxing FAFH may not be effective in reducing FAFH consumption. This is of concern because individuals susceptible to overeating are likely to become obese and suffer from other nutrition-related illnesses. Seguin et al. (Citation2016) found that higher frequency of purchaing FAFH was associated with higher body mass index (BMI) in the USA, after adjusting for age, income, education, race, smoking, marital status and physical activity. The results of this study indicate that households headed by younger white males with small household sizes and living in urban settlements need to be targeted for nutrition education. This is especially important considering the trend of increasing FAFH consumption. This requires nutrition policy, education and promotion strategies to prioritise improving the nutritional quality of FAFH and consumers’ food choices. This education should include warnings of the often-higher levels of sodium, cholesterol and saturated fats present in FAFH meals, and advice on healthier FAFH meal options such as fruits, vegetables and grilled or baked rather than fried foods.Footnote14 At present, it seems that consumers value the nutritional content of FAH more so than FAFH. In a developing country such as South Africa, the availability of FAFH is an additional worry as far as nutrition and health is concerned. This is because FAFH can be purchased from both informal and formal vendors. Furthermore, informal vendors charge lower prices, which makes FAFH readily accessible to lower income earners. A healthy diet may be prohibitively expensive for most South Africans. Therefore, the ingredients used and the method of preparation used in less healthy FAFH options need to be monitored, such that households that are unable to afford healthier options do not consume food that has significant adverse health risks.
Disclosure statement
No potential conflict of interest was reported by the authors.
Notes
1. The Income and Expenditure Survey classifies FAFH as prepared meals purchased from restaurants, cafés, canteens and the like (Statistics South Africa, Citation2008).
2. Source: Food Expenditures data product, Economic Research Service, United States Department of Agriculture (USDA) and National Bureau of Economic Research.
3. Traditional food demand models use data based on household expenditure on food items from the market and typically do not include FAFH consumption. As the share of FAFH expenditure in total food consumption increases, food demand models that ignore FAFH as a category of food demand will not reflect true expenditure and trade-offs.
4. The higher percentage of calories from saturated fat in fast foods was especially noteworthy at 13.5%, compared with 11.9% in restaurant foods, 12.3% in school foods and 10.7% in FAH.
5. This may be because of data availability.
6. The dependent double-hurdle model is used given it allows correlation between the participation decision and expenditure decision (García, Citation2013).
7. Ma et al. (Citation2006) used both univariate and multivariate tobit models to conduct their analyses of FAFH expenditure for urban China. Angulo et al. (Citation2002) used the two-stage process suggested by Chamberlain (Citation1984) to address the problem of including censored dependent variables in the panel data framework. Stewart et al. (Citation2004) used the method developed by Shonkwiler and Yen (Citation1999) to estimate multiple equations simultaneously while accounting for zero-censoring because the usual methods of estimation are likely to be biased in the presence of zero expenditure observations (zero-censoring) for FAFH. The Shonkwiler and Yen method consists of two steps to correct for the problem of zero-censoring.
8. Household size can be expected to have both positive and negative impact on FAFH. In a country like China with restrictions on number of children, larger household size can actually signify more adults in a household than a large size with more kids. A household with more adults including grand parents may reduce the likelihood of demand for FAFH.
9. Stewart et al. (Citation2004) stated that:
To test hypotheses about how a household’s demand for food away from home is affected by its structure and other characteristics, we need a data set with information on households, their characteristics, and how much they spend in each market segment. The ideal set of data for this study would include information on at least several thousand households, the characteristics of each household, and how much each household spent in each market segment. Moreover, it would follow this sample of households over 20 to 50 years, and report on how each household’s characteristics and expenditures have changed … Unfortunately, these data are not available.
10. A detailed overview of the sector is presented in the supplementary material to this paper.
11. Other data exist that can be used in South Africa such as the National Income and Dynamics Study. The IES is used given that the first panel comparable to the 2011 data is in 2005 versus the first panel for the National Income Dynamics Study (NIDS) starting in 2008 and there are issues of comparability between the first and second fieldwork phases of the NIDS wave 2 (Finn et al., Citation2014). Other studies can compare the results in the two datasets for robustness. The IESs are primarily dedicated to collecting information on households’ expenditures and, as such, the questionnaires are extensive and detailed with six visits by enumerators in 2005/6 and four visits in 2010/11.
12. Some households were dropped because of missing values in some or all of the variables of interest.
13. Variables such as hours worked and occupation are other variables that are included in the estimation.
14. Variyam (Citation2005) argued that FAFH providers have different types of offerings, economies of scale and levels of recipe standardisation and that having a labelling policy will have varying impact on producers. The value of labelling for consumers may be endogenously determined – will consumers that already have good quality diets and healthy weights reap the benefits of labelling or those with poor diets and the overweight?
References
- Analytix Business Intelligence, 2013. South Africa brand report – Fast Food consumer trends: 2008–2012.
- Angulo, AM, Gil, JM & Mur, J, 2002. Spanish demand for food away from home: A panel data approach: Paper prepared for presentation at the Xth EAAE Congress ‘Exploring Diversity in the European Agri-Food System’. Zaragoza (Spain), 28-31 August 2002. [Online]. http://ecsocman.hse.ru/data/673/658/1219/131-005_fafh-angulo-gil-mur.pdf Accessed 11 June 2013.
- Bai, J, Wahl, TJ, Lohmar, BT & Huang, J, 2010. Food away from home in Beijing: Effects of wealth, time and “free” meals. China Economic Review 21, 432–41. doi: 10.1016/j.chieco.2010.04.003
- Becker, G, 1965. A theory of the allocation of time. The Economic Journal 75, 493–517. doi: 10.2307/2228949
- Bezerra, IN, de Moura Souza, A, Pereira, RA & Sichieri, R, 2013. Consumption of foods away from home in Brazil. [Online]. http://www.scielo.br/pdf/rsp/v47s1/en_06.pdf Accessed 18 March 2014.
- Binkley, J, 2005. The effect of demographic, Economic, and nutrition factors on the frequency of food away from home: Selected Paper prepared for presentation at the American Agricultural Economics Association Annual Meeting, Providence, Rhode Island, July 24-27, 2005. [Online]. http://ageconsearch.umn.edu/bitstream/19502/1/sp05bi01.pdf Accessed 18 March 2014.
- Byrne, PJ, Capps, O Jr. & Saha, A, 1996. Analysis of food-away-from-home expenditure patterns for US households, 1982–89. American Journal of Agricultural Economics 78, 614–27. doi: 10.2307/1243279
- Byrne, P, Capps, O Jr. & Saha, A, 1998. Analysis of quick-serve, mid-scale, and up-scale food away from home expenditures. The International Food and Agribusiness Management Review 1, 51–72. doi: 10.1016/S1096-7508(99)80028-7
- Cameron, AC & Trivedi, PK, 2010. Microeconometrics using Stata, revised edition. rev edn. Texas: Stata Press.
- Chamberlain, G, 1984. Panel data. In Griliches, Z, & Intriligator, M (Eds) Handbook of econometrics, Vol. 2. Amsterdam: North-Holland.
- Cragg, JG, 1971. Some statistical models for limited dependent variables with application to the demand for durable goods. Econometrica 39, 829–844. doi: 10.2307/1909582
- Edwards, JSA, 2013. The foodservice industry: Eating out is more than just a meal. Journal of Food Quality and Preference 27, 223–9. doi: 10.1016/j.foodqual.2012.02.003
- Fabiosa, JF, 2008. The food-away-from-home consumption expenditure pattern in Egypt. Working Paper 08-WP 474. [Online]. www.card.iastate.edu/.../08wp474.pdf Accessed 22 May 2013.
- Finn, A, Leibbrandt, M & Oosthuizen, M, 2014. Poverty, inequality, and prices in post-apartheid South Africa (No. 2014/127). WIDER Working Paper.
- Frazão, E, 1999. Nutrient contribution of food away from home. In Lin, B & Guthrie, J (Eds.), America’s eating habits: Changes and consequences (pp. 213–242). United States Department of Agriculture: Economic Research Service. [Online]. http://ers.usda.gov/media/91062/aib750l_1_.pdf Accessed 26 May 2013.
- García, B, 2013. Implementation of a double-hurdle model. The Stata Journal 13(4), 776–94.
- Gould, B & Villarreal, H, 2006. An assessment of the current structure of food demand in urban China. Agricultural Economics 34, 1–16. doi: 10.1111/j.1574-0862.2006.00098.x
- Ham, S, Hwang, JH & Kim, WG, 2004. Household profiles affecting food-away-from-home expenditures: A comparison of Korean and US households. International Journal of Hospitality Management 23, 363–79. doi: 10.1016/j.ijhm.2004.01.001
- Kinsey, J, 1983. Working wives and the marginal propensity to consume food away from home. American Journal of Agricultural Economics 65, 10–9. doi: 10.2307/1240332
- Lancaster, KJ, 1971. Consumer demand. New York: Columbia University Press.
- Lee, J, and Brown, M, 1986. Food expenditures at home and away from home in the United States – A switching regression analysis. The Review of Economics and Statistics 68, 142–7. doi: 10.2307/1924937
- Lin, BH & Guthrie, J, 2012. Nutritional quality of food prepared at home and away from home. Washington, DC: US Department of Agriculture, Economic Research Service.
- Lin, B, Guthrie, JF & Frazão, E, 2002. Role of food prepared away from home in the American diet, 1977–78 versus 1994–96: Changes and consequences. Journal of Nutrition Education and Behavior 34(3), 140–50. doi: 10.1016/S1499-4046(06)60083-3
- Lippert, A & Love, D, 1986. Family expenditures for food away from home and prepared foods. Family Economics Review 3, 9–14.
- Liu, M, 2011. Food expenditures away from home by type of meal and by facility. Master’s Thesis, University of Tennessee. [Online]. http://trace.tennessee.edu/utk_gradthes/1000 Accessed 22 May 2013.
- Liu, M, Kasteridis, P & Yen, ST, 2013. Breakfast, lunch, and dinner expenditures away from home in the United States. Food Policy 38, 156–64. doi: 10.1016/j.foodpol.2012.11.010
- Ma, H, Huang, J, Fuller, F & Rozelle, S, 2006. Getting rich and eating out: Consumption of food away from home in urban China. Canadian Journal of Agricultural Economics 54, 101–19. doi: 10.1111/j.1744-7976.2006.00040.x
- Maumbe, BM, 2010. The quick service restaurant industry in South Africa: Market structure, competitive strategies, and research directions. [Online]. https://www.ifama.org/.../191_poster_2.p Accessed 9 May 2013.
- McCracken, VA & Brandt, JA, 1987. Household consumption of food-away-from-home: Total expenditure and by type of food facility. American Journal of Agricultural Economics 69(2), 274–84. doi: 10.2307/1242277
- Min, I, Fang, C & Li, Q, 2004. Investigation of patterns in food-away-from-home expenditure for China. China Economic Review 15, 457–76. doi: 10.1016/j.chieco.2004.06.008
- Moffatt, PG, 2005. Hurdle models of loan default. The Journal of the Operational Research Society 56(9), 1063–71. doi: 10.1057/palgrave.jors.2601922
- Nayga, RM & Capps, O, Jr. 1992. Analysis of food away from home and food at home consumption: A systems approach. Journal of Food Distribution Research 23(3).
- Nayga, RM, Jr. & Capps, O, Jr. 1994. Impact of socio-economic and demographic factors on food away from home consumption: Number of meals and type of facility. Journal of Restaurant & Foodservice Marketing 1(2), 45–69. doi: 10.1300/J061v01n02_04
- Prochaska, FJ & Schrimper, RA, 1973. Opportunity cost of time and other socioeconomic effects on away-from-home food consumption. American Journal of Agricultural Economics 55, 595–603. doi: 10.2307/1238344
- Redman, B, 1980. The impact of women’s time allocation on expenditure for meals away from home and prepared foods. American Journal of Agricultural Economics 62(2), 234–7. doi: 10.2307/1239690
- Seguin, R. A., Aggarwal, A., Vermeylen, F., & Drewnowski, A. (2016). Consumption frequency of foods away from home linked with higher body mass Index and lower fruit and vegetable intake among adults: A cross-sectional study. Journal of Environmental and Public Health 6, 1–12. doi: 10.1155/2016/3074241
- Shonkwiler, JS, & Yen, S, 1999. Two-step estimation of a censored system of equations. American Journal of Agricultural Economics 81, 972–982. doi: 10.2307/1244339
- Statistics South Africa, 2008. Income and expenditure of households 2005/2006 metadata. Report No. P0100. [Online]. http://personal.psc.isr.umich.edu/~davidl/southafrica/IES2005.metadata.pdf Accessed 22 May 2013.
- Statistics South Africa, 2012. Income and expenditure of households 2010/2011 metadata. Report No. P0100. [Online]. file:///C:/Users/Appretince/Downloads/IES%202010-2011%20Metadata.pdf Accessed 22 May 2013.
- Stewart, H, Blisard, N, Bhuyan, S & Nayga, RM, Jr. 2004. The demand for food away from home: Full-service or fast food? United States Department of Agriculture. Economic Research Service. Agricultural Economic Report Number 829. [Online]. www.ers.usda.gov/media/.../aer829_1_.p Accessed 4 April 2013.
- Variyam, JN, 2005. Nutrition labeling in the food-away-from-home sector: An economic assessment (No. 7235). Washington, DC: United States Department of Agriculture, Economic Research Service.
- Yen, ST, 1993. Working wives and food away from home: The box-cox double hurdle model. American Journal of Agricultural Economics 75(4), 884–95. doi: 10.2307/1243976