
ABSTRACT
This study uses the Census 2001 and 2011 as well as Community Survey 2007 and 2016 data to derive a multidimensional poverty index in South Africa for each year, before assessing the changes in non-money-metric, multidimensional poverty over time. Both the incidence and intensity of multidimensional poverty decreased continuously, and these declines were more rapid than that of money-metric poverty. The decrease in multidimensional poverty between 2001 and 2016 was most rapid for female Africans residing in rural areas in Eastern Cape and KwaZulu–Natal provinces. Multidimensional poverty was most serious in numerous district councils in these two provinces, despite the fact that poverty decline was also most rapid in these district councils. The results of the multidimensional poverty index decomposition indicated that Africans contributed more than 95% to multidimensional poverty, while unemployment, years of schooling and disability were the three indicators contributing most to poverty.
1. Introduction
Since the advent of democracy, one of the key objectives of the South African government has been the reduction of poverty, disparities and imbalances stemming from the Apartheid regime. Several large-scale economic programmes were implemented,Footnote1 specifically aiming at the achievement of various economic goals, such as more rapid economic growth and job creation, improved service delivery, and alleviation of poverty and inequality. With regard to poverty, it is important to accurately identify the most deprived areas and effectively target these areas by implementing appropriate poverty-reduction strategies. Hence, numerous approaches have arisen to derive the extent of poverty and profile of the poor.
Poverty can be measured objectively or subjectively. For the latter, an individual assesses whether or not they feel poor relative to a reference group (Ravallion, Citation1992, Citation1998; Statistics South Africa (StatsSA), Citation2012:8), and this may or may not involve a poverty line. For example, a person declares the income level he/she considers to be minimal to make ends meet (this amount may differ amongst respondents), and if his/her income is below this self-rated poverty line, he/she is identified as poor. Alternatively, the person self-assesses whether his/her income or overall welfare is below the average level of the people living in the same area. A person could also declare on a scale of, for instance, 0 (very dissatisfied) to 10 (very satisfied), how he/she feels about his/her life as a whole, and the person is distinguished as poor if his/her life satisfaction level is below a particular level, such as the midpoint of 5.Footnote2
Objective money-metric poverty can be measured with an either absolute or relative approach. The absolute approach entails the use of a poverty line, which represents the required income level to purchase a basket of essential items for survival (cost of basic needs method) or the level at which a person's food energy intake is enough to meet a predetermined food energy requirements, like 2100 calories per day (energy intake method) (Ravallion, Citation1998:10; Haughton & Khandker, Citation2009:49–50). Relative money-metric poverty involves the identification of the poorest (e.g. 20% or 40%) segment of the population using a relative poverty line, or setting a poverty line at a certain percentage of the mean or median per capita income (Govendor et al., Citation2006:9).
In South Africa, there has been an abundance of empirical studies on money-metric poverty since the early 1990s using numerous datasets, ranging from the Income and Expenditure Surveys (Simkins, Citation2004; Hoogeveen & Özler, Citation2006; Yu, Citation2008), Census and Community Surveys (CSs) (Leibbrandt et al., Citation2006; Yu, Citation2009) and All Media Products Survey (Van der Berg et al., Citation2005, Citation2007), to the National Income Dynamics Study (Yu, Citation2013), October Household Surveys and General Household Surveys (GHSs) (Posel & Rogan, Citation2012). In general, these studies found that money-metric poverty increased in the 1990s until 2000, before a downward trend took place.
The money-metric approach, while focusing on the low income or expenditure level when identifying the poor, does not capture ‘the multiple aspects that constitute poverty’ (StatsSA, Citation2014:2), as poverty involves numerous non-money-metric dimensions, such as health and educational deprivation, physical and social isolation, lack of asset possession and access to services, feeling of vulnerability, powerlessness and helplessness (Woolard & Leibbrandt, Citation1999:3; World Bank, Citation2000:18; Philip & Rayhan, Citation2004:1). Furthermore, numerous factors influence the reliability and comparability of money-metric poverty estimates, such as recall bias (respondents may not remember income earned long time ago), telescoping (respondents include income or consumption events before the reference period), whether income is captured in exact amounts or intervals, the number of intervals and width of each interval, and the presence of a high proportion of households with unspecified or zero income.Footnote3
Given these drawbacks of the money-metric approach and the multidimensional nature of poverty, South African studies on non-money-metric, multidimensional poverty have increasingly emerged in the 2000s and early 2010s using statistical techniques (such as principal components analysis, multiple correspondence analysis and factor analysis, as well as the totally fuzzy and relative (TFR) approach) to derive a non-income welfare index. Nonetheless, one serious shortcoming of these studies is that the analysis is mainly confined to two groups of non-money-metric indicators, namely access to public services and ownership of private assets.
In recent years, the multidimensional poverty index (MPI) approach introduced by Alkire & Foster (Citation2011a) has evolved in the international literature. This approach ‘assesses the simultaneous or joint deprivations poor people or households experience in a set of indicators’ (Alkire & Foster, Citation2011a:17). The MPI comprises two measures, namely poverty incidence and poverty intensity; the former means the percentage of population classified as multidimensionally poor (poverty headcount ratio), while the latter represents the proportion of average deprivation experienced by the poor (Santos & Alkire, Citation2011:34). An added advantage of this approach is that the index could be decomposed by sub-groups (such as gender and race) and indicators, to identify the key sub-groups and indicators that contribute most to deprivation.
The MPI approach is still a relatively new method in South Africa, as indicated by the presence of few studies applying this method to examine poverty. This may be due to the fact that this approach is more data hungry, covering a broader range of non-money-metric indicators. In fact, only one local study (StatsSA, Citation2014) derived comprehensive MPI poverty trends over time (2001–2011) by creating a South African Multidimensional Poverty Index (SAMPI), but numerous shortcomings are associated with the SAMPI approach on the selection of indicators and deprivation cut-off threshold of each indicator.
Therefore, this study aims to address these shortcomings to derive an improved, revised version of the SAMPI, before exploring the levels and trends of MPI poverty in South Africa in 2001–2016. MPI poverty is examined by gender, race and geographical units, with specific focus on what happened by province and district councils (DC). A wide range of non-money-metric indicators are considered when deriving the multidimensional deprivation score instead of restricting to private asset ownership and access to public services. The empirical analysis allows for the establishment of the main contributors to poverty in the South African context and a comparison to be made between multidimensional poverty and money-metric poverty. This approach can be viewed as a tool to identify the most vulnerable people, leading to the formation of better poverty-reduction policy as well as better allocation of resources to alleviate poverty.
2. Literature review
For the recent local empirical studies examining multidimensional, non-money-metric poverty, some researchers have adopted the methods mentioned in Section 1, namely factor analysis (Bhorat et al., Citation2006; Bhorat et al., Citation2007; Bhorat & Van der Westhuizen, Citation2013; Bhorat et al., Citation2014), multiple correspondence analysis (Adams et al., Citation2015; Ntsalaze & Ikhide, Citation2016), principal components analysis (Nieftagodien & Van der Berg, Citation2007; Schiel, Citation2012; Bhorat et al., Citation2015) and the TFR approach (Ngwane et al., Citation2001; Qizilbash, Citation2002; Burger et al., Citation2017). A composite welfare index was constructed by considering household access to public services (e.g. fuel source, water source, sanitation facility) and ownership of private assets (e.g. television, fridge, telephone). These studies found a downward trend in non-money-metric poverty since 1993; this finding is not surprising, given the government's ongoing effort to improve the provision of free basic services since the economic transition (Bhorat & Van der Westhuizen Citation2013:1). Also, there were still significant backlogs in the bottom income deciles, especially for African- and female-headed households.
Some studies adopted methods other than the above-mentioned statistical methods and included additional non-money-metric indicators to examine multidimensional poverty more comprehensively. First, six studies used the MPI method. Frame et al. (Citation2016) focused on youths of 15–24 years while Omotoso and Koch concentrated on children of 0–17 years. Rogan (Citation2016) examined gendered poverty while Mushongera et al. (Citation2017) focused on Gauteng municipalities. Finn et al. (Citation2013) carried out a general study examining MPI poverty by race, province and area type using the 1993 PSLSD and 2010/2011 National Income Dynamics Study data. StatsSA (Citation2014) is the most inclusive MPI poverty study by province and municipality using the 2001 and 2011 census data. In general, these studies found that MPI poverty declined.
Few studies adopted alternative approaches to examine non-money-metric multidimensional poverty. Hirschowitz (Citation2000), using an interim scoring approach,Footnote4 derived the household infrastructure and household circumstance indices to examine poverty using Census 1996 data, and found that Northern Cape and Eastern Cape were the least and most deprived provinces, respectively. StatsSA (Citation2013) adopted the Bristol methodFootnote5 to derive the severe poverty and less severe poverty indices with the 2008/2009 Living Conditions Survey data, and found that Western Cape was least deprived while the opposite took place in Eastern Cape and Limpopo. The 2017 StatsSA study, analysing the 2016 CS data, adopted the Van der Walt and Haarhoff composite index approachFootnote6 to derive infrastructure quality index and reliability index to examine poverty by municipality.
Noble et al. (Citation2006), using the Census 2001 data, derived five indices (one from each deprivation domain: income, employment, education, health and living environment) by province, before aggregating these indices (20% equal weight to each index) into a provincial index of multiple deprivation with the aid of standardisation and exponential distribution (refer to Noble et al. (Citation2006:29–31) for detailed explanation) to identify the most deprived municipalities. The later studies by Noble et al. (Citation2010) as well as Noble & Wright (Citation2013), using the same data, adopted a similar approach to derive the index of multiple deprivation, but the former study focused on the Eastern Cape while the latter study examined the former homeland areas.
Noble et al. (Citation2006, Citation2010), Noble & Wright (Citation2013), Burger et al. (Citation2017), Mushongera et al. (Citation2017) and StatsSA (Citation2014, Citation2017) are rare studies that examined multidimensional poverty by smaller geographical areas. Of these studies, StatsSA (Citation2014) and Burger et al. (Citation2017) derived multidimensional poverty trends over time. Nonetheless, there are drawbacks to these two studies: it is not possible to decompose the index to identify the sub-groups and indicators that contribute most to deprivation with the TFR approach adopted in Burger et al. (Citation2017)Footnote7; for StatsSA (Citation2014), there is much room for improvement on the choice of the indicators and deprivation cut-off points of some indicators (see Section 3).
None of the existing local studies examined multidimensional poverty trends by DCs or included the most recently available CS 2016 data. Finally, not all of these studies included labour market activities as an indicator for deriving the multidimensional poverty index. As the persistently high unemployment rate (26.6% in the fourth quarter of 2018) is one of the major causes of poverty, it is imperative to include this dimension.
3. Methodology and data
3.1. Methodology
The global MPI approach was introduced in 2011 by Alkire and Foster for the purpose of measuring acute poverty across countries. This approach is relatively simpler compared with other highly statistical approaches and highly flexible in terms of the inclusion of dimensions and indicators. The global MPI comprises three dimensions: health, education and living standard. Each dimension is broken down into m indicators in total: the health dimension consists of nutrition and child morality; the education dimension accounts for years of schooling and school attendance; and the living standard dimension includes cooking fuel, water, sanitation, electricity, floor material and asset ownership (Santos & Alkire, Citation2011:5–6).
A two-step, ‘dual cut-off’ approach is involved to derive the MPI index (Alkire & Foster, Citation2011b: 296). Linked to each indicator is a certain minimum level of satisfaction which is referred to as the deprivation cut-off point, denoted as zi. A person i is deprived if his/her achievement in this indicator, xi, is below the cut-off, that is, if xi < zi, the dummy variable Ii, equals 1; if xi ≥ zi, Ii equals zero. Next, the indicators’ weights are chosen, and these weights sum to 1 (). Each dimension carries an equal weight of one-third, and an equal weighing scheme is also applied to the indicators within each dimension. The deprivation score
is calculated as
. This score ranges between zero and one.
Next, a specific cut-off point, k, represents the share of weighted deprivations that a person must have to be considered as multidimensionally poor. Somebody is considered poor if ci ≥ k. In the MPI, k = 1/3, meaning that the person's deprivation must be at least a third of the weighted indicators to be identified as MPI poor. Furthermore, ci(k), the censored deprivation score, is derived as follows: if ci ≥ k, ci(k) = ci; if ci < k, ci(k) = 0 (Santos & Alkire, Citation2011:11).
The MPI reflects both the proportion of the population that is multidimensionally poor (H, the poverty headcount ratio) and the average proportion of weighted deprivation the person experiences (A, the intensity of poverty). In equation terms, H = q/n, where q and n represent the number of multidimensionally poor and the total population respectively; , which indicates the fraction of the m indicators in which the multidimensionally poor individual is deprived. The MPI is calculated as the product of H and A. Assuming two areas to have the same H, the area with higher A is associated with a higher MPI. That is, if the poor are deprived in an additional dimension, the MPI will increase even though H is unchanged. This is one of key strengths of MPI compared with other statistical approaches.
The MPI index can be decomposed by population sub-groups or indicators. The country's MPI equals , where j represents the total number of sub-groups (for example, j = 4 for race and j = 9 for province),
is the population share of the ith sub-group, and MPIi is the MPI of this sub-group. The contribution of the ith sub-group to the overall MPI is derived as
.Footnote8 The MPI of the country could also be decomposed as:
, where CHi is the censored headcount ratio of the ith indicator.Footnote9 The contribution of the ith indicator to the overall MPI is denoted as
.
There were already numerous adaptations that had been made to the global MPI in terms of the indicators chosen and respective cut-off points of the indicators to develop the StatsSA SAMPI, but this study makes further adaptations to construct an improved version of the SAMPI. These adaptations are influenced by the Millennium Development Goals (United Nations, Citation2008), the South African poverty context, the commonly chosen indicators in recent empirical studies and the availability of data in the four datasets used for the study.
shows that, in the education dimension, as in the global MPI and StatsSA approaches, years of schooling and school attendance are the two indicators. Nonetheless, for the former indicator, the years of completed education threshold is changed from five to seven years for this study. Illiteracy usually refers to an educational level representing less than seven years of formal schooling (Barker, Citation2008:223), and this is more applicable to the South African context as it makes reference to all individuals who did not complete Grade 7.Footnote10
Table 1. Dimensions, indicators, deprivation cut-offs and weights for the MPI.
In the global MPI, the health dimension includes child mortality and nutrition, with the latter indicator involving the body mass index. Unfortunately, both Census and CS did not capture information on height and weight, and asked nothing about malnutrition, hunger or food security. While StatsSA (Citation2014) included child mortality as the only indicator of the health dimension, disability is introduced in this study as the second indicator.Footnote11 Disability is included because it is associated with lower living standard and a greater likelihood of marginalisation and discrimination, through its adverse impact on human capital formation opportunities in childhood, employment opportunities and productivity in adulthood, and access to appropriate transportation and social participation (Schultz & Tansel, Citation1997; Elwan, Citation1999; World Health Organisation and World Bank, Citation2011; Mitra et al., Citation2013).
The deprivation cut-off of this indicator is the presence of at least one disabled household member. In each dataset, the disabled is defined as follows:
2001 and 2007 – the respondent was asked in 2001 if he/she suffers serious sight, hearing, communication, physical, intellectual and emotional disabilities that prevent his/her full participation in life activities. The same questions were asked in 2007 except that the word ‘serious’ was removed. If the respondent's answer is ‘yes’ to at least one type of disability, he/she is defined as disabled.
2011 and 2016 – the respondent was asked if he/she (A) has no difficulty, (B) has some difficulty, (C) has a lot of difficulty, (D) cannot do at all, (E), do not know or (F) cannot be determined, with regard to seeing, hearing, communication, walking/climbing, remembering/concentrating and self-care. If the respondent's answer is either (C) or (D) to at least one activity, he/she is identified as disabled.
The floor type and electricity access (only captured in 2011 and 2016 respectively) indicators are excluded from the MPI approach, but are replaced by dwelling type, overcrowding and refuse removal frequency indicators. The respective cut-off points for these indicators are as follows: residing at formal dwellings (same as StatsSA Citation2014); more than two persons per room (as adopted in Mushongera et al. Citation2017; Omotoso & Koch Citation2017); less than once a week or no concrete refuse removal system (same as Adams et al. Citation2015). Finally, asset ownership only takes television, landline telephone, cellular telephone, fridge, computer and radio into consideration as they are the only asset variables asked across all four datasets.
Economic activity is the fourth dimension as in some local MPI studies (Statistics SA, Citation2014; Frame et al., Citation2016; Mushongera et al., Citation2017; Omotoso & Koch, Citation2017), with unemployment being the indicator: if all working-age members of the household are unemployed under the narrow definition, this household is deprived.
3.2. Data
Four StatsSA datasets are used: a 10% sample of Census 2001 and 2011, CS 2007 and 2016. These data provide ample information on demographics, educational attainment, economic activities, asset ownership, access to household goods and services, and income in bands. Nonetheless, some data limitations exist. First, it is impossible to include Census 1996 data as only landline telephone and cellular telephone information was captured as far as private asset ownership is concerned (). The second issue relates to the matching of the various DCs across the datasets, as some DCs were separated while others were integrated over the years. However, this problem can be solved, as shown in . The second limitation relates to the absence of the area type variable in CS 2007.
One serious drawback is the non-availability of the 2016 CS data on labour market activities, even though the information was captured. Also, the question on the number of rooms in the dwelling was not asked in 2016. Hence, the MPI is conducted twice (see ): (I) including all 12 indicators to conduct the analysis for 2001, 2007 and 2011; and (II) including the first 10 indicators to conduct the analysis for all four years. Finally, information on income, despite being asked in CS 2016, was not released by StatsSA. Hence, comparison between MPI poverty and money-metric poverty is not possible for 2016.
4. Empirical findings
4.1. Extent of deprivation per indicator
illustrates that there was generally a continuous downward trend in the proportion of deprived population for all 12 indicators, except disability: its proportion went down in 2007 and increased in 2011 before decreasing again in 2016. This unusual trend may be attributed to the inconsistent questionnaire design. In 2016, there was still as high as 39.5% and 41.3% of the population not having their refuse removed at least once a week and with no access to a flush toilet, respectively. Only less than 1% of the population was deprived in the child mortality indicator in 2016, while the deprivation proportion was as low as 2.5% and 5.4% in the school attendance and years of schooling indicators.
Figure 1. Proportion (%) of population deprived in each indicator. Source: Authors’ calculations using the Census 2001, CS 2007, Census 2011 and CS 2016 data.
Note: the 2016 deprivation proportions of indicators [K] (overcrowding) and [L] (unemployment) are not available.
![Figure 1. Proportion (%) of population deprived in each indicator. Source: Authors’ calculations using the Census 2001, CS 2007, Census 2011 and CS 2016 data.Note: the 2016 deprivation proportions of indicators [K] (overcrowding) and [L] (unemployment) are not available.](/cms/asset/f5fb5bfb-0122-4781-ac16-367356771224/cdsa_a_1469971_f0001_oc.jpg)
and indicate that greater deprivation was experienced by individuals from female-headed households. Also, deprivation per indicator was considerably higher for rural residents. The deprivation proportions were the highest for the Africans but lowest for the whites. Furthermore, Gauteng and the Western Cape were the least deprived provinces while the Eastern Cape, Limpopo and the North West were most deprived. Finally, the decline of the deprivation proportions between 2001 and 2016 was greater for Africans, females, rural residents and those staying in the above-mentioned three provinces.
and examine the proportion of the deprived population in each indicator by DC in 2001 and 2016, respectively. These proportions were high in the Eastern Cape and KwaZulu–Natal DCs (e.g. Alfred Nzo, Harry Gwala, OR Tambo and uMzinyathi) but low in the Western Cape and Gauteng DCs (e.g. Cape Winelands, City of Cape Town, City of Johannesburg and West Coast).
4.2. MPI by sub-groups
The MPI estimates by gender, race, area type and province are shown in and . For the overall population, a downward trend of MPI took place under both weighting schemes, with the decline being relatively more rapid between 2001 and 2007. Also, poverty headcount estimates decreased more rapidly compared with poverty intensity estimates.
shows that MPI poverty was more severe amongst those coming from female-headed households, but the gap between the male MPI and female MPI narrowed over the years. MPI was the highest for the Africans, followed by coloureds, Indians and whites. The decline of MPI was most rapid for the Africans while the white MPI stagnated. MPI was higher for rural residents as expected, even though a more drastic reduction of MPI poverty also occurred to them. indicates that a downward trend of MPI poverty took place across all provinces, with Western Cape and Gauteng boasting the lowest MPI estimates while the Eastern Cape, KwaZulu–Natal and Limpopo had the highest estimates.
Table 2. Multidimensional poverty by province, 2001–2016.
Comparing and , despite minor changes in the MPI ranking of the DCs before and after including the labour dimension, Cape Winelands, City of Cape Town, City of Johannesburg, Overberg and West Coast are associated with the lowest MPIs. In contrast, Alfred Nzo, Harry Gwala, OR Tambo, uMkhanyakude and uMzinyathi are amongst the DCs with the highest MPIs. shows that the DCs with the highest MPIs are also the ones enjoying the greatest absolute decline in the estimates under both weighting schemes. These results suggest that resources were allocated to the right DCs to improve the non-income welfare of the poorest of the poor.Footnote12
Table 3. The 10 district councils with the greatest absolute decline in MPI.
4.3. MPI decomposition
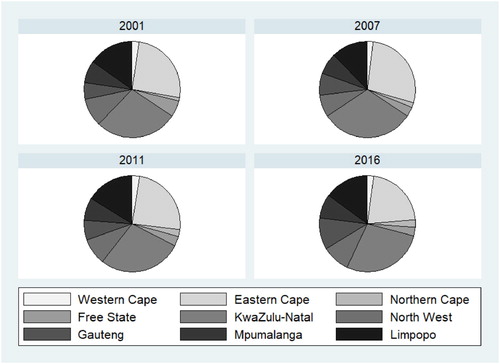
shows that, regardless of which weighting scheme was adopted, the relative contribution by individuals from female-headed households was more dominant. Moreover, even though the African population represented about 80% of the population, their MPI contribution to poverty exceeded 95%. The relative contribution of the rural population (about two-thirds) greatly exceeded its population share (40%). Lastly, KwaZulu–Natal and Eastern Cape were the provinces with the first and second largest MPI contributions; they accounted for about 50% share of MPI poverty (see and ), despite only accounting for about one-third of the population.
Figure 2. MPI decomposition (%) by province using weighting scheme (I), 2001–2011. Source: Authors’ calculations using the Census 2001, CS 2007 and Census 2011 data.
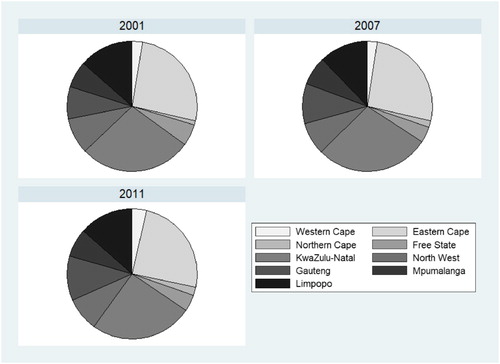
Figure 3. MPI decomposition (%) by province using weighting scheme (II), 2001–2016. Source: Authors’ calculations using the Census 2001, CS 2007, Census 2011 and CS 2016 data.
shows that, using weighting scheme (I), unemployment was the indicator contributing most to MPI, followed by years of schooling and disability. Using weighting scheme (II), disability and years of schooling contributed most to MPI poverty, with their respective shares being 24% and 13% in 2016 (Frame et al. (Citation2016:18) and Rogan (Citation2016:999) rather found years of schooling and nutrition as the respective indicator with the greatest contribution to MPI). Sanitation has the third highest contribution to MPI (nearly 13% in 2016), and this is not surprising, given the findings in .
Table 4. MPI decomposition (%) by indicator, 2001–2011.
Child mortality contributed least to MPI poverty (as also found by StatsSA (Citation2014:10)). This finding contradicts the results of Finn et al. (Citation2013:10–11) and Rogan (Citation2016:999), but it may be attributed to the way the data was captured: in censuses and CSs, the respondents were asked if any household member had passed away in the past year, but in the datasets used by Finn et al. and Rogan, the respondents were asked about the death of household members regardless of when it took place (these two studies used 20 years as the threshold).
4.4. MPI poverty vs income poverty
The final part of the empirical analysis compares MPI with income poverty. The absolute lower bound poverty line was derived by StatsSA (Citation2015:11) as R501 per capita per month in 2011 February–March prices (equivalent to R689 in 2016 December prices, using StatsSA's latest CPI series; StatsSA, Citation2017), using the IES 2010/2011 consumption basket. The original Census and CS income data is problematic to some extent, with a high proportion of households reporting zero or unspecified income – 37% in 2001, 19% in 2007 and 29% in 2011. Hence, the income amounts for these households were imputed with the aid of sequential regression multiple imputation (SRMI).Footnote13
shows that MPI poverty prevalence declined across all income quintiles, but the decrease in absolute terms was the greatest in the two poorest quintiles. Money-metric poverty decreased between 2001 and 2007 before a negligent increase took place in 2011. The latter increase was also found by Yu (Citation2016:156).
Table 5. MPI in each population quintile using weighting scheme (I), 2001–2011.
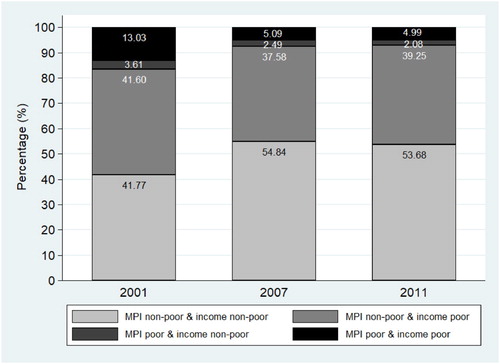
shows that the proportion of population defined as both MPI and income poor decreased continuously. Upon examining these ‘poorest of the poor’, they were predominantly female African rural residents in Eastern Cape, KwaZulu–Natal and Limpopo. Finally, the last four columns of compare MPI and income poverty by DC in 2011 and the rankings of the DCs from the two approaches are highly correlated – the Spearman's rank correlation coefficient was 0.9039 (it was 0.9732 in 2001 and 0.8980 in 2007).
Figure 4. Proportion (%) of population in each poverty status category. Source: Authors’ calculations using the Census 2001, CS 2007 and Census 2011 data.
5. Conclusion
This study examined multidimensional poverty in South Africa in 2001–2016 with the MPI approach. This is the first local MPI study by DC and the first poverty study to include the CS 2016 data for analysis. Numerous adaptions were made to the original global MPI and StatsSA's SAMPI to cater for the South African poverty context to create an improved local version of the MPI. The empirical findings indicated a continuous and significant decline in MPI poverty, with this decline mainly driven by large reductions in the poverty headcount, whereas only a slight decrease in the intensity of poverty took place. Unemployment, years of schooling and disability were the top drivers of MPI poverty.
Regarding the results at DC level, the DCs with the lowest MPIs were concentrated in Western Cape (such as Cape Winelands, City of Cape Town, Overberg and West Coast), whereas the DCs associated with the highest MPIs were mainly located in Eastern Cape (e.g. Alfred Nzo and OR Tambo) and KwaZulu–Natal (Harry Gwala, uMkhanyakude and uMzinyathi). Furthermore, the DCs with the highest MPIs enjoyed the greatest absolute decline in the indices under both weighting schemes, and there was a strong correlation between MPI and income poverty.
Even though the empirical findings generally are in line with what was found by most recent local studies on multidimensional poverty and this study adds to the existing literature by comprehensively examining MPI poverty at DC level with an improved version of SAMPI, there is still room for improving the SAMPI further. First, assuming it is a difficult task to collect information on height and weight, it remains crucial for StatSA (in the next round of Census or CS) to capture more information on the health dimension so that a wider range of indicators can be included, such as food hunger, food security (e.g. whether the size of the meals was cut, meals were skipped or a smaller variety of foods were eaten) and visits to health institutions (e.g. whether any household members did not consult a health worker despite being ill). Currently such information is captured comprehensively in the GHS.
For the living standard dimension, four separate groups of asset ownership indicators may be included: (1) household operation assets such as fridge, stove and washing machine; (2) communication assets such as telephone, computer and internet connection (this was adopted by the 2017 Mushongera et al. study); (3) transport assets such as motor vehicles and motorcycles; and (4) financial assets such as bank account, provident fund and informal savings like stokvel (at present, such information is captured by the GHS).
One may consider adding a second indicator to the economic activity dimension, namely the proportion of working-age population who did not seek work owing to illness, disability, lack of available transport or no money to pay for transport as these reasons relate to deprivation. This indicator was included by Noble et al. (Citation2006, Citation2010) and Noble & Wright (Citation2013), albeit they only considered the illness and disability reasons.
It was mentioned in Section 1 that poverty is associated with physical and social isolation, as well as feelings of vulnerability, powerlessness and helplessness, yet the global MPI, StatsSA MPI and this study did not consider these dimensions. For the physical isolation indicators, some were asked for the first time in CS 2016 (e.g. time taken to the place of work, distance of the main water source from the dwelling) but others were never asked in both Census and CS (e.g. distance to the nearest accessible telephone, time needed to get to the health institution that the household normally visits). Information on social isolation (such as attendance at a health club or religious group, as well as attending parties with families and friends) is thoroughly captured by the All Media Products Survey but hardly in the StatsSA datasets. Therefore, StatsSA may consider including a detailed section on isolation so that a fifth dimension can be added to the SAMPI.
Finally, whilst questions on crime experience, perception of safety, and interruption of water and electricity supply were asked for the first time in CS 2016, questions on other indicators relating to vulnerability, powerlessness and helplessness should also be asked (e.g. home security system, community crime watch unit, life cover policy, disease or death of livestock and crop failure), before this dimension can also be added to improve the construction of the SAMPI further.
Disclosure statement
No potential conflict of interest was reported by the authors.
Notes
1 These programmes include the Reconstruction and Development Program, Growth, Employment and Redistribution, Accelerated and Shared Growth Initiative of South Africa and the more recent New Growth Path and National Development Plan.
2 For more detailed discussion of subjective poverty measures, refer to Govendor et al. (Citation2006) and Jansen et al. (Citation2015).
3 Refer to Yu (Citation2016) for a more detailed discussion.
4 For detailed explanation of this approach, refer to Hirschowitz (Citation2000:76–79).
5 For more information on the Bristol method, refer to Gordon et al. (Citation2003).
6 Van der Walt & Haarhoff (Citation2004) provide a thorough explanation of this composite index approach.
7 This is also the main drawback of the other statistical approaches mentioned in Section 2.
8 In the event where the contribution of poverty by a particular sub-group greatly exceeds its population share, it implies a very unequal distribution of poverty, for example, where females account for only 40% of the total population but contribute 90% to the multidimensional poverty of the country.
9 This means that someone is only included as part of the poor in an indicator if both of these two conditions are met: xi < zi and ci ≥ 1/3.
10 Noble et al. (Citation2006, Citation2010) and Noble & Wright (Citation2013) also used Grade 7 as the threshold.
11 Disability was also included in recent local (Frame et al., Citation2016; Omotoso & Koch Citation2017) and international (e.g. Suppa, Citation2015; Hanandita & Tampubolon, Citation2016; Martinez Jr & Perales, Citation2017) studies.
12 shows the MPI results by municipality. Since the geographical demarcation of municipalities has changed drastically during the 15-year period, this study rather focuses on MPI poverty by DC.
13 For detailed explanation of this approach, see Raghunathan et al. (Citation2001), Lacerda et al. (Citation2008) and Yu (Citation2009).
References
- Adams, C, Gallant, R, Jansen, A & Yu, D, 2015. Public assets and services delivery in South Africa: is it really a success? Development Southern Africa 32(6), 697–710. doi: 10.1080/0376835X.2015.1063986
- Alkire, S & Foster, J, 2011a. Counting and multidimensional poverty measurement. Journal of Public Economics 95(7-8), 476–487. doi: 10.1016/j.jpubeco.2010.11.006
- Alkire, S & Foster, J, 2011b. Understandings and misunderstandings of multidimensional poverty measurement. Journal of Economic Inequality 9(2), 289–314. doi: 10.1007/s10888-011-9181-4
- Barker, F, 2008. The South African labour market: theory and practice. Revised 5th edn. Van Schaik Publishers, Pretoria.
- Bhorat, H, Naidoo, P & Van der Westhuizen, C, 2006. Shifts in non-income welfare in South Africa: 1993–2004. DPRU Working Paper 06/108. Development Policy Research Unit, University of Cape Town, Rondebosch.
- Bhorat, H, Stanwix, B & Yu, D, 2015. Non-income welfare and inclusive growth in South Africa. Africa Growth Initiative Working Paper 18. Brookings Institution, Washington, DC.
- Bhorat, H & Van der Westhuizen, C, 2013. Non-monetary dimensions of well-being in South Africa, 1993–2004: a post-apartheid dividend? Development Southern Africa 30(3), 295–314. doi: 10.1080/0376835X.2013.817308
- Bhorat, H, Van der Westhuizen, C & Goga, S, 2007. Welfare shifts in the post-apartheid South Africa: a comprehensive measurement of changes. DPRU Working Paper 07/128. Development Policy Research Unit, University of Cape Town, Rondebosch.
- Bhorat, H, Van der Westhuizen, C & Yu, D, 2014. The silent success: delivery of public assets since democracy. DPRU Working Paper 201403. Development Policy Research Unit, University of Cape Town, Rondebosch.
- Burger, R, Van der Berg, S, Van der Walt, SJ & Yu, D, 2017. The long walk: considering the enduring spatial and racial dimensions of deprivation two decades after the fall of Apartheid. Social Indicators Research 130(3), 1101–1123. doi: 10.1007/s11205-016-1237-1
- Elwan, A, 1999. Poverty and disability: a survey of the literature. World Bank Working Paper 21315. The World Bank, Washington, DC.
- Finn, A, Leibbrandt, M & Woolard, I, 2013. What happened to multidimensional poverty in South Africa between 1993 and 2010? SALDRU Working Papers 99/2012. Southern African Labour and Development Research Unit: University of Cape Town, Rondebosch.
- Frame, E, De Lannoy, A & Leibbrandt, M, 2016. Measuring multidimensional poverty among youth in South Africa at the sub-national level. SALDRU Working Paper Series Number 169. Southern Africa Labour and Development Research Unit, University of Cape Town, Rondebosch.
- Gordon, D, Nandy, S, Pantazis, C., Pemberton, S & Townsend, P, 2003. The distribution of child poverty in the developing world. University of Bristol, Bristol.
- Govendor, P, Kambaran, N, Patchett, N, Ruddle, A, Torr, G & Van Zyl, N, 2006. Poverty and inequality in South Africa and the world. Actuarial Society of South Africa, Cape Town.
- Hanandita, W & Tampubolon, G, 2016. Multidimensional poverty in Indonesia: trend over the last decade (2003–2013). Social Indicators Research 128(2), 559–587. doi: 10.1007/s11205-015-1044-0
- Haughton, J & Khandker, SR, 2009. Handbook on poverty and inequality. The World Bank, Washington, DC.
- Hirschowitz, R, 2000. Measuring poverty in South Africa. Statistics South Africa, Pretoria.
- Hoogeveen, JG & Özler, B, 2006. Poverty and inequality in post-apartheid South Africa: 1995–2000. In Bhorat, H & Kanbur, R (Eds), Poverty and policy in post-apartheid South Africa. Human Sciences Research Council, Cape Town, 59–94.
- Jansen, A, Moses, M, Mujuta, S & Yu, D, 2015. Measurements and determinants of multifaceted poverty in South Africa. Development Southern Africa 32(5), 151–169. doi: 10.1080/0376835X.2014.984377
- Lacerda, M, Ardington, C & Leibbrandt, M, 2008. Sequential regression multiple imputation for incomplete multivariate data using Markov chain Monte Carlo. SALDRU Working Papers 13/2008. Southern African Labour and Development Research Unit, University of Cape Town, Rondebosch.
- Leibbrandt, M, Poswell, L, Naidoo, P & Welch, M, 2006. Measuring recent changes in South African inequality and poverty using 1996 and 2001 Census data. In Bhorat, H & Kanbur, R (Eds), Poverty and policy in post-apartheid South Africa. Human Sciences Research Council, Cape Town, 95–142.
- Martinez, Jr, A & Perales, F, 2017. The dynamics of multidimensional poverty in contemporary Australia. Social Indicators Research 130(2), 479–496. doi: 10.1007/s11205-015-1185-1
- Mitra, S, Posarac, A & Vick, B, 2013. Disability and poverty in developing countries: a multidimensional study. World Development 41(1), 1–18. doi: 10.1016/j.worlddev.2012.05.024
- Mushongera, D, Zikhali, P & Ngwenya, P, 2017. A multidimensional poverty index for Gauteng province, South Africa: evidence from quality of life survey data. Social Indicators Research 130(1), 277–303. doi: 10.1007/s11205-015-1176-2
- Ngwane, AK, Yadavalli, VSS & Steffens, FE, 2001. Poverty in South Africa in 1995 – a totally fuzzy and relative approach. Studies in Economics and Econometrics 25(1), 77–87.
- Nieftagodien, S. & Van der Berg, S, 2007. Consumption patterns and the black middle class: The role of assets. Stellenbosch Economic Working Papers 02/07. Stellenbosch University, Stellenbosch.
- Noble, M, Babita, M, Barnes, H, Dibben, C, Magasela, W, Noble, S, Ntshongwana, P, Phillips, H, Rama, S, Roberts, B, Wright, G & Zungu, S, 2006. The provincial indices of multiple deprivation for South Africa 2001. Centre for the Analysis of South African Social Policy, Department of Social Policy and Social Work, University of Oxford, Oxford.
- Noble, M, Barnes, H, Wright, G & Roberts, B, 2010. Small area indices of multiple deprivation in South Africa. Social Indicators Research 95(2), 281–297. doi: 10.1007/s11205-009-9460-7
- Noble, M & Wright, G, 2013. Using indicators of multiple deprivation to demonstrate the spatial legacy of apartheid in South Africa. Social Indicators Research 112(1), 187–201. doi: 10.1007/s11205-012-0047-3
- Ntsalaze1, L & Ikhide, S, 2016. Rethinking dimensions: the South African multidimensional poverty index. Social Indicators Research. https://link.springer.com/article/10.1007/ s11205-016-1473-4 Accessed 13 November 2017.
- Omotoso, KO & Koch, S, 2017. Exploring child poverty and inequality in post-apartheid South Africa: a multidimensional perspective. Working Paper 2017–18. University of Pretoria, Pretoria.
- Philip, D & Rayhan, I, 2004. Vulnerability and poverty: what are the causes and how are they related? Centre for Development Research, University of Bonn, Bonn.
- Posel, D & Rogan, M, 2012. Gendered trends in poverty in the post-apartheid period, 1997–2006. Development Southern Africa 29(1), 97–113.
- Qizilbash, M, 2002. A note on the measurement of poverty and vulnerability in the South African context. Journal of International Development 14(6), 757–772. doi: 10.1002/jid.922
- Raghunathan, TE, Lepkowski, JM, Van Hoewyk, J & Solenberger, P, 2001. A multivariate technique for multiply imputing missing values using a sequence of regression models. Survey Methodology 27(1), 85–95.
- Ravallion, M, 1992. Poverty comparisons: a guide to concepts and methods. Living Standards Measurement Study Working Paper No. 88. The World Bank, Washington, DC.
- Ravallion, M, 1998. Poverty lines in theory and practice. Living Standards Measurement Study Working Paper No. 133. The World Bank, Washington, DC.
- Rogan, M, 2016. Gender and multidimensional poverty in South Africa: applying the global multidimensional poverty index (MPI). Social Indicators Research 126(3), 987–1006. doi: 10.1007/s11205-015-0937-2
- Santos, ME & Alkire, S, 2011. Training material for producing national human development reports: the multidimensional poverty Index (MPI). http://www.ophi.org.uk/wp-content/uploads/MPI_TrainingMaterial_23Nov2011.pdf Assessed 13 June 2017.
- Schiel, R, 2012. Money metric versus non-money metric measures of well-being. Unpublished Honours long essay. School of Economics, University of Cape Town, Rondebosch.
- Schultz, PT & Tansel, A, 1997. Wage and labor supply effects of illness in Côte d’Ivoire and Ghana: instrumental variable estimates for days disabled. Journal of Development Economics 53(2), 251–286. doi: 10.1016/S0304-3878(97)00025-4
- Simkins, C, 2004. What happened to the distribution of income in South Africa between 1995 and 2001? Unpublished paper. University of the Witwatersrand, Johannesburg. http://www.sarpn.org/documents/d0001062/P1175-simkins_Nov2004.pdf Accessed 12 July 2017.
- Statistics South Africa, 2012. Subjective poverty in South Africa: findings of the living conditions survey 2008/2009. Statistics South Africa, Pretoria.
- Statistics South Africa, 2013. Men, women and children: findings of the living conditions survey 2008/2009. Statistics South Africa, Pretoria.
- Statistics South Africa, 2014. The South African MPI: creating a multidimensional poverty index using census data. Statistics South Africa, Pretoria.
- Statistics South Africa, 2015. Methodological report on rebasing of national poverty lines and development of pilot provincial poverty lines: technical report. Statistics South Africa, Pretoria.
- Statistics South Africa, 2017. CPI headline index numbers (Dec 2016 = 100). Statistics South Africa, Pretoria. http://www.statssa.gov.za/publications/P0141/CPIHistory.pdf Accessed 17 July 2017.
- Suppa, N, 2015. Towards a multidimensional poverty index for Germany. OPHI Working Paper No. 98. Oxford Poverty & Human Development Initiative (OPHI), University of Oxford, Oxford.
- United Nations, 2008. Official list of MDG indicators. https://www.hgpi.org/handout/ Official%20list%20of%20MDG%20indicators.pdf Accessed 15 November 2017.
- Van der Berg, S, Burger, R, Burger, R, Louw, M & Yu, D, 2005. Trends in poverty and inequality since the political transition. Stellenbosch Economic Working Papers: 1/2005. Stellenbosch University, Stellenbosch.
- Van der Berg, S, Burger, R, Burger, R, Louw, M & Yu, D, 2007. A series of national accounts-consistent estimates of poverty and inequality in South Africa. Stellenbosch Economic Working Papers: 09/07. Stellenbosch University, Stellenbosch.
- Van der Walt, T & Haarhoff, J, 2004. Service delivery indices for municipal water supply. www.waterinfo.co.za/literature/files/080.pdf Accessed 13 November 2017.
- Woolard, I & Leibbrandt, M, 1999. Measuring poverty in South Africa. DPRU Working Paper No. 99/33. Development Policy Research Unit, University of Cape Town, Rondebosch.
- World Bank, 2000. World development report 2000/2001: attacking poverty. The World Bank, Washington, DC.
- World Health Organisation and World Bank, 2011. World report on disability. World Health Organisation, Geneva.
- Yu, D, 2008. The comparability on Income and Expenditure Surveys 1995, 2000 and 2005/2006. Stellenbosch Economic Working Papers: 11/2008. Stellenbosch University, Stellenbosch.
- Yu, D, 2009. The comparability of Census 1996, Census 2001 and Community Survey 2007. Stellenbosch Economic Working Papers: 21/09. Stellenbosch University, Stellenbosch University.
- Yu, D, 2013. Poverty and inequality estimates of National Income Dynamics Study revisited. Stellenbosch University Economic Working Paper: WP05/2013. Stellenbosch University, Stellenbosch.
- Yu, D, 2016. Factors influencing the comparability of poverty estimates across household surveys. Development Southern Africa 33(2), 145–165. doi: 10.1080/0376835X.2015.1120646