?Mathematical formulae have been encoded as MathML and are displayed in this HTML version using MathJax in order to improve their display. Uncheck the box to turn MathJax off. This feature requires Javascript. Click on a formula to zoom.
ABSTRACT
This paper examines whether individual workers’ time-invariant unobservable characteristics influence estimates of the South African union wage premium across the length of the conditional wage distribution. It employs the 2001–7 South African Labour Force survey and a fixed effects quantile regression estimator. Results show a relatively large (small) wage premium at the bottom (top) of the conditional wage distribution when workers’ time-invariant unobserved characteristics are ignored. Accounting for this set of factors substantially reduces the wage premium at all points of the distribution. In fact, the wage premium becomes somewhat constant across the conditional wage distribution, suggesting that unions in South Africa have little wage compressionary effects.
KEYWORDS:
1. Introduction
Studies of the phenomenal high-income inequality in post-apartheid South Africa have accorded significant attention to the wage effect of labour unions. The South African labour union movement originated against a background of racism. In the 1880s, membership was a preserve for whites; non-whites only had participation rights from the 1980s (Bhorat et al., Citation2012). This spurred the historic racial income inequality in the country; whites have a broader endowment set of economic and labour market characteristics than non-whites (Leibbrandt et al., Citation2007). This hierarchy was worsened by broader segregationist policies of the 1948–93 apartheid regime. Hence, labour unions fostered an alliance with political parties in a quest for democracy (Finnemore & van der Merwe, Citation1996:33). The resultant retraction of apartheid, in 1994, was associated with the Labour Relations Act of 1995, which reinforced the union movement by promoting collective bargaining.Footnote1 Following this, unions have exerted considerable influence on the operations of the South African labour market and have been touted as agents for improving marginalised workers’ welfare. This blends well with the notion of ‘collective voice’ that accompanies unionism (Blanchflower & Bryson, Citation2004).
Traditionally, the pivotal role of labour unions has pertained improving wages and working conditions of their members. Through exploiting their monopoly power, unions tend to raise wages above market clearing levels which, in turn, reduce employment levels in the unionised sector (Freeman & Medoff, Citation1984). Given labour market segmentation into union and non-union sectors, job losses in the union sector may result in excess labour supply in the non-union sector, which exerts downward pressure on non-unionised workers’ wages. Labour unions are thus viewed as an anti-competitive force deriving gains at the expense of non-union members, the unemployed, and owners of capital (Reynolds, Citation2008). Following these competing views, a plethora of international (Freeman & Kleiner, Citation1990; Blanchflower & Bryson, Citation2004; Manda et al., Citation2006) and local studies (Moll, Citation1993; Schultz & Mwabu, Citation1998; Butcher & Rouse, Citation2001; Hofmeyr & Lucas, Citation2001; Azam & Rospabé, Citation2007; Banerjee et al., Citation2008; Bhorat et al., Citation2012; Ntuli & Kwenda, Citation2014) empirically explored the wage effect of labour unions. For South Africa, studies unanimously find a union wage premium. However, estimates of the premium are largely inconsistent, ranging from 6% to an excess of 100%.
Particularly, in a study for blacks and whites, Moll (Citation1993) reported a union wage premium of 24% for blacks after correcting for endogeneity of union status. Butcher & Rouse (Citation2001) also found a union premium close to 20%. Their study pioneered the analysis of the bargaining council (BC) wage premium in South Africa, which is usually omitted in most studies due to data issues. The estimations were based on data from the 1995 October Household Survey (OHS) and they considered union status as exogenous. More recently, Bhorat et al. (Citation2012) investigated both the union wage premium and BC wage premium for formal sector workers using Labour Force Survey (LFS) data for 2005. The estimation methods incorporated endogeneity of union status and showed that the union premium can be as low as 6%. Apart from the mean-based studies, some studies carried out an analysis of the union wage premium across the wage distribution. For instance, Schultz & Mwabu (Citation1998) employed data from the 1993 Project for Statistics on Living Standards and Development (PSLSD) and both an ordinary least squares and a quantile regression analysis which treated union status as given. They found a high wage premium of 145% for blacks at the bottom of the wage distribution and 19% at the top.
The near 100% union wage premium for blacks was also found by Azam and Rospabé (Citation2007), who used 1999 OHS data to explore the case for white and African men. The study utilised treatment effects and endogenous switching regression models.Footnote2 These techniques were also employed in an earlier study by Hofmeyr & Lucas (Citation2001), in addition to multinomial logit models to control for selection into an employment sector. The latter were particularly focussed on changes in non-casual non-self-employed workers’ union premium between 1985 and 1993. In this period there was an increase in union membership for Africans, linked to transitioning from the apartheid era. Although inconsistent in magnitude, the results revealed a temporal increase in the premium. This trend was also uncovered by Banerjee et al. (Citation2008), who reported an increase in the union premium between 1995 and 2004 from 14% to 23%. Data for the analysis included OHSs for 1995 and 1998 and LFSs for 2000 and 2004. On the contrary, Ntuli & Kwenda (Citation2014) found a temporal decline in the premium over the period 2001–10. Using the LFSs for 2001–10 and endogenous switching regression models, they reported a premium of 54% in 2004, which subsequently decreased to 48% then 42% in 2007 and 2010, respectively. Nonetheless, the study did not go further to elucidate reasons for the decline. Taken together, these studies present a wide range of estimates of the South African union wage premium. This could be a relic of different data samples and marked methodological differences, in which some of these methods were proven to be plausibly unreliable (Wittenberg, Citation2014).
Such a wide range of estimates instils doubt in policy makers on whether unions pose a serious threat to labour market efficiency and on appropriate policies. In particular, an overemphasised union wage effect could lead policy makers into needlessly designing policies to dampen union influence. However, if the effect is underestimated, unions could be left autonomous, leading to labour market distortions and inefficiencies.
A more accurate characterisation of the South African union wage premium is hampered by failure to satisfactorily deal with the problem of selection associated with union membership. Indeed, if, for instance, unionised workers have better unobservable characteristics relative to the non-unionised, ignoring these factors potentially yields upwardly biased estimates. Most South African studies leave this issue unaddressed (e.g. Schultz & Mwabu, Citation1998; Butcher & Rouse, Citation2001) due to data constraints, while some (e.g. Moll, Citation1993; Hofmeyr & Lucas, Citation2001; Ntuli & Kwenda, Citation2014) attempt to correct for potential bias by modelling union status determination simultaneously with earnings. The Heckman (Citation1979) type estimator used in these studies often relies on a variable for union membership of other household members as an exclusion restriction. Generally, this exclusion restriction is untestable and, more importantly, its validity has been recently questioned and shown to be logically inconsistent (see Wittenberg, Citation2014).
Against this background, this study seeks to deepen our understanding of the union wage effect in South Africa by exploiting recent methodological advancements and a large rotating panel dataset. Specifically, this study accounts for potential bias in the estimates by accounting for workers’ time-invariant unobserved characteristics, which might be correlated with both wages and union membership. Individual time-invariant characteristics are thought-out within the framework of the labour market setting. Here, unobserved characteristics are not declared to be permanent, but rather they are assumed to be fixed/invariant for a period of time, e.g. one year. While Casale & Posel (Citation2011) adopt a similar approach, this study extends their mean-based analysis by providing a distributional analysis using fixed effects quantile regressions (FE-QR), proposed by Koenker (Citation2004). A distributional analysis unpacks the union wage premium across the length of the wage distribution, which is of particular importance within the South African context, in which there are high levels of inequality. Essentially, some union wage regulation policies attribute wages to jobs rather than to individuals; as per the principle of fair wages (Bryson, Citation2014). This is driven by unions’ desire to maximise their members’ income regardless of possible job losses. This, coupled with union efforts against wage discrimination, is expected to result in wage compression, which in-turn reduces overall wage dispersion (Bryson, Citation2014). This effect is masked by mean estimates and is difficult to identify the presence of worker sorting. By using panel data models within the quantile regression framework, the present study contributes to an old debate on union wage effects. The adopted approach purges estimates of workers’ unobserved time-invariant heterogeneity and provides some evidence on whether South African unions have wage compressionary effects.
The rest of this paper is structured as follows. In Section 2, we discuss the methodology and data, while Section 3 presents the results and robustness checks. Section 4 concludes.
2. Methodology and data
2.1. Methodology
To identify the distributional effect of unions on wages, our analysis complements previous South African studies that rely on (OLS and Fixed effects; FE) mean estimates by extending them to the quantile regression framework. We specify the following pooled quantile regression model:(1)
(1) where
is the
conditional quantile of log wages for worker i, i.e. 9874 males and 6567 females at time t = 13 waves of biannual Labour Force Surveys for 2001–7;
is the estimated rate of return at the
quantile of workers’ observable characteristics in
(i.e. age, marital status, education, tenure, race, and region);
is a dummy variable taking the value of 1 if person i is a trade union member at time t and 0 otherwise. The estimated coefficient of interest
is a measure of the conditional union wage premium at the
quantile. Although Equation (1) controls for a rich set of workers’ observable characteristics, its estimates are potentially biased due to worker’s unobserved heterogeneity (e.g. inherent preference and ability), which might be correlated with both the wage and union membership. If these unobservables are time-invariant, they can be easily accounted for by exploiting the panel structure of our dataset. We estimate the following model:
(2)
(2) where
is individual i’s time-invariant characteristics;
captures time-effects;
and
are as previously defined. Following Koenker (Citation2004), the individual effect is specified as a pure location shift effect, as estimating a distributional individual effect is unreasonable in short panels. As discussed in detail by Koenker (Citation2004), solving Equation (2) for several quintiles simultaneously with a large N and T is difficult. Accordingly, we apply the simplified two-step procedure suggested by Canay (Citation2011) and recently applied by Bargain & Kwenda (Citation2011, Citation2014) and Nguyen et al. (Citation2013). In step 1, we estimate
using a standard FE estimator, which is used to transform the response variable as follows:
. The transformed response variable is then used in traditional quantile regressions in step 2. We note that the methodology adopted herein to identify
relies on union status variation.Footnote3 Although this is standard, it is important to note that estimates could be biased if ‘sectoral movers’ are substantially different from ‘sectoral stayers’, and the number of transitions should be reasonably large. A series of robustness checks are conducted to assess the sensitivity of our results to these issues as well as the problem of attrition. We complement our results by also estimating the mean analogues of Equatiosn (1) and (2).Footnote4
2.2. Data
The data are obtained from the 2001–7 bi-annual LFS conducted by Statistics South Africa (Stats SA). This is a nationally representative household panel survey containing detailed information on resident individuals’ demographics, job characteristics, and earnings. The LFS has a 20% rotation structure bi-annually. Consequently, the LFS used for this study consists of two panels pooled together. The first panel runs from 20013 and the other panel runs from 2004–7; the time dimension of the panel comprises 13 waves of data and the i pertains to an individual worker. Notably, the LFS panel follows households (not individuals) over time, thus households are identified over time but individuals are not. The panel for 2001–3 provided by Stats SA consists of a unique person identifier that can be used to link files across waves. However, the 2004–7 panel does not have an individual identifier. It is constructed by linking persons within the households over time based on gender, race, and age as recently applied by Badaoui et al. (Citation2008) and Bargain & Kwenda (Citation2011, Citation2014). Overall, the attrition rate from this process is about 28%; the associated potential biases of non-random attrition will be examined in the robustness checks section.
The study focuses on men and women aged between 16 and 65 in full-time employment in the formal sector with full information on our key variables. The final sample excludes informal sector workers and the self-employed, which are ineligible for union membership. Also for the self-employed, earnings are difficult to evaluate. Our final sample consists of 9874 men with 25 526 panel observations and 6547 women with 20 748 panel observations. Our key variable, union membership, is based on self-reported union membership status. Regrettably, the survey does not provide information on workers covered by BCs. This omission might bias our estimates as BC agreements, to some extent, affect wages of non-union members. Nonetheless, results based on the union membership variable are expected to provide some reasonable insights: Butcher & Rouse (Citation2001) report that a small proportion of non-unionised workers are covered by BC agreements. Hourly wages are derived from reported gross earnings and weekly hours usually worked in the main job. Wages are deflated to reflect 2001 values using the consumer price index obtained from Stats SA. presents descriptive statistics for our final sample.
Table 1. Descriptive statistics.
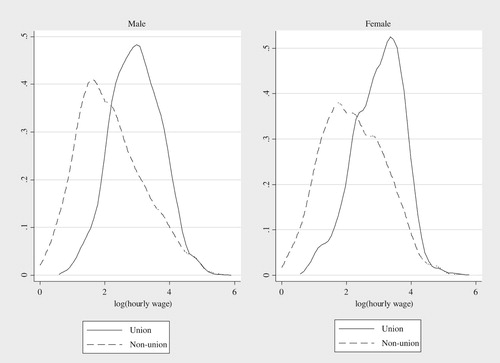
Relative to non-unionised workers, wages for unionised men (women) are 79% (82%) points higher, on average. Unionisation rates are fairly similar across gender, i.e. 42% for women and 44% for men. As expected, unionisation rates are higher in the public sector compared to the private sector. To further explore the wage distribution across sectors, presents the kernel density functions for log wages by gender. Clearly, the wage distribution in the union sector is different from that in the non-unionised sector for both men and women. The distribution of wages in the unionised sector is more peaked and exhibits less dispersion than that of the non-unionised.
Figure 1. Kernel Density Functions by gender.
Regarding other characteristics, we observe that unionised workers are older, mostly African, and married with relatively longer tenure periods. The unionised sector’s education distribution is superior to that of the non-unionised sector: 27% of unionised men have tertiary education compared to 20% of non-unionised men, while this applies to 40% and 24% of unionised and non-unionised women. Consistent with the education distribution, the union sector has a high proportion of workers in senior occupations (e.g. managers, professionals, technical and associate professionals), while a high portion of non-unionised workers are mainly in lower level occupations.
Intuitively, unionisation rates are higher in large firms compared to smaller firms. For men, the top three industries in the unionised sector are social services, manufacturing, and mining. The corresponding industries for women are social services, manufacturing, and wholesale and retail. There is considerable temporal and spatial variation in unionisation rates, as shown in .
3. Empirical results
3.1. Baseline results
presents estimates for θ (the union-wage premium) obtained from OLS, pooled QR, FE, and FE-QR models for men and women. Full regression results for these models and selected quantiles are presented in Tables in the Appendix. We start by discussing the baseline results for men followed by those for women. This is then followed by a discussion of results from various robustness checks. In the discussion, the bottom of the conditional wage distribution refers to the 10th percentile while the top is 90th percentile.
Table 2. Baseline results of the union-wage premium.
3.1.1. Results for men
OLS estimates in show a union wage premium of 25% on average. While this estimate falls within the range of previous South African estimates of 6–123%, it is of the same order with the estimates of Moll (Citation1993) and Barnajee et al. (Citation2008). Extending the analysis to various points of the distribution using pooled-QR, we find a wage premium that varies considerably along the conditional wage distribution: a large wage premium of 39% at the bottom and a comparably smaller premium of 12% at the top. Given that OLS and pooled QR suffer from omitted variable bias stemming from unobserved characteristics, fixed effects estimates provide a more refined measure of the premium. After accounting for time-invariant worker heterogeneity, results show a significant reduction in the wage premium across all points of the conditional wage distribution. On average, the wage premium decreases by 14% points. This finding extends to the entire distribution: i.e. at the bottom the wage premium is reduced by 22% while the top is reduced by 4% points. This suggests positive selection into the unionised sector and shows the non-trivial role of unobservables in explaining the union wage gap.
A common finding in previous studies is that unions have a compressionary effect on wages in South Africa (Moll, Citation1993; Schultz & Mwabu, Citation1998). Our results are at odds with this: the strong compressionary effect exhibited by pooled QR estimates (i.e. large premium at bottom and small premium at top) disappears when time-invariant unobservable characteristics are accounted for. This is confirmed by the fact that the 95% confidence intervals of the FE and FE-QR estimates overlap, except at the 10th percentile. Arguably, the existence of a strong wage compression effect reported in previous South African studies appears to be an artefact of the failure to control for workers’ time-invariant unobserved heterogeneity, inter alia.
Now turning to the effects of other covariates, Tables and in the Appendix present OLS and FE estimates for the mean and selected points of the wage distribution. Generally, accounting for unobserved time-invariant worker heterogeneity tends to reduce the coefficients for most estimates. These variables could be capturing unobservable attributes such as ability, intrinsic motivation, or degree of risk aversion, which could be correlated with some of our covariates. We find an inverted U-shaped relationship between wages and tenure and the effect is somewhat constant across the distribution. This finding also applies to age; however, the effect of age on wages is much stronger than that of tenure. Marital status is positively related with wages; its effects become much smaller and only significant at the median. After controlling for unobservable characteristics, the firm size premium initially uncovered is eroded and in some cases becomes a penalty. We find that the public-sector wage premium becomes considerably smaller after controlling for unobservable characteristics, from 21% to 1.7% at median. Only workers in the mining sector tend to have significantly higher wages than those in the social services sector.
3.1.2. Results for women
Similar to the findings for men, we find a considerable union wage premium of 30% for women, on average, when ignoring unobserved worker characteristics. Accounting for time-invariant unobserved individual effects reduces the wage gap, on average, to 11%, suggesting positive selection into the unionised sector. Again, these results indicate that unobserved worker heterogeneity explains a substantial amount of the union wage premium in South Africa. Extending the analysis to the entire distribution, we find some evidence of wage compression in the pooled QR estimates; there is a considerable union wage effect of 43% at the bottom and 12% at the top, which is statistically different from the mean estimate. However, this compressionary effect disappears once workers’ time-invariant unobserved characteristics are accounted for. The wage premium is reduced by 29% points at the bottom and 5% points at the top, which translates to over 50% of the union wage premium. Notably, once time-invariant unobserved characteristics are accounted for, the union wage premium across the (conditional) distribution is not statistically different from the mean (FE) estimates. Based on these results, we find no compelling evidence for union wage compression effects among women.
Regarding the effect other covariates, Tables and in the Appendix present OLS and FE estimates for the mean and selected points of the distribution. We find that tenure and age tend to increase wages, but at a decreasing rate, and that the effects exhibit little variation across the distribution. We note that the effect of age on wages is relatively stronger compared to that of tenure; a similar finding with that for men. Marital status has a positive and significant effect on wages in the first half of the distribution when accounting for worker’s unobserved heterogeneity. We find a firm size premium which is largely statistically significant at the median. While the results for industry are mixed, we find a public-sector wage premium in the range 7–11%. The presence of a public-sector wage premium is in line with findings from previous studies (e.g. Woolard, Citation2002; Ntuli & Kwenda, Citation2014).
3.2. Robustness checks
The identification strategy adopted in this analysis relies on ‘sectoral-movers’, defined as individuals who move from union to non-union sector and vice versa. While this is standard, this can potentially yield biased estimates if ‘sectoral-movers’ are few and considerably different from ‘sectoral-stayers’. Also, if observed sector changes are merely due to measurement error rather than actual sector transitions, our results will be potentially biased. An additional concern is the problem of attrition: non-random attrition might also result in biased estimates. A further issue is that the identification of the union wage premium is based on both movers into and out of unions. There could be asymmetric effects in our estimates, i.e. a wage premium identified on movers into the unionised sector might be substantially different from that identified based on movers out of the unionised sector. In what follows, we examine the robustness of our estimates to these issues.
3.2.1. Examining movers
To examine if our identification is based on a reasonably adequate number of ‘sectoral-movers’ who are not considerably different from ‘sectoral-stayers’, we first assess the extent of sectoral transitions in our sample. We find a considerable rate of sectoral transitions: sectoral movers constitute about 30% in the sample of men. A similar sectoral transition rate is observed among women. Of these, about 9% report multiple sectoral changes. Given that multiple transitions could be reflective of measurement error, we re-run our baseline model on a sample that excludes multiple movers. Results from this exercise are presented in Table in the Appendix. Compared to baseline estimates, the wage premium obtained when excluding multiple movers is slightly larger, although the difference is generally statistically insignificant. This result applies for both men and women. Thus, the inclusion of multiple-movers in the analysis does not alter results significantly.
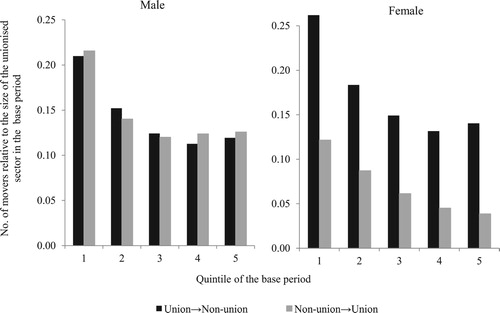
Next, given that estimates will be biased if movers are too specific, e.g. located at the lower end of the distribution or too different from non-movers, we assess the distribution of movers at various points of the wage (unconditional) distribution. in the Appendix presents the number of movers in and out of the union sector. The proportion of movers is computed as the number of movers divided by the size of the unionised sector in the base period. The base period is the time period in which the worker is first observed. Reassuringly, movers appear to be spread throughout the distribution, although movement tends to be marginally higher at the bottom. Notably, de-unionisation rates across quintiles appear to be higher than unionisation rates, particularly for women.
To check if the characteristics of movers are significantly different from those of non-movers, we estimate a probit model with the dependent variable equal to 1 if a worker changes sector and 0 otherwise. Results are presented in Table in the Appendix. Of the variables that are statistically significant, marriage tends to increase the probability of transitioning among women. African men and coloured women are less likely to transition relative to whites. Firm size tends to have a positive effect on probability of transitioning, regardless of gender. Regarding industry of employment, we find that men in agricultural (manufacturing and financial services) are less likely to transition between the unionised and non-unionised sector. For women, those in the agriculture and construction (mining, manufacturing, wholesale and retail, transport and communication) are less likely to change union status. Workers in other provinces are generally less likely to change union status compared to those in the Gauteng province. Overall, the variables in our model only explain about 2–3% of the total variation in transition status for both men and women. This suggests that ‘sectoral-movers’ are not extremely different from ‘non-movers’ in terms of their observed characteristics, which is encouraging.
3.2.2. Attrition
The attrition rate uncovered for this data is about 28%. As highlighted earlier, our results could be biased due to non-random attrition. We check the sensitivity of our results to this possibility by re-incorporating attriters into the analysis. Given that we require at least two observations per individual for the estimation of panel data models, we can only re-estimate the pooled QR using a sample that includes attriters. Accordingly, we compare our results from this exercise to those obtained in our baseline pooled QR. Results in in the Appendix are reassuring. For men, we find no significant differences between the baseline estimates and those obtained after re-incorporating attriters into the analysis. The same result applies to women.
3.2.3. Asymmetric effects
in the Appendix presents results when checking the aforementioned asymmetric effects, i.e. the union wage premium separately identified on movers into and out of unions. We note that the union wage premium based on movers into the unionised sector is consistently higher than that identified based on movers out of unions, for men. The difference is statistically significant at all points of the conditional wage distribution except for the 10th percentile. Compared to the baseline estimates, which uncovered a union wage premium in the range 8–17% for men, the union wage premium identified using movers into the unionised sector is higher, i.e. 11–19%, while that identified based on movers out of the sector is much smaller, i.e. 6–16%. This result suggests the possibility of negative shocks for workers moving out of the unionised sector. For women, there is no evidence of asymmetrical effects, as the differences in the union wage premium identified on the basis of movers into and out of the unionised sector is not statistically significant. Thus, our baseline estimates are not sensitive to whether a worker is unionising or de-unionising.
4. Conclusion
The present study revisits the topic on effect of unions on wages in South Africa, with the aim of providing a distributional analysis while accounting for workers’ time-invariant unobserved heterogeneity. While previous studies have also accounted for unobservables, they have been limited to mean regression. Acknowledging the possibility of different union-wage effects at various points of the distribution, i.e. wage compression, this study utilised the 2001–7 LFS panel data and exploits recent advances in methodology, i.e. FE-QR, to estimate the union wage premium.
Consistent with previous studies, we find a sizeable wage premium when workers’ time-invariant unobserved heterogeneity is ignored. However, accounting for this set of characteristics considerably reduces the wage premium by 55% for men and 65% for women, on average. Estimations of the FE-QR model yield a wage premium in the range 8–10% for men; a considerable reduction from the 12–39% obtained from pooled QR. Corresponding estimates for women are 8–14% from the FE-QR and 12–43% from pooled QR. Evidently, there is positive selection into the unionised sector and this tends to explain a considerable portion of the union-wage premium in South Africa. An additional key finding of our analysis is that the wage premium is fairly constant at various points of the conditional wage distribution once time-invariant unobserved characteristics are accounted for. Thus, we do not find compelling evidence for wage compression in the unionised sector. In fact, we argue that the compressionary wage effects previously uncovered are partly an artefact of the failure to account for workers’ time-invariant unobserved heterogeneity. This finding is consistent with Ntuli & Kwenda (Citation2014), who also find weak compressionary effects using a different methodology. Overall, we conclude that unions have a modest between-sector wage disequalising effect and little wage compressionary effects in South Africa. Consequently, unions have room to contribute towards inequality reduction through initiatives that promote wage compression.
Although this study sheds more light on the distributional wage effects of unions in South Africa, it is not without limitations. The data at use does not have information on BCs, which are an important complement to unions in South Africa. The ‘total’ union wage premium can be perceived as a sum of the BC premium and union premium. Hence, studies which exclude the BC premium tend to underestimate the wage premium for union workers and overestimate the non-union wage. Non-union members who benefit from BCs will have higher wages compared to when there are no BC spillover effects. Therefore, our estimates could be biased by failure to control for BCs; however, the net effect of the bias remains an empirical question. At best we urge the reader to treat our results and conclusions with caution.
The study also accounts only for time-invariant unobserved worker heterogeneity. We acknowledge that selection into unions might be driven by time-varying characteristics which are not accounted for in this analysis. A consequence of this would be an over-estimation of the wage premium if unionised workers have better unobserved time varying characteristics relative to non-unionised workers. Future studies could benefit from exploring these issues further.
Disclosure Statement
No potential conflict of interest was reported by the author(s).
Notes
1 The collective bargaining system has two structures: i.e. individual unions bargaining at the plant level on behalf of their workers and centralised bargaining councils (i.e. registered unions and employer associations) within a particular industry, occupation or area (Casale & Posel, Citation2011). A unique feature of the bargaining council agreements is that they can be extended to non-parties by the Minister of Labour. However, in practice the system has leeway for non-parties to obtain ministerial exemptions from the conditions (Bhorat et al., Citation2012).
2 A treatment effects model assumes that unions only have an intercept effect on wages. An endogenous switching model allows slopes to vary between union and non-union wage models (Casale and Posel, Citation2011).
3 For a detailed discussion on identification, see Bargain & Kwenda (Citation2011) for an illustrative two-period example, and for additional discussions on the limitation of this approach see also Freeman (Citation1984).
4 The corresponding mean analogue of Equation (1) estimated by pooled OLS is: and the corresponding mean analogue of Equation (2) estimated by FE regressions is:
.
References
- Azam, J & Rospabe, S, 2007. Trade unions vs statistical discrimination: theory and application to post-apartheid South Africa. Journal of Development Economics 84(1), 417–444. doi: 10.1016/j.jdeveco.2005.12.005
- Badaoui, E, Strobl, E, & Walsh, F, 2008. Is there an informal employment wage penalty? evidence from South Africa. Economic Development and Cultural Change 56(3), 683–710. doi: 10.1086/533550
- Banerjee, A, Galiani, S, Levinsohn, J, Mclaren, Z & Woolard, I, 2008. Why has unemployment risen in the New South Africa. Economics of Transition 16(4), 715–740. doi: 10.1111/j.1468-0351.2008.00340.x
- Bargain, O & Kwenda, P, 2011. Earning structure, informal employment, and self-employment: new evidence from Brazil, Mexico, and South Africa. Review of Income and Wealth 57(1), S100–S122. doi: 10.1111/j.1475-4991.2011.00454.x
- Bargain, O & Kwenda, P, 2014. The informal sector wage gap: New evidence using quantile estimations on panel data. Economic Development and Cultural Change 63(1), 117–153. doi: 10.1086/677908
- Bhorat, H, Goga, S & van der Westhuizen, C, 2012. Institutional wage effects: revisiting unions and bargain council wage premia in South Africa. South African Journal of Economics 80(3), 400–414. doi: 10.1111/j.1813-6982.2011.01306.x
- Blanchflower, DG & Bryson A, 2004. What effect do unions have on wages now and would freeman and medoff be surprised? Journal of Labor Research 25(3), 383–414. doi: 10.1007/s12122-004-1022-9
- Bryson, A, 2014. Union wage effects. IZA World of Labor 2014:35.
- Butcher, KF & Rouse, CE, 2001. Wage effects of unions and industrial council in South Africa. Industrial and Labor Relations Review 54(2), 349–374. doi: 10.1177/001979390105400209
- Canay, IA, 2011. A note on quantile regression for panel data models. Department of Economics, Northwestern.
- Casale, D & Posel, D, 2011. Unions and the gender wage gap in South Africa. Journal of African Economies 20(1), 27–59. doi: 10.1093/jae/ejq029
- Finnemore, M & van der Merwe, R, 1996. Introduction to labour relations in South Africa. Butterworth, South Africa.
- Freeman, RB, 1984. Longitudinal analyses of the effects of trade unions. Journal of Labor Economics 2(1), 1–26. doi: 10.1086/298021
- Freeman, RB & Kleiner, MM, 1990. The impact of new unionization on wages and working conditions. Journal of Labor Economics 8(1), S8–S25. doi: 10.1086/298243
- Freeman, RB, & Medoff, JL, 1984. What do unions do? Basic Books, New York.
- Heckman, J, 1979. Sample selection bias as a specification error. Econometrica 47, 153–161. doi: 10.2307/1912352
- Hofmeyr, JF & Lucas, R, 2001. The rise in union wage premium in South Africa. Labour (committee. on Canadian Labour History) 15(4), 685–719.
- Koenker, R, 2004. Quantile regression for longitudinal data. Journal of Multivariate Analysis 91(1), 74–89. doi: 10.1016/j.jmva.2004.05.006
- Leibbrandt, M, Woolard, I & Woolard, C, 2007. Poverty and Inequality Dynamics in South Africa: Post-Apartheid Developments in the Light of the Long Run Legacy. Working Paper 11-13, IPC-DRCLAS, Brasilia.
- Manda, DK, Bigsten, A & Mwabu, G, 2006. Trade union membership and earnings in Kenya manufacturing firms. Applied Economics 37, 1693–1704. doi: 10.1080/00036840500118903
- Moll, PG, 1993. Black South African unions: relative wage effects in international perspective. Industrial and Labor Relations Review 46(2), 245–261. doi: 10.1177/001979399304600203
- Nguyen, HC, Nordman, CJ & Roubaud, F, 2013. Who Suffers the Penalty? A Panel Data Analysis of Earnings Gaps in Vietnam. Working Paper No. 7149, the Institute for the Study of Labor (IZA), Bonn.
- Ntuli, M & Kwenda, P, 2014. Labour unions and wage inequality among African Men in South Africa. Development Southern Africa 31(2), 322–346. doi: 10.1080/0376835X.2013.872984
- Reynolds, M, 2008. Labor Unions. The Concise Encyclopedia of Economics: Library of Economics and Liberty.
- Schultz, TP & Mwabu, G, 1998. Labor unions and the distribution of wages and employment in South Africa. Industrial and Labor Relations Review 51 (4), 680–703. doi: 10.1177/001979399805100407
- Wittenberg, M, 2014. Union selection effects – some inconsistent models. SALDRU Working Paper Series No. 133, University of Cape Town, Cape Town.
- Woolard I, 2002. A Comparison of wage levels and wage inequality in the public and private Sectors, 1995 and 2000. Development Policy Research Unit, Working Paper 02/62.
Appendix
Table A1. OLS and pooled QR results (baseline): male.
Table A2. FE and FE-QR results (baseline): male.
Table A3. OLS and pooled QR results (baseline): female.
Table A4. FE and FE-QR results (baseline): female.
Table A5. FE-QR results, excluding multiple movers.
Table A6. Probit, union movers.
Table A7. Pooled QR estimates, attrition robustness check.
Table A8. Checking for asymmetrical effects.
Figure A1. Distribution of movers.