
ABSTRACT
This study explores the labour market linkages between the informal and formal sectors, using the first four waves of the National Income Dynamics Study data. The main focus is on three groups of employed: worked in the formal sector in all waves; worked in the informal sector in all waves; moved between the two sectors across the waves. Only 27% of informal sector workers in wave 1 transitioned to the formal sector in wave 4; 38% remained in the informal sector while 33% had their status changed to either inactive or unemployed. The econometric analysis indicates that older and more educated individuals living in urban areas and coming from households with fewer old-age grant recipients are significantly more likely to work in the formal sector, whereas more educated white males are associated with a significantly greater likelihood of transitioning from informal to formal sector employment.
1. Introduction
Since Hart (Citation1973) first introduced the concept ‘informal sector’, there have been many studies about the definition of the informal economy and informal sector, the characteristics and work activities of the informal sector workers. As a developing country, South Africa's informal sector is an international outlier (Kingdon & Knight, Citation2004:392) due to its relative smallness. The country's informal sector employment size has been fluctuating around the 2.0–2.5 million ranges. These workers are predominantly self-employed Africans who did not complete Grade 12 (Matric), engaging in wholesale and retail activities in Eastern Cape, KwaZulu-Natal and Gauteng, and earning less than R1000 per month in 2000 prices (equivalent to about R2600 in 2017 prices) (Essop & Yu, Citation2008a).
Measuring the informal sector employment size and examining the personal and work characteristics of the workers in this sector only provide a static analysis. It is because such analysis does not examine an individual worker's movement between the two sectors, and the final labour market outcome of workers who exited the informal sector. There are rarely local studies examining the formal-informal sector labour market linkages by adopting a dynamic approach to track the work activities of the workers over time.
This study is the first one using the balanced panel component of the four available waves of the National Income Dynamics Study (NIDS) data to examine the formal/informal labour market transitions (if any) of the workers. The study also contrasts the demographic, education and work characteristics of various categories of workers, for example, individuals who remained in the formal sector for the entire duration as opposed to those who moved between the two sectors. Various regressions are conducted to examine the impact of various personal- and household-level characteristics on labour market transitions across the waves.
2. Literature review
2.1. Conceptual framework
Linkages mean connections and movements of information or resources between two or more units (Arimah, Citation2001:117). In this study, these units are the formal and informal sectors, while formal-informal sector linkages examine the nature of relationship between these sectors. Some of these linkages are discussed below.
An intra-sector linkage refers to the manner in which the two sectors interact within an industry (Budlender et al., Citation2001). The first approach characterises which industries are more formal and which are more informal. Valodia & Devey (Citation2011:6) suggest that the higher the proportion of informal activities in an industry, the more likely a linkage exists between formal and informal activities. In contrast, total production is decomposed into production arising from each sector in the input-output approach (Naidoo et al., Citation2004).
Forward and backward linkages may exist between the two sectors: forward linkages mean utilising an informal sector's products as an input in the formal sector's production procedure; backward linkages mean the supply of essential inputs from the formal sector for production in the informal sector (Chen, Citation2012:12). Forward linkages are more beneficial to the informal sector as any excess supply of goods and services is absorbed by the formal sector. Backward linkages are exploitable to informal sector, as the formal business may control the price and supply of an input to manipulate the informal business to comply with its demand, especially if the former is the sole producer of the input (Arimah, Citation2001:119).
Both linkages can occur through individual transactions, sub-sector network or a value chain. Chen (Citation2012:12) explains that the nature of production system determines ‘allocation of authority and risk between the informal and formal firm’. The exchange of goods and services in an individual transaction is a pure market exchange where the formal firm usually has superior knowledge and power and thus controls the market exchange. The sub-sector network is associated with a succession of transactions with customers and sellers by individual firms, with the informal firms exchanging goods and services with formal firms. Lastly, value chains occur when subcontracted informal firms produce within a value chain, with a lead firm governing all the transactions.
Two more linkages deserve some discussion (Pagura & Kirsten, Citation2006:5): direct financial linkages exist where a formal financial institution aids an informal institution by broadening the latter's source of funding to cover its short-term liquidity issues; facilitation linkages occur when the formal institution employs the informal firm to act as an intermediary to facilitate transactions between its informal sector clients and the formal firm which it represents, and vice versa. Facilitation linkages are an alternative to micro and rural firm financing as the formal firm facilitates loans, provides payment for utilities and mobilises deposits for the informal firm.
Churning, or worker flows, means the migration of workers in and out of jobs, and is concerned with the creation and destruction of jobs for a given period (Tattara & Valentini, Citation2004:3). Churning can also be interpreted as equilibrium between the decision made by employers and employees on job matches (Davis & Haltiwanger, Citation1999). For this study, churning is based on ‘job-to-job flows’, or the movement of workers between formal and informal sector jobs rather than movement between formal jobs.
Churning arises from the workers quitting their jobs to search for better employment elsewhere. Churning also results from the hiring and firing practices of employers to improve productivity or aid with the firm's business expansion or contraction (Tattara & Valentini, Citation2004). For example, the degree of screening before hiring affects the churning rate. Firm size affects the rate of churning as a smaller firm's available resources may limit the quality of its human resources (Burgess et al., Citation2001:9). This in turn affects the quality of matching between the worker's productivity and firm's production, probably resulting in informal work matched with lower-productivity labour (Topel & Ward, Citation1992). If the initial matches are accurate, the extent of labour churning decreases (Hyatt & Spletzer, Citation2013:26).
Churning is examined on an aggregate or individual basis. The former approach analyses the net worker flow effects on revenue for each business, while the latter approach tracks the movement (if any) of each individual worker between the two sectors. The analysis of churning is most commonly viewed from the perspective of the business, which can control the job exit rate by ‘its wage policy or by making the workplace more or less attractive in a subtle way’ (Alda et al., Citation2005:10–11).
The businesses in the informal sector are usually small in size, thereby providing less attractiveness for a long-term career prospect (Alda et al., Citation2005:11). Informal work is usually low-paid and low-skilled with limited opportunities for human capital formation and sustainable employment (Worth, Citation2005:408). Therefore, Rix et al. (Citation1999) suggest informal workers are stuck in a ‘churning trap’ as informal jobs provide little training transferable to future jobs and insufficient income to invest in quality education. Hyatt & Spletzer (Citation2013:14) argue that labour market frictions add to the cost of job searching and thus discourage labour market movements. Spatial mismatch adds to the cost of job search, as most individuals only seek employment in nearby areas so that they would not incur high relocation and transport costs (Van Ham et al., Citation2001:1737).
Finally, formal-informal sector linkages may occur within a household (Valodia & Devey, Citation2011:13), for instance, a formally employed household member can sponsor or assist the informal self-employed activities of another member. Thus, financial capital and human capital are transferred from the formal to the informal sector within the household.
2.2. Review of past empirical studies
While there is an abundance of studies adopting various methods to define and measure informal employment and investigate the characteristics of informal workers (e.g. Muller, Citation2003; Devey et al., Citation2006; Heintz & Posel, Citation2008; Essop & Yu, Citation2008a, Citation2008b; Yu, Citation2012), there are few studies on the formal-informal sector labour market linkages. Budlender et al. (Citation2001) examined intra-sectoral linkages with the 2000 Time Use Survey and Labour Force Survey (LFS) data, to measure the monetary contribution of informal activities in each broad industry category; the contribution was the largest in trade (26.3%), construction (18.3%) and community services (18.0%) industries. Naidoo et al. (Citation2004), using various household surveys, found that informal sector production in the traded sector comprised 33% of total production, while this share was 15.4% and 12.7% in construction and manufacturing respectively, thereby supporting the findings of Budlender et al. (Citation2001).
Research by Skinner (Citation2005) and Valodia and Devey (Citation2011) on forward and backward linkages investigated the source of supply of inputs utilised in production by informal firms. Their calculations were based on a 2002 primary survey of informal enterprises in the Greater Durban area. These studies found that 42% of informal businesses listed ‘medium to large enterprises’ as the primary source of their inputs, while 98% of informal businesses sold their products and services to private consumers and households.
Cichello et al. (Citation2014) examined labour market transition between the first two waves of NIDS. Despite the fact that the study did not distinguish between formal and informal sector workers, for the males employed in wave 1, 77.5% remained employed in wave 2, but this proportion was lower for the female workers at 65.4%. Ingle & Mlatsheni (Citation2016) investigated labour market transition of youth (15–34 years) using the balanced panel of the first four waves of NIDS. For those employed in wave 1, only 50.6% were employed in all four waves. A significant degree of churning happened, as the majority of youth moved between different labour market status categories across the four waves. The econometric analysis found that older workers residing in urban areas with regular employment in wave 1 were significantly more likely to be employed in all waves.
Using a multinomial logistic model and the 2008–2009 Quarterly Labour Force Survey (QLFS) data, Verick (Citation2010) predicted the probability of each labour force status (inactive, formal employment, informal employment, searching unemployed, discouraged workseekers). Married Africans with low educational attainment were significantly less likely to work in the formal sector, while Africans without post-Matric qualification were associated with a significantly greater likelihood of being informal sector workers.
In one of the three rare panel data studies with some focus on movement between the formal and informal sectors, Valodia & Devey (Citation2011) exploited the panel component of five waves of LFSs in 2002–2004. The authors first examined the labour market status of individuals over time; out of the 5587 working-age population in the panel component, 53.7% had their labour market status changed, while 21.0%, 1.3%, 19.3% and 1.3% remained in the formal sector, in the informal sector, economically inactive and unemployed respectively, in all five waves. The authors then examined the 1009 people who worked in the informal sector in at least one wave; 53.7% and 7.0% worked in the sector in only one wave and all five waves respectively. That is, churning for informal sector workers was high. For these 1009 people, 18.3% were employed in all waves but moved between the two sectors. Finally, the authors briefly examined intra-household formal-informal sector linkages in 2004, and found that 45% of households contained at least one formal sector worker and 13% with at least one informal sector worker, but only 2.5% contained at least one worker from both sectors.
Essers (Citation2014:13–14) used the panel component of the 2008–2012 QLFS data to construct a labour market transition matrix. The author briefly examined formal-informal sector transition, and found 90% of those initially worked in the formal sector remained in this sector; for those originally working in the informal sector, 80% remained there but 3% transitioned to the formal sector. The econometric analysis indicated that more educated married white males were significantly more likely to stay in the formal sector.
Anand et al. (Citation2015) used the 2008 and 2014 QLFS data and applied a similar algorithm as Valodia & Devey (Citation2011) to match the individuals across the two surveys to construct the panel data component, before labour market transitions of the individuals. Three binary explanatory variables were derived for probit regressions, namely ‘job found’ (unemployed in 2008; employed in 2014), ‘job exit’ (employed in 2008; unemployed in 2014) and ‘transitioning to formal employment’ (either unemployed or working in the informal sector in 2008 but working in the formal sector in 2014). Focusing on the results of the third probit, Anand et al. (Citation2015:27) found that those initially working in the informal sector and those who were initially unemployed but had prior work experience, were significantly more likely to transition to the formal sector. Also, female Africans aged at least 35 years and with lower educational attainment, were significantly less likely to find work in the formal sector.
3. Methodology and data
This study uses the NIDS data which is the first national panel study in South Africa, conducted by the Southern Africa Labour and Development Research Unit (SALDRU). The study utilises the first four available waves (conducted in 2008, 2010/2011, 2012 and 2014/2015) and focuses on the working-age population (15–65 years) with specified labour market status, providing they took part in all four waves. The final sample size is 8631. All empirical results are weighted with the panel data weights derived by SALDRU when the fourth wave data was released (the weighted number of people is 18.79 million). Due to the nature of questions asked, one limitation of this study is that it is not possible to examine intra-sectorial, forward and backward linkages, as NIDS does not ask questions on production activities. As the questions rather concentrate on the work activities of the individuals, this study focuses on labour market transitions between the formal and informal sectors.
The self-employed are classified as informal if they reported their businesses are not registered for income tax or VAT, while the informal sector employees are distinguished as those who reported they do not have their salary deducted for medical aid and UIF and pension fund contributions.Footnote1 For those who declared they work as casual workersFootnote2 but don't have a main job as employees or self-employed, they are also regarded as informal sector workers. Finally, other employed who cannot be classified into either formal or informal workers are distinguished as ‘unclassified employed’.
The empirical analysis examines the characteristics of various groups of individuals, comparing those who remained in the informal sector, remained in the formal sector, and moved between the two sectors, across the four waves. The analysis then moves on with probit regressions to investigate the characteristics of those who: (1) were unemployed in wave 1 but employed in wave 4; (2) employed in wave 1 but unemployed in wave 4; (3) unemployed or working in the informal sector in wave 1 but working in the formal sector in wave 4; (4) transitioned from the informal sector in wave 1 to formal sector in wave 4.
Next, a multinomial logistic regression is conducted, with the dependent variable being categorical with five categories: never worked, worked in one to three waves, remained in the informal sector in all waves, remained in the formal sector in all waves, worked in all waves but moved between the two sectors. The econometric analysis concludes with a multinomial logistic fixed-effects regressionFootnote3 to examine the impact of various time-varying personal- and household-level characteristics on labour market status during the period. One advantage of this model is that it ‘allows for individual unobserved heterogeneity with respect to the intercepts’ (Pforr, Citation2014:849). The dependent variable consists of five categories: inactive, unemployed, informal sector, formal sector, unclassified employed.
One concern of multinomial logit regressions relates to the assumption of independence of irrelevant alternatives (IIA), i.e. the probability ratio of individuals making a choice between two alternatives being independent of the availability or qualities of other alternatives. According to Cushing & Cushing (Citation2007) and Benson et al. (Citation2016), violations of this assumption can lead to incorrect probabilities predicted, especially when the number of alternatives available are high. However, with the presence of heterogeneous taste, IIA would not be violated (Steenburgh & Ainsle, Citation2008:4). Hence, using a fixed-effects model, the unobserved heterogeneity is accounted for, and this allows for a focus on the population's choice behaviour. There are also few other models which relax the IIA assumption, namely nested logit, mixed logit and multinomial probit.
Besides addressing individual heterogeneity (state and time-invariant variables), Klevmarken (Citation1989) and Hsiao (Citation2003) explain that panel data allows for more variability and information available between and within each unit analysed, and hence a dynamic analysis between points in time and changes over time. By holding individuals constant, one is able to determine the effects of variables on each other. These effects may not have been identifiable and measurable under pure time-series or cross-sectional data.
The biggest concern of panel data relates to selectivity: self-selectivity, nonresponse and attrition. In self-selectivity, bias happens when the data is truncated. Nonresponse can occur during the first wave when individuals refuse to respond, are not traced, are not present at home or not all questions are answered in the interview (partial nonresponse). This results in efficiency loss and identification issues for population parameters. Attrition (when the ensuing waves are affected by nonresponse) can be linked to death or migration of individuals (Klevmarken, Citation1989; Hsiao, Citation2003).
To address attrition, this study incorporates the NIDS panel weight. According to Chinhema et al. (Citation2016:60), panel weight is calibrated to correct for attrition, nonresponse, reorganising of the households and the population from which they are sampled. Since the individuals successfully sampled in the follow-up waves are not a random subset, the attrition bias is addressed in the panel weights.
4. Empirical findings
4.1. Descriptive statistics
depicts that 8.3% of the people had their province of residence changed between the first and fourth waves; 54.6% always lived in urban areas and 13.6% changed geo-type. The weighted sample consists of 55% females, while Africans account for 84%. At the time of wave 1, about 80% was aged below 45 years.
Table 1. Demographic characteristics of the final sample (%).
shows that the working-age population became more educated as the proportion with at least Matric increased from 28.7% to 35.5%. Labour force participation rate increased from 67.2% to 71.1% while unemployment rate dropped from 32.9% to 20.6%.Footnote4 For the employed, the formal and informal sector workers accounted for approximately 60% and 40% respectively.Footnote5 Household size was about five, with 1.5, 3.0 and 0.3 members aged 0–14 years, 15–59 years and at least 60 years respectively, on average. The mean numbers of household members receiving old-age grant and child grant hovered around 0.25 and 0.60 respectively.
Table 2. Educational, labour market and household characteristics of the final sample.
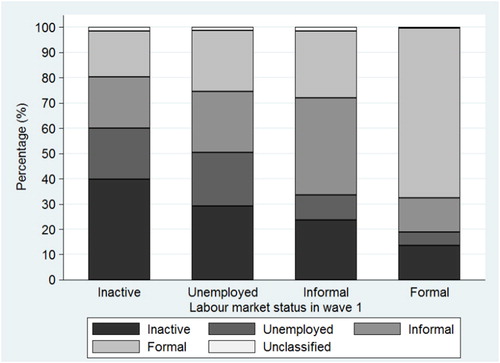
and depict the proportional transition matrices of labour market status between two waves. Between waves 1 and 4, for those initially identified as inactive, only 38% of them found work in wave 4. For unemployed in wave 1, 29% of them became inactive (these people may have lost hope of finding work), 21% remained unemployed but 48% of them found work in wave 4 (with half of them working in the formal sector). For the informal sector workers in wave 1, 38.4% remained in this sector but only 26.6% successfully transitioned to the formal sector in wave 4. The latter proportion is much bigger than the 3% proportion as found by Essers (Citation2014:13).
Figure 1. Labour market status transition between wave 1 and wave 4. Source: Own calculations using the NIDS data.
For the ‘informal to inactive’, ‘informal to unemployed’ and ‘informal to formal’ transition categories (they are referred as groups A, B and C respectively), shows that all three groups predominantly resided in urban areas in KwaZulu-Natal and Gauteng, but the Gauteng and urban shares were relatively larger for group C. The female share was more dominant in groups A and B (67% and 54% respectively), but the male share was rather more dominant in group C at 56%. The mean age of group A was about 10 years greater, while group C was most educated. To conclude, younger, more educated males living in urban areas were associated with successful transition from informal to formal sector work.
Going back to and , for individuals initially working in the formal sector, two-thirds remained in this sector whereas 13.6% moved to the informal sector. To sum up, the above results, particularly the proportions in the diagonal bands in the transition matrices, suggest a great extent of churning took place in the balanced panel, as the majority of the working-age population had their labour market status changed.
categorises the final labour market status of the individuals into 10 groups. While not the focus of this study, 7.3% (1.37 million) remained inactive while 0.9% (0.18 million) remained unemployed. Only 2.5% (0.48 million) worked in the informal sector and 11.85% (2.22 million) worked in the formal sector in all waves, whereas 8.0% (1.51 million) worked in all waves but moved between the two sectors. Also, 34.2% of the individuals worked in the formal sector in one to three waves while this proportion was 43.2% regarding the share of individuals working in the informal sector in one to three waves. These findings again suggest a significant degree of churning.
Table 3. Detailed labour market status of the final sample (%).
presents the profile of the 10 groups. The discussion focuses these groups: remained in informal sector (RI), remained in the formal sector (RF), and worked in all waves but moved between the two sectors (E4M). First, the Gauteng share was most dominant in all three groups (exceeding 30%), but this share was the highest for RF (40.5%). For all three groups, more than 60% of the people lived in urban areas but this share was the highest for the RF group (79.6%).
The female share was more dominant for the RI group (two-thirds) but the opposite took place in the RF and E4M groups. The African share was extremely high (96.1%) in the RI group, but it was ‘only’ 77.9% and 66.0% for the E4M and RF groups respectively. In all three groups, approximately two-thirds of workers were aged 25–44 years at the time of wave 1 and the mean age hovered in the 35–38 years range. Finally, the RF group was most educated (mean years of education being 11), followed by the E4M (close to 10 years) and RI (about 8 years) groups.
presents the work activities of these groups in wave 4. The share of self-employed was the highest for the RI group (29%); this result is not surprising, as informal workers are associated with a greater likelihood of self-employment (Essop & Yu, Citation2008a, Citation2008b). Nearly 90% of those in the RI group were involved in unskilled or semi-skilled occupations, with the majority of them working in the elementary occupations. Only 10% of the RF group were involved in unskilled occupations but a higher 35.7% were engaged in high-skilled occupations.Footnote6 For the E4M group, 57.5% and 23.8% of them were involved in semi-skilled and unskilled occupations respectively.
Table 4. Work characteristics of the three focus groups in wave 4.
About 83% of the RI group worked in the tertiary sector, with more than half of them working in private households. Nearly 70% of the RF people worked in the tertiary sector, with the majority of them working in community, social and personal (CSP) services. Furthermore, 62.8% of the E4M group worked in the tertiary sector in wave 4, and again, a high proportion of them worked in the CSP services industry. Finally, although not shown in the table, the RI workers earned R2350 per month (2017 December prices), but it was higher for the RF (R13 100) and E4M (R8350) groups.
compares the mean education years of four groups of workers whose sector status changed between waves 1 and 4. Although it is expected that those who worked in the formal sector in both waves are most educated (about 11 years), those who transitioned from informal sector to formal sector showed the greatest increase of mean years of educational attainment (0.42 years), followed by those who remained in the formal sector in both waves (0.39 years). Even after excluding those who were enrolling at educational institutions in wave 1, the increase of mean education years remained the greatest for these two groups (that is, some people in these two groups enrolled at educational institutions in waves 2 to 4 to improve their qualifications and human capital further). To conclude, those whose educational attainment improved may be the ones who successfully found work in the formal sector.
Table 5. Change in mean years of education of selected groups between wave 1 and wave 4.
4.2. Econometric analysis
presents the results of the four probit regressions. The first probit reveals that lowly educated females who were not household heads, and remained in Eastern Cape, Northern Cape, Gauteng and Limpopo were significantly less likely to transition from unemployment to employment. The second probit shows that younger but more educated males who were household heads, residing permanently in Gauteng, Mpumalanga and Limpopo provinces were significantly less likely to have their status changed from employed to unemployed.
Table 6. Probit estimates or labour market transitions from wave 1 to wave 4.
For both the third and fourth probit regressions, males were significantly more likely to transition to the formal sector (average marginal effect was above 10%). Education exhibits a significant positive non-linear (convex) relationship with the probability of transitioning to the formal sector. The white dummy is statistically significant in the fourth regression, and the average marginal effect suggests that the white individuals were 33.7% more likely to transition from the informal to formal sector compared with the reference groups (Africans). Individuals who were household heads with more children in the households were significantly more likely to transition from unemployment or informal sector to formal sector, whereas those who were married or lived with partners were about 10% significantly more likely to transition from informal to formal sector.
presents the multinomial logistic regression. The base category represents those who did not work in all four waves (group 1). Males were significantly more likely to work: they were 1.4 times more likely to work in one to three waves (group 2), 38% more likely to remain in the informal sector (group 3) (albeit this result is insignificant), six times more likely to remain in the formal sector (group 4) and 4.9 times more likely to transition between the two sectors (group 5), compared to females.
Table 7. Multinomial logistic estimates of grouped final labour market status transitions from wave 1 to wave 4.
Coloured individuals were significantly more likely to be in groups 2, 4 and 5. In contrast, Coloureds, Indians and whites were significantly less likely to be in group 3 than in group 1. These findings suggest Africans remained most likely to stay in the informal sector. Older individuals had a significantly greater likelihood of belonging to groups 2–5. More educated individuals were significant more likely to be in groups 2–5 rather than group 1, with the probability increasing at an increasing rate as educational attainment improved.
Those remaining in traditional areas were significantly less likely to belong to groups 2, 4 and 5; in contrast, those living in farm areas were 4.3 times more likely to remain in the informal sector and 2.1 times more likely to move between the two sectors. The findings are not surprising as these areas are usually associated with a high prevalence of unemployment and informal work. Residents remaining in Western Cape, Gauteng and Mpumalanga were significantly more likely to belong to groups 4 and 5. Finally, Household heads were significantly more likely to be working, while the presence of more children significantly decreased the probability of falling under groups 3–5.
presents the results of the fixed-effects multinomial logistic regression on labour market status, with the base category being informal sector workers. Out of the 8631 individuals in the balanced sample, 1719 of them were dropped from the analysis because their labour market status was the same in all waves. Gender and race were excluded as explanatory variables because of zero within-group (or within-individual) variance.
Table 8. Multinomial logistic fixed-effect estimates of labour market status category.
There is a significant and convex relationship between age and likelihood of being inactive, unemployed or formal sector workers, but the relative risk ratio (RRR) was smaller than one in the linear age variable for the first two groups (0.546 and 0.832), but greater than one (1.408) for the last group. There also exists a significant convex relationship between years of education and probability of being inactive or unemployed. This finding implies some educated working-age population either gave up hope of finding work or still actively looked for work (in the formal sector), rather than working in informal sector. Compared to Western Cape people, the Eastern Cape and KwaZulu-Natal individuals were significantly more likely to be inactive; those living in urban or farm areas were significantly less likely to be inactive or unemployed, compared to traditional area residents.
Household heads were 27% and 15% significantly less likely to be unemployed and work in the formal sector respectively, while those who were married or lived with a partner were 18% more likely to be inactive, instead of working in the informal sector. The presence of an additional child in the household significantly yet slightly increased the odds of the individuals being inactive (12.5%), unemployed (8.9%) and formal sector workers (5.4%), while the presence of one more elderly member significantly decreased the likelihood of individuals working in the formal sector by 16%.
The presence of an additional old-age grant recipient significantly increased the likelihood of the individuals being inactive by 67%, unemployed by 42% and formal sector workers by 21%. One more child grant recipient was associated with a slightly smaller yet significant likelihood of working in the formal sector (10%).Footnote7
Finally, the results of the pooled multinomial logistic regression () are generally similar to , except that: the number of other social grant recipients variable was statistically significant (but the RRR is smaller than one for the formal sector category); more provincial dummy variables became statistically significant; this pooled regression allows the inclusion of the gender and race dummy variables, and males, Coloureds and whites enjoyed significantly greater likelihood of working in the formal sector (RRR exceeds one).
5. Conclusion
This study examined the formal-informal sector labour market linkages by using the balanced panel component of the NIDS waves 1 to 4 data. For the wave 1 informal sector workers, nearly 40% remained in this sector but only about a quarter transitioned to formal sector in wave 4. Highly educated white males who were married household heads were significantly more likely to transition from informal to formal sector employment. Older, more educated Coloured male individuals who were household heads, with more children in the households and residing in Western Cape, Gauteng, North West, Free State and Mpumalanga (rather than Eastern Cape), were significantly more likely to be employed in all four waves but transitioned between the two sectors.
The transition from unemployment or informal work to decent, formal work is dependent on the availability of jobs and the necessary skills required to fulfil the work in the formal sector. The South African labour market is associated with an over-abundance of unskilled labour but a shortage of skilled labour. Historically, economic growth has been capital- and skill-intensive, providing limited work opportunities for unskilled jobseekers. The stagnant economic growth since the 2008–2009 financial crisis also stifled formal work opportunities. Hence, it is relatively more difficult for the unemployed and informal workers to find formal work opportunities.
To address skills mismatch, the most simplistic solution is to provide more training and learning opportunities to transform the unskilled labour. These programmes do exist, but are they targeting the skills needed by formal sector employers in industries with more rapid growth or promising potential for future growth? The abundance of unskilled labour at present suggests the education system slacks in producing skilled labour in areas needed by the economy. The education system needs to be assessed, and stigma of inferior quality surrounding the education system should be addressed (Brown & Koettl, Citation2015:6). It would be in its best interest to involve formal firms to provide assistance and information on the crucial skills most suited for the labour market (Rogerson, Citation2004:770).
Although the government has been promoting the growth of small- and medium-sized enterprises (SMMEs), its efforts of formalising the informal sector may impose certain pressure and costs on small firms; this in turn would impact on the sustainability of the small firms. Government could also more drastically address centralised bargaining which favours unions and large employers leading to wage rigidity. Centralised bargaining puts pressure on the SMMEs to offer similar wages to larger firms, thereby hampering their growth. Government either has to provide subsidies or other incentives (e.g. tax cuts) to help promote the growth of SMMEs and to reduce formal sector unemployment. Government could also provide workshops and specialised entrepreneurial assistance to enhance entrepreneurship skills and advise small informal firms on growth strategies. These incentives will assist in their growth and transition to the formal sector. It is also important for the government to hastily assist in the removal of barriers of entry to the informal sector and promote informal business development by either assisting in its formal transformation (in a more natural transformation) or long-term sustainability.
Promotion of informal, small firms can be aided with low-wage strategies to increase employment likelihood of the unskilled unemployed (through linking wages to productivity better), thereby increasing production and income. Smaller informal firms require less capital, but many previously disadvantaged entrepreneurs lack collateral and entrepreneurial expertise. As regional and local authorities are more connected to the communities, there should be employment centres available to give advice to small firms, inform them of future initiatives, provide their employees with training or provide them with a space to do business. All these initiatives would ensure that the more vulnerable small firms (instead of the skilled unemployed who already enjoy higher employment probability) are targeted (Neves et al., Citation2011; Jin et al., Citation2016).
It is beneficial if government assists with establishing stronger linkages between the informal and formal firms, especially if they complement each other (Sziráczki, Citation1990:708). The larger, more established formal firms can assist with developing and training of informal sector workers and providing expert guidance to informal firms. The assistance can be incentivised through tax reductions and the prospects of a larger collective market via the informal sector.
Finally, data limitations raised in Section 3 could be addressed by including new questions in future waves to thoroughly capture information on the non-labour forward and backward linkages between the informal and formal sectors. To more accurately distinguish the formal from informal sectors, NIDS could adopt an official methodology similar to StatsSA on the QLFS data. This will allow for a more accurate empirical analysis.
Notes
1 The informal sector employees could be distinguished more accurately had the firm size been considered. Unfortunately, the question on firm size was only asked in wave 4.
2 One big difference between QLFS and NIDS is that in the latter questionnaire, there are detailed questions asked to capture casual work activities.
3 Detailed discussion on the statistical method of this econometric model falls beyond the scope of this study but can be referred to Pforr (Citation2014:848–850).
4 Between 2008 and 2015 fourth quarter QLFSs, the labour force participation rate dropped from 58.6% to 58.1% and unemployment rate increased from 21.5% to 27.7%, contradicting the trends found in the NIDS balanced panel. Also, the 2008–2015 annualised real GDP growth rate was 1.8%.
5 For those under the ‘unclassified employed’ category, the majority of them were involved in the elementary occupations (30%), service workers and shop and market sales (20%), craft and related trade workers (15%) occupation categories.
6 One shortcoming of the NIDS questionnaire is that the public/private sector status of employees was not captured. However, upon checking the 2017 QLFS data, about one-third of formal sector high-skilled employees worked in the public sector, but this proportion was only 7% for the informal sector high-skilled employees.
7 Various local empirical studies (Bertrand et al., Citation2003; Klasen & Woolard, Citation2005; Lekezwa, Citation2011; Mutasa, Citation2012; Muchiri, Citation2016) found that social grant receipt was associated with lower labour force participation likelihood. An exception is Posel et al. (Citation2006), who found the receipt of a social grant facilitated the migration of household members, particularly women, to work or seek work.
References
- Alda, H, Allaart, P & Bellmann, L, 2005. Churning and institutions: Dutch and German establishments compared with micro-level data. IAB Discussion Paper 2005/12. Institut für Arbeitsmarkt- und Berufsforschung, Nürnberg.
- Anand, R, Siddharth, K & Kumar, N, 2015. South Africa: Labour market dynamics and inequality. Proceedings of the Economic Society of South Africa (ESSA) Conference, 2–4 September, Cape Town.
- Arimah, BC, 2001. Nature and determinants of the linkages between informal and formal sector enterprises in Nigeria. African Development Review 13(1), 114–144. doi: 10.1111/1467-8268.00033
- Benson, AR, Kumar, R & Tomkins, A, 2016. On the relevance of irrelevant alternatives. Proceedings of the 25th International Conference on World Wide Web, 11-April 15, Montreal.
- Bertrand, M, Miller, D & Mullainathan, S, 2003. Public policy and extended families: Evidence from pensions in South Africa. The World Bank Economic Review 17(1), 27–50. doi: 10.1093/wber/lhg014
- Brown, AJG & Koettl, J, 2015. Active labor market programs: Employment gain of fiscal drain? Journal of Labor Economics 4(12), 1–36.
- Budlender, D, Buwembo, P, Chobokoane, N & Shabalala, N, 2001. The informal economy: Statistical data and research findings; country case study: South Africa. Women in Informal Employment Globalising and Organising (WIEGO), Cambridge.
- Burgess, S, Lane, J & Stevens, D, 2001. Churning dynamics: an analysis of hires and separations at the employer level. Labour Economics 8(1), 1–14. doi: 10.1016/S0927-5371(00)00027-0
- Chen, MA, 2012. The informal economy: Definitions, theories and policies. WIEGO Working Paper No.1. Women in Informal Employment Globalising and Organising (WIEGO), Cambridge.
- Chinhema, M, Brophy, T, Brown, M, Leibbrandt, M, Mlatsheni, C & Woolard, I, 2016. National income dynamics study panel user manual. Southern Africa Labour and Development Research Unit, University of Cape Town, Cape Town.
- Cichello, P, Leibbrandt, M & Woolard, I, 2014. Winners and losers: South African labour-market dynamics between 2008 and 2010. Development Southern Africa 31(1), 65–84. doi: 10.1080/0376835X.2013.853612
- Cushing, C & Cushing, B, 2007. Conditional logit, IIA, and alternatives for estimating models of interstate migration. Proceedings of the annual meeting of the Southern Regional Science Association, March 29–31, Charleston.
- Davis, S & Haltiwanger, J, 1999. Chapter 41: Gross job flows. In Ashenfelter, O & Card, D (Eds.), Handbook of labor economics, Volume. 3B. Elsevier, Amsterdam, 2711–2805.
- Devey, R, Skinner, C & Valodia, I, 2006. Definitions, data and the informal economy in South Africa: A critical analysis. In Padayachee, V (Ed.), The development decade? Economic and social change in South Africa, 1994–2004. Human Sciences Research Council Press, Cape Town, 302–323.
- Essers, D, 2014. South Africa labour market transitions during the global financial and economic crisis: Micro-level evidence. Working Paper 2014/115. World Institute for Development Economic Research, Helsinki.
- Essop, H & Yu, D, 2008a. The South African informal sector (1997–2006). Stellenbosch Economic Working Papers 03/08. Stellenbosch University, Stellenbosch.
- Essop, H & Yu, D, 2008b. Alternative definitions of informal sector employment in South Africa. Stellenbosch Economic Working Papers 21/08. Stellenbosch University, Stellenbosch.
- Hart, K, 1973. Informal income opportunities and urban employment in Ghana. The Journal of Modern African Studies 11(1), 61–89. doi: 10.1017/S0022278X00008089
- Heintz, J & Posel, D, 2008. Revisiting informal employment and segmentation in the South African labour market. The South African Journal of Economics 76(1), 26–44. doi: 10.1111/j.1813-6982.2008.00153.x
- Hsiao, C, 2003. Analysis of panel data. 2nd edn. Cambridge University Press, Cambridge.
- Hyatt, HR & Spletzer, JR, 2013. The recent decline in employment dynamics. IZA Journal of Labor Economics 2013, 2–5.
- Ingle, K & Mlatsheni, C, 2016. The extent of churn in the South African youth labour market: Evidence from NIDS 2008–2015. SALDRU Working Paper 201 and NIDS Discussion Paper 2016/17. Southern Africa Labour and Development Research Unit, University of Cape Town, Rondebosch.
- Jin, Y, Fukahori, R & Morgavi, H, 2016. Labour market transitions in Italy: Job separation, re-employment and policy implications. OECD Economics Department Working Paper No. 1291. Organisation for Economic Co-operation and Development (OECD), Paris.
- Kingdon, GG & Knight, J, 2004. Unemployment in South Africa: The nature of the beast. Development Southern Africa 32(3), 391–408.
- Klasen, S & Woolard, I, 2005. Surviving unemployment without state support: Unemployment and household formation in South Africa. CSSR Working Paper No. 129. Southern Africa Labour and Development Research Unit, Rondebosch.
- Klevmarken, NA, 1989. Panel studies: What can we learn from them? Introduction. European Economic Review 33(2–3): 523–529. doi: 10.1016/0014-2921(89)90131-1
- Lekezwa, B, 2011. The impact of social grants as anti-poverty policy instruments in South Africa: An analysis using household theory to determine intra-household allocation of unearned income. Stellenbosch University, Stellenbosch.
- Muchiri, MM, 2016. The Impact of cash transfers on labour force participation and household consumption: Evidence from post-apartheid South Africa. Unpublished doctorate dissertation, University of Kentucky, Lexington.
- Muller, C, 2003. Measuring South Africa’s informal sector: An analysis of national household surveys. DPRU Working Paper 03/71. Development Policy Research Unit, University of Cape Town, Rondebosch.
- Mutasa, G, 2012. Disability grant force participation: The case of South Africa. DPRU Working Paper No. 12/156. Development Policy Research Unit, University of Cape Town, Rondebosch.
- Naidoo, D, Van Aardt, CJ & Ligthel, M, 2004. Linkages between the formal and informal sectors in South Africa: An input-output table approach. Bureau for Market Research, University of South Africa, Pretoria.
- Neves, D, Aliber, M, Mogaladi, J & Du Toit, A, 2011. Self-employment in South Africa’s informal sector: Prevalence, prospects and policy. Institute for Poverty, Land and Agrarian Studies (PLAAS), University of the Western Cape, Bellville.
- Pagura, M & Kirsten, M, 2006. Formal-informal financial linkages: Lessons from developing countries. Small Enterprise Development 17(1), 16–29.
- Pforr, K, 2014. Femlogit – implementation of the multinomial logit model with fixed effects. Stata Journal 14(4), 847–862. doi: 10.1177/1536867X1401400409
- Posel, D, Fairburn, JA & Lund, F, 2006. Labour migration and households: A reconsideration of the effects of the social pension on labour supply in South Africa. Economic Modelling 23(5), 836–853. doi: 10.1016/j.econmod.2005.10.010
- Rix, A, Davies, K, Gaunt, R, Hare, A & Cobbold, S, 1999. The training and development of flexible workers. Department for Education and Employment, London.
- Rogerson, CM, 2004. The impact of the South African government’s SMME programmes: A ten-year review (1994–2003). Development Southern Africa 21(5), 765–784. doi: 10.1080/0376835042000325697
- Skinner, C, 2005. Constraints to growth and employment in Durban: Evidence from the informal economy. Research Report Number 65. School of Development Studies, Durban.
- Steenburgh, TJ & Ainsle, A, 2008. Taste heterogeneity, IIA, and similarity critique. Working paper 09–049. Harvard Business School, Harvard.
- Sziráczki, G, 1990. Employment policy and labour market in transition: From labour shortage to unemployment. Soviet Studies 42(4), 701–722. doi: 10.1080/09668139008411897
- Tattara, G & Valentini M, 2004. Labour churning and employment to employment flows: Long-term dynamics in Veneto. Nota di lavoro n.8. Del Dipartimento di Scienze Economiche, dell Università Cà Foscari di Venezi, Venezi.
- Topel RH & Ward, MP, 1992. Job mobility and the careers of young men. The Quarterly Journal of Economics 107(2), 439–479. doi: 10.2307/2118478
- Valodia, I & Devey, R, 2011. Formal-informal economy linkages: What implications for poverty in South Africa?. Law, Democracy & Development 14(1), 133–158. doi: 10.4314/ldd.v14i1.13
- Van Ham, M, Mulder, CH & Hooimeijer, P, 2001. Local underemployment and the discouraged worker effect. Urban Studies, 38(10), 1733–1751. doi: 10.1080/00420980120084831
- Verick, S, 2010. Unravelling the impact of global financial crisis on the South African labour market. Employment Working Paper No. 48. International Labour Organization (ILO), Geneva.
- Worth, S, 2005. Beating the ‘churning’ trap in the youth labour market. Work, Employment and Society 19(2), 403–414. doi: 10.1177/0950017005053184
- Yu, D, 2012. Defining and measuring informal employment in South Africa. Development Southern Africa 29(1), 157–175. doi: 10.1080/0376835X.2012.645649