
ABSTRACT
This article explores the limitations of using data from the Quarterly Labour Force Survey (QLFS) to estimate robust sub-national labour market indicators in South Africa. The precision of labour market indices in the QLFS is very sensitive to which geographic scale is examined – national, provincial or metro – and in each instance the size of the population of the province or metro. The results show that errors from sampling at regional and city levels may be prohibitively large although in some instances broad patterns between regions can be identified notwithstanding a fairly blunt instrument. The findings highlight the imperative to be transparent about sampling errors and to foster sensitivity within government, business and the public in general. This exercise is instructive for generating other regional socio-economic indicators that are based upon similar household sample surveys such as the General Household Survey, Living Conditions Survey and Income and Expenditure Survey.
1. Introduction
Sustainable Development Goal 11 (creating safe, inclusive, safe, resilient and sustainable cities) commits governments with the international research community to measure and monitor progress across cities and regions. Improving governance of Africa’s rapidly expanding cities depends on policy that is responsive to the local context (Collier & Venebles, Citation2017). There is growing momentum behind a set of International Organisation for Standardisation (ISO) metrics for cities that will facilitate more robust cross-country comparisons (World Council on City Data, Citation2017). However accurately assembling data at a local and regional scale is a challenge for many African countries and cities (United Nations, Citation2017; van Belle, Citation2017).
Sample surveys are a common tool for collecting information on many different issues over regular periods of time and at reduced cost (Rao, Citation2017). The national statistical agency in South Africa, Statistics South Africa (StatsSA), undertakes a wide array of regular national household sample surveys that are designed to be representative at provincial (regional) and metropolitan (city) levels. The inherent limitation in measuring local progress using sample surveys is that smaller geographies imply a smaller sample size and therefore a loss of accuracy in measurement.Footnote1
This paper explores the limitations of using the Quarterly Labour Force Survey (QLFS) to generate provincial and metropolitan (metro) level labour market indicators in South Africa. The analysis focuses on measuring changes in the rate of unemployment for the period 2008 to 2014, but the findings are instructive for other socio-economic indicators (such as poverty, inequality and living conditions) derived from StatsSA surveys which share a similar sample size, sampling frame and survey methodology such as the General Household Survey (GHS), Living Conditions Survey (LCS) and Income and Expenditure Survey (IES). We show that margin of error in estimating the rate of unemployment for many regions and metros is relatively large and therefore the scope for sub-national analysis is fairly limited in the absence of mitigating interventions such as small-area modelling.
The paper begins by reviewing the literature and moves on to review the data and explain the methods. Section 4 presents the extent of errors in sample measurement at regional and city levels by estimating the unemployment rate and other labour market indices for the period 2008 to 2014. Section 5 explores how labour market information is disseminated by the media, with attention on the packaging of the results by StatsSA. The paper concludes with a summary of the key findings and some reflections for scholars and practitioners.
2. Literature
The challenge of reliably estimating statistics for smaller sub-populations (or domains) is well documented in the literature on ‘small area estimation’ (see Rao & Molina, Citation2015; Rao, Citation2017). There is an inverse relationship between the sample size and the margin of error which means that smaller geographies (or any smaller domain) may suffer from prohibitively large standard errors (Hanneman et al., Citation2012; Rao, Citation2017). There are variety of techniques that attempt to mitigate against imprecision in the measurement of smaller samples (Ghosh & Rao, Citation1994; Singh et al., Citation1994; Jiang & Lahiri, Citation2006; Pfeffermann, Citation2013; Rao, Citation2017). One approach is to make use of indirect estimators which ‘borrow’ strength from related domains to increase precision. These are based on either implicit (such as ‘synthetic’ or ‘composite’ estimators) or explicit models (such as ‘hierarchical Bayes’ or ‘empirical best’ estimators) that are related to the sample of interest through supplementary administrative or other survey data (see Rao & Molina (Citation2015) for an overview).
Most research focused on the small area level in South Africa rely on direct estimators from the Population Census or the larger sample Community Survey to measure income poverty or composite indicators of well-being (Rossouw & Naude, Citation2008; Noble & Wright, Citation2013; Sartorius & Sartorius, Citation2016; Burget et al., Citation2017; David et al., Citation2018). Alderman et al. (Citation2002) use survey-to-census imputation models to predict poverty rates for magisterial districts in South Africa using the 1996 Population Census combined with IES/October Household Survey (OHS) data. Demombynes & Ozler (Citation2005) apply the same approach to explore income inequality and rates of crime at the neighbourhood level. Both studies focus on improving the Census data as opposed to bolstering the strength of smaller sample surveys. Morudu (Citation2016) advocates applying Ziph's rule (which is an empirical occurrence, rather than a theoretical model) to predict population and GDP estimates for years in between the Population Census.
Unfortuantely, the Population Census is not comprehensive in assessing labour market conditions and the questionnaire design has changed in ways which make comparisons over time problematic (Klaasen & Woolard, Citation1999; Kingdon & Knight, Citation2001, Citation2004; Casale et al., Citation2004). The 1994–99 OHS, 2000–07 Labour Force Survey (LFS), and 2008-onwards QLFS are the principal vehicles for collecting labour market information in South Africa on a regular basis for the respective periods, although there are comparability issues in methodology, questionnaire design and sampling frame between them (Casale et al., Citation2004; Burger & Yu, Citation2006; Yu, Citation2007; Citation2009). Some studies of the South African labour market include sub-national estimates or controls for the labour market, typically between urban and rural areas, but few focus on representivity at the local level between provinces or metros (Kingdon & Knight, Citation2006; Festus et al., Citation2016; Bhorat & Khan, Citation2018). Statistics South Africa regularly report on provincial labour market indicators with each release of the QLFS (StatsSA, Citation2015).
Demand for sub-national data in South Africa is evident from the presence of a commercial market for modelled regional data. Reliance upon commercial sources is ubiquitous within local, provincial and national government and it is not uncommon for such commercial data to be cited in academic research, even though these for-profit companies do not release their methodology (Rogerson, Citation2010; Morudu, Citation2016). The reliability of commercially curated data is ultimately dependent on the quality of their data modelling (which is not released) and upon the quality of their secondary sources (which presumably depends heavily on StatsSA surveys). Administrative records can provide detailed information at the local level but suffer from gaps in coverage, restrictions in access, and are in many cases not sufficient codified (Woolfrey, Citation2014).
3. Data and methods
The purpose of this article is to interrogate the usefulness of drawing on data from the QLFS to generate reliable regional labour market statistics. This is intended to be instructive for estimating other socio-economic indicators that can be generated from similar household surveys and which share the same methods and sampling frame such as the GHS, LCS and IES.
StatsSA household sample surveys are based upon a master sample from the Population Census which is designed to be representative at national, provincial, and metropolitan municipality (metro) levels. Sample weights adjust for original selection probabilities; sub-sampled, segmented or excluded primary sampling units; weight trimming; non-response; and final weights are benchmarked to demographic population estimates (StatsSA, Citation2015). Imputation is also applied to instances of item non-response and edit failures. The QLFS sample is designed as a rotating panel with 1/4 of the sample being replaced after each round. This has the benefit of minimising covariance between panel observations although the sample is fully replaced after one year (Nijman et al., Citation1991). There are approximately 30 000 households and 85 000 individuals in each QLFS. South Africa’s population was roughly 54 million in 2014 hence the QLFS sample size is roughly 0.16% of the population.
South Africa has one of the highest rates of unemployment in the world and changes in labour market conditions are under regular scrutiny in the local press. We analyse patterns and changes in the expanded rate of unemployment at the national, provincial and metropolitan scales for the period 2008 to 2014 using the fourth quarter from each year. This avoids the need to adjust for seasonality and the period aligns to the same Census 2011 master sample frame.
The simplest method in assessing the accuracy of regional estimates is to generate standard errors for each statistic. Standard errors can be expressed as confidence intervals – the bandwidth within which the true population estimate will fall at a certain level of confidence – and displayed visually in the figures as error bars. Error bars are shown at a level of ‘twice the standard error’ which corresponds to a 95% level of confidence. This provides the reader with an easy interpretation of where the true population statistic is likely to fall 95 percent of the time (Hanneman et al., Citation2012).
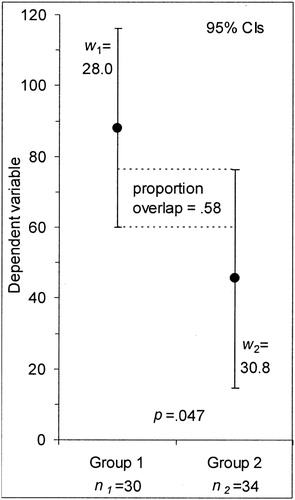
We can extend the intuition of the confidence intervals to calculate how much the unemployment rate would need to change on average for the shift to be statistically significant between two periods. A common misconception is that if the confidence intervals of two independent means overlap by even a small degree the null hypothesis (that the estimates are the same) cannot be rejected (Schenker & Gentleman, Citation2001). As discussed by Cumming & Finch (Citation2005), a better rule of thumb is that the error bars (lower and upper tails respectively) should overlap by roughly no more than half (or 0.58 to be more precise) to be confident that there is a statistically significant difference between the estimates (see ). We can apply this rule of thumb to the 95% confidence intervals for the rate of unemployment and estimate the size of the change that is required for the unemployment rate to change significantly.Footnote2 In other words, this calculation represents the average proportional shift that is needed such that the (lower and upper) error bars do not overlap by our rule of thumb of 0.5. This allows us to produce an estimate for the average size of a change that is needed for unemployment to be judged to have changed significantly for each geography at a 95% level of confidence.
Figure 1. Overlapping confidence intervals. Source: Taken from Cumming and Finch (Citation2005).
4. Confidence in labour market indicators from the QLFS
illustrates changes in the expanded rate of unemployment over the period 2008 to 2014.Footnote3 The y-axis for each geography is fixed at 15 percentage points so that comparisons across regions can be made easily by eye. Dashed lines are fitted where the change between two consecutive years is not statistically significant at a 95% level of confidence. The provinces (Gauteng and the Western Cape) and metros (and Cape Town, Johannesburg and eThekwini) depicted in the figure are the largest in South Africa (with relatively smaller sampling errors) and depict an upper-bound to the level of accuracy of sub-national estimates.
Figure 2. Rates of unemployment by selected provinces and metros, QLFS 2008–2014. Source: Quarterly labour force survey; own estimates.
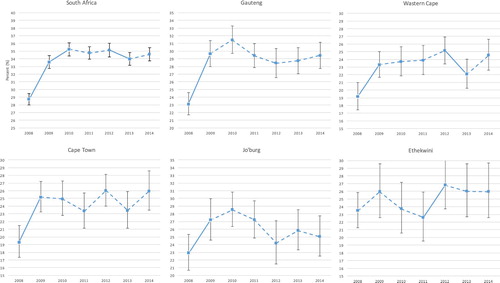
The figure shows that the South African economy has stagnated since the 2008 global recession, with the rate of unemployment rising from 28.7% in 2008 to 34.6% by the end of the period. How robust is this apparent trend of rising unemployment both at national and sub-national levels?
At the national level, the error bars in the figure are fairly small meaning that the rate of unemployment for South Africa can be measured with reasonable precision, with changes greater than 1 percentage point typically statistically significant. In comparison, the error bars in Gauteng and the Western Cape are roughly double the size than at national and roughly three times the size in the Cape Town and Johannesburg metros. In the case of eThekwini, the level of accuracy has deteriorated so much that the error bars are nearly four times the size of the national-level. Practically, this makes identifying sub-national trends difficult, and if anything, unemployment for these regions follows the same pattern as South Africa (with the possible exception of eThekwini). Point estimates for the provinces and metros show an uncomfortable amount of year-on-year fluctuation – a telling sign of the loss of precision in measuring unemployment at sub-national levels.
lists various measures of the average size of the sampling error for the rate of unemployment for all provinces and metros in South Africa. The first column shows the average number of observations per region over the period. The second column calculates the average standard error and the third column reflects this as a factor of the national estimate. As seen in the table, the standard error for measuring the rate of unemployment ranges from a low of 0.42 for South Africa and a high of 3.91 for Tshwane metro. This pattern naturally corresponds to the average number of observations, with larger samples having lower standard errors and vice versa. As a factor of the standard error of South Africa, provincial standard errors are at least double to triple the size (and 4.7 times the size in the case of the Northern Cape). The metros show greater variation amongst each other with the standard error ranging from 2.7 times the size of the national sample error for Cape Town, and more than 7 times the size for Buffalo City or Tshwane.
Table 1. Standard errors for the unemployment rate at national, provincial and metro levels, QLFS 2008 to 2014.
What does this mean about making accurate judgements of the rate of unemployment at different geographic-scales? How much does the rate of unemployment need to change for us to be confident about this movement? column 4 calculates the average bandwidth of the confidence interval for the rate of unemployment in each region at a 95% level of confidence. Applying our rule of thumb to the size of the confidence interval shows just how much the unemployment rate needs to change on average to be statistically significant at a 95% level of confidence (see discussion in section 3). Column 5 of reveals that the rate of unemployment for South Africa would need to increase/decrease by at least one percentage point for the change to be statistically significant. In Gauteng (the province with the smallest standard error) the unemployment rate must fluctuate by more than two percentage points for anything to be confidently concluded. For the Gauteng metros of Johannesburg and Ekurhuleni this must be greater than 3.5 percentage points and more than 10 percentage points in the case of Tshwane. Two out of the nine provinces and six out of the eight metros need a change of greater than 4 percentage points to conclude anything reliably about fluctuations in the rate of unemployment.
In summary, without due consideration for fairly large errors in sampling at the sub-national level, an estimated change in the rate of unemployment across time may well be spurious. Users of the data need to be circumspect, particularly for smaller provinces and metros. But it would be premature to conclude that there is no merit in trying to measure statistics at the sub-national level using the QLFS. Larger differences between any two point estimates may allow for robust comparisons even where measurement is fairly imprecise. For example, comparisons across heterogeneous groups or involving longer time-horizons may facilitate robust conclusions.
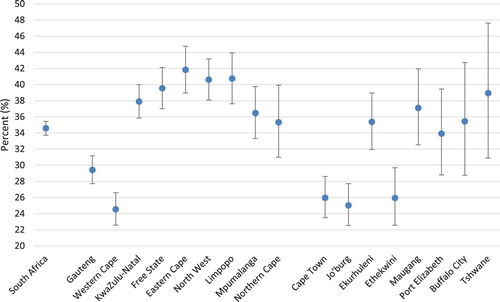
demonstrates how clear patterns can be identified by making comparisons across regions (instead of time) which are significant at a 95% level of confidence despite the large error bars. The Western Cape has a significantly lower level of unemployment than other provinces at roughly 25%, followed by Gauteng at just under 30%. The remaining provinces have rates of unemployment ranging between 35% and 45%, but the error bars are staggered such that any distinct differences between them are inconclusive. Examining the metros shows that Cape Town, Johannesburg and eThekwini have significantly lower levels of unemployment in comparison to other metros at roughly 25%. Unfortunately, the error bars for the remaining metros are prohibitively large and not much further can be concluded. Hence, where there are large differences in the point estimates between regions, this allows for some meaningful comparisons notwithstanding the lack of accuracy.
Figure 3. Rates of unemployment across provinces and metros, QLFS 2014 Q4. Source: Quarterly labour force survey 2014 Q4; own estimates.
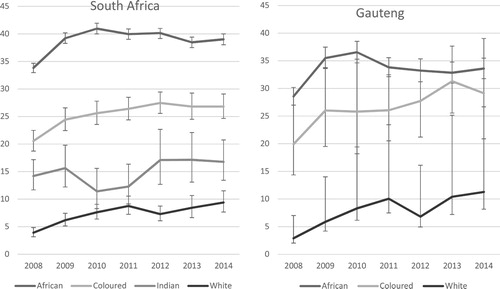
There may be other descriptive filters that are applied on top of the rate of unemployment at a regional level. For example, researchers may be interested in the rate of unemployment by race or by education in each province. This constrains the sample even further with obvious implications for the size of the sample error. demonstrates the effect by showing the rate of unemployment for South Africa and Gauteng broken down by race and over timeFootnote4. At national level, there is a clear distinction between race groups (ranked from lowest to highest as White, Indian, Coloured and African), and a general trend of rising unemployment over time (with the exception of the Indian population). If the same exercise is done for Gauteng – the province with the largest regional sample – the estimates become very blunted. Identifying significant differences in the rate of unemployment between African and Coloured populations in Gauteng is troublesome for certain years and trends over time are difficult to identify, although the general pattern resembles the national picture. Applying filters at the regional level will further divide an already limited sample, compounding the impact of errors from sampling.
Figure 4. Rates of unemployment by race in South Africa and Gauteng, QLFS 2008–2014. Source: Quarterly labour force survey; own estimates.
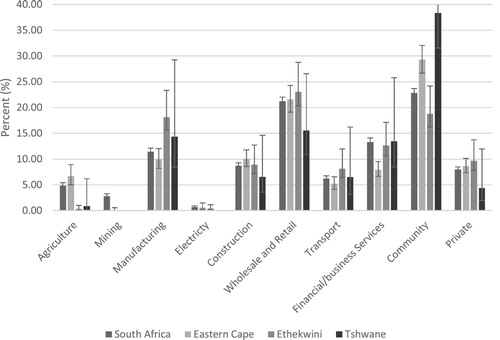
displays another important labour market indicator: the distribution of employees per industry. Some meaningful comparisons between regions can be made although these are with broad brush strokes and beyond the reach of smaller metros. At a national level a robust structural pattern of employment by sector can be identified. The Eastern Cape reflects a similar pattern to the national distribution although the mining and financial services sectors contribute proportionately less to total employment in the province whilst community services contribute proportionately more. This makes sense considering large under-developed and rural parts of the Eastern Cape and the lack of a mining economy in the region. The eThekwini metro is an important logistics base for South Africa and has a relative strength in manufacturing. Examining the pattern of employment in eThekwini confirms this narrative showing comparatively lower proportions of employees in agriculture and community services, and higher proportions in manufacturing and transport. When it comes to employment by sector within the Tshwane metro (the smallest metro), the standard errors are simply too large to draw any useful conclusions whatsoever.
Figure 5. Employment shares by broad industry category, QLFS 2014 Q4. Source: Quarterly labour force survey 2014 Q4; own estimates.
In summary, the reliability of labour market indices in the QLFS is very sensitive to which geographic scale is examined – national, provincial or metro – and in each instance the size of the population of the province or metro. The QLFS is reasonably accurate in measuring changes in the rate of unemployment at the national level but unemployment would need to change by more than 2.4 percentage points for Gauteng and the Western Cape and more than 4 percentage points for most provinces and metros for anything legitimate to be concluded. Reliable descriptive patterns can be identified at the regional scale in some instances such as unemployment between regions (rather than over time) or differences in the distribution of employment by sector. However these are cases where the point estimates are significantly different between regions and the survey instrument is understandably blunt.
5. Reporting on QLFS results by statsSa and distribution by the media
The findings demonstrate the need to be upfront about the accuracy of the data. For academic purposes it is imperative that researchers report on the size of the standard errors when estimating labour market statistics. For non-academic purposes, more should be done to sensitise the media and government officials to the reliability of labour market statistics particularly for smaller regions.
StatsSA release a descriptive report with each QLFS for dissemination to the public which is an important source for responsible reporting. The report includes a lengthy appendix which provides an extensive list of labour market indicators (including regional labour market indices) with accompanying sampling errors for each statistic. Unfortunately, the main findings and analysis make no mention of sampling errors contained in the appendix. The narrative seems to ignore the fact that some of the findings could be the result of errors from sampling.
demonstrates how this is potentially problematic by reproducing a summary table of ‘Key Labour Market Statistics’ taken from page v of the StatsSA statistical release for the QLFS 2014 Quarter 4 (StatsSA, Citation2015). The original table from the StatsSA report includes no indication of errors from sampling (these must be assembled by searching through the appendix). As seen in , only one of the fourteen labour market indicators changed significantly between 2014 Quarter 3 and 2014 Quarter 4 at a 95% level of confidence, and this is at a national level. If a less stringent level of confidence of 85% is applied then the total number of labour market indicators which are statistically significantly rises from one to five out of fourteen. No caution is given in the written discussion of the results in the StatsSA report.
Table 2. Key labour market indicators; QLFS 2014: Q3 & Q4.
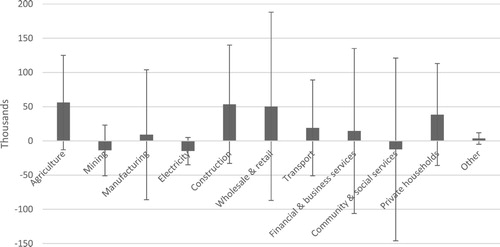
displays changes in formal-sector employment by industry between Quarter 3 and Quarter 4 2014 and replicates the figure from page x of the StatsSA report, however error bars at a 95% level of confidence are now included. As seen by the size of the error bars, none of the changes in employment numbers are statistically significant (again this is at a national level). If the total magnitude of the change in employment is greater, which is generally the case over a longer time horizon, than the analysis would be more worthwhile.
Figure 6. Change in formal-sector employment by industry, QLFS 2014: Q3 & Q4. Source: QLFS 2014: Q3 & Q4; Statistics South Africa (Citation2015).
Lastly, reproduces regional employment numbers between 2013:Q4 and 2014:Q4 taken from page ix of the report but measurements of errors from sampling are now included. The North West experiences a significant jump in the number of employees over the period. Only if we accept a low level of confidence of 70% can we conclude that the Western Cape and the Limpopo also experienced significant changes in their levels of employment. Evidently, some of the discussion contained in the official statistical release of the 2014 Quarter 4 QLFS report is based upon fairly imprecise statistics and the report makes no attempt to sensitise the reader to such problems. Inaccuracies are only amplified when analysed at the regional level.
Table 3. Changes in employment by province, QLFS 2013:Q4 & 2014:Q4.
Concern over the accuracy of labour market indicators is not an exercise in academic abstraction. Research has found that announcements in the media may influence financial markets and have a real impact on the economy (Dougal et al., Citation2012; Engelberg & Parsons, Citation2011; Garcia, Citation2013; Solomon et al., Citation2014). highlights online coverage by the South African media following the release of the QLFS 2014 Quarter 4 report which was released on the 10th February 2015. The main findings were disseminated widely by all major media houses even though the improvement in the national rate of unemployment was a modest fall of 1 percentage point (which is borderline in terms of statistical significance). In another instance, the unemployment rate in Quarter 3 of 2015 increased by just 0.5 percentage points between Quarter 2 and Quarter 3 (a statistically insignificant change even at a 75% level of confidence) but generated nearly three times the number of media releases on the internet. The point here is that unemployment trends are monitored closely in the South African media with little apparent sensitivity to the reliability of the results. This is problematic in light of the way in which StatsSA currently package their reporting.
Table 4. Internet news headlines by media houses following the release of the QLFS 2014 Q4.
6. Concluding remarks
This article has explored the limitations of making use of QLFS data in generating sub-national statistics for South Africa. The results show that robust measurement of regional labour market trends over time is constrained by the wide margin for error in sub-national samples, although broad patterns between regions can be identified where there is large variation between point estimates. The implication is that household survey data (even at a national level) must be accompanied by relevant representations of the sampling error.
For practitioners and scholars who are focused on urban and regional development, the findings should encourage a healthy scrutiny of sub-national statistics from sample surveys. The apparent neglect (or ignorance) of basic standard errors is ubiquitous in public policy documents and policy formation is vulnerable to error. Similarly, the media popularises labour market statistics (and particularly negative sentiment) without regard for its accuracy, which may give wrong impressions on the true state of the economy and can have a real impact on investor sentiment. Commercial sources of modelled data should be triangulated against what is known from more transparent official sources.
In the case of the QLFS in South Africa, it is recommended that StatsSA include error bars or confidence intervals in the main analytical section of their statistical reports and point out explicitly in the narrative where labour market indicators are less robust. This will make the findings more transparent and encourage sensitivity in public consumption. The Population Census (and the corresponding Community Survey) remains an important point of reference for sub-national estimates, notwithstanding its limitations in assessing labour market conditions. There is scope for further research which tests various methods of small area estimation and on the merits of pooling consecutive quarters of the QLFS to bolster the sample size.
Disclosure Statement
No potential conflict of interest was reported by the author.
Notes
1 There is a distinction between administrative boundaries of a region or city as opposed to functional boundaries (Todes, Citation2008; van Huyssteen et al., Citation2009; Schmidt & du Plessis, Citation2013). For the purposes of this study we use administrative municipal and provincial boundaries as defined within the QLFS.
2 In the case of comparing differences between two proportions, rather than means, Cumming (Citation2009) demonstrate that the rule of thumb applies provided that the upper and lower tails are roughly symmetrical and the proportions are not near the limits of zero or one.
3 The expanded definition of unemployment includes discouraged job-seekers (see Posel et al. (Citation2014) for a discussion).
4 Gauteng provides the best case scenario for generating robust estimates of unemployment by race as the province with largest sample.
References
- Alderman, H, Babita, M, Demombynes, G, Makhatha, N & Ozler, B, 2002. How low can you go? Combining census and survey data for mapping poverty in South Africa. Journal of African Economics 11(2), 169–200. doi: 10.1093/jae/11.2.169
- Bhorat, H, & Khan, S, 2018. Structural change and patterns of inequality in the South African labour market. Development Policy Research Unit Working Paper 201801. DPRU, University of Cape Town.
- Burger, R, Van der Berg, S, van der Walt, S & Yu, D, 2017. The long walk: Considering the enduring spatial and racial dimensions of deprivation two decades after the fall of apartheid. Social Indicators Research 130(3), 1101–23.
- Burger, R & Yu, D, 2006. Wage trends in post-apartheid South Africa: Constructing an earnings series from household survey data. Stellenbosch Economic Working Papers: 04/06. Stellenbosch, Stellenbosch University.
- Casale, D, Muller, C & Posel, D, 2004. ‘Two million net new jobs': A reconsideration of the rise in employment in South Africa, 1995–2003. South African Journal of Economics 72(5), 978–1002. doi: 10.1111/j.1813-6982.2004.tb00141.x
- Collier, P & Venables, A, 2017. Urbanization in developing economies: The assessment. Oxford Review of Economic Policy 33(3), 355–72. doi: 10.1093/oxrep/grx035
- Cumming, G, 2009. Inference by eye: Reading the overlap of independent confidence intervals. Statistics in Medicine 28, 205–20.
- Cumming, G. & Finch, C, 2005. Inference by eye: Confidence intervals and How to read pictures of data. American Psychologist 60(2), 170–80.
- David, A, Guilbert, N, Hamaguchi, N, Higashi, Y, Hino, H, Leibbrandt M & Shifa, M, 2018. Spatial poverty and inequality in South Africa: A municipality level analysis. Southern Africa Labour and Development Research Unit Working Paper Number 221, University of Cape Town, Cape Town.
- Demombynes, G. & Ozler, B, 2005. Crime and local inequality in South Africa. Journal of Development Economics 76(2), 265–92. doi: 10.1016/j.jdeveco.2003.12.015
- Dougal, C, Engelberg, J, Garcia, D & Parsons, C, 2012. Journalists and the stock market. Review of Financial Studies 25(3), 639–79.
- Engelberg, J. & Parsons, C, 2011. The causal impact of media in financial markets. The Journal of Finance 66, 67–97.
- Festus, L, Kasongo, A, Moses, M & Yu, D, 2016. The South African labour market, 1995–2015. Development Southern Africa 33(5), 579–99. doi: 10.1080/0376835X.2016.1203759
- Garcia, D, 2013. Sentiment during recessions. The Journal of Finance 68(3), 1267–300.
- Ghosh, M & Rao, J, 1994. Small area estimation: an appraisal (with discussion). Statistical Science 9, 55–76.
- Hanneman, RA, Kposowa, AJ & Riddle, MD, 2012. Basic statistics for social research (Vol. 38). John Wiley & Sons, San Francisco.
- Jiang, J & Lahiri, P, 2006. Mixed model prediction and small area estimation. Test 15, 1–96.
- Kingdon, G & Knight, J, 2001. What have we learnt about unemployment from microdatasets in South Africa? Social Dynamics 27(1), 79–95. doi: 10.1080/02533950108458705
- Kingdon, G & Knight, J, 2004. Unemployment in South Africa: The nature of the beast. World Development 32(3), 391–408.
- Kingdon, G & Knight, J, 2006. How flexible are wages in response to local unemployment in South Africa? Industrial and Labor Relations Review 59(3), 471–95. doi: 10.2307/25067543?refreqid=search-gateway:eccaadbe23f4b49634c7fb2ad1df971f
- Klasen, S & Woolard, I, 1999. Levels, trends and consistency of employment and unemployment figures in South Africa. Development Southern Africa 16(1), 3–35. doi: 10.1080/03768359908440059
- Morudu, HD, 2016. Developing annual population and gross domestic product estimates for local municipality development models in South Africa: Applications of Zipf's rule from 2001 to 2013. South African Geographical Journal 98(2), 367–85.
- Nijman, T, Verbeek, M & van Soest, A, 1991. The efficiency of rotating-panel designs in an analysis-of-variance model. Journal of Econometrics 49(3), 373–99.
- Noble, M & Wright, G, 2013. Using indicators of multiple deprivation to demonstrate the spatial legacy of apartheid in South Africa. Social Indicators Research 112(1), 187–201.
- Pfeffermann, D, 2013. New important developments in small area estimation. Statistical Science 28, 40–68.
- Posel, D, Casale, D & Vermaak, C, 2014. Job search and the measurement of unemployment in South Africa. South African Journal of Economics 82: 66–80. doi:10.1111/saje.12035.
- Rao, JN, 2017. Small-area estimation. In Balakrishnan, N, Colton, T, Everitt, B, Piegorsch, W, Ruggeri, F & Teugels, JL (Eds.), Wiley StatsRef: Statistics reference online. John Wiley & Sons, New York.
- Rao, J & Molina, I, 2015. Small area estimation. 2nd edn, John Wiley & Sons, Inc, Hoboken.
- Rogerson, CM, 2010. Local economic development in South Africa: Strategic challenges. Development Southern Africa 27(4), 481–95. doi: 10.1080/0376835X.2010.508580
- Rossouw, S & Naudé, W, 2008. The non-economic quality of life on a Sub-national level in South Africa. Social Indicators Research 86(3), 433–52. doi: 10.1007/s11205-007-9178-3
- Sartorius, K & Sartorius, B, 2016. Service delivery inequality in South African municipal areas: A new way to account for inter-jurisdictional differences. Urban Studies 53(15), 3336–55. doi: 10.1177/0042098015613001
- Schenker, N & Gentleman, JF, 2001. On judging the significance of differences by examining the overlap between confidence intervals. The American Statistician 55, 182–6.
- Schmidt, I & du Plessis, D, 2013. A critical evaluation of the operational application of various settlement typologies in South Africa. Town and Regional Planning 63, 12–23.
- Singh, MP, Gambino, J & Mantel, H, 1994. Issues and strategies for small area data. Survey Methodology 20(1), 3–22.
- Solomon, D, Soltes, E & Sosyura, D, 2014. Winners in the spotlight: Media coverage of fund holdings as a driver of flows. Journal of Financial Economics 113(1), 53–72.
- Statistics South Africa, 2015. Quarterly labour force survey 2014 Q4: Statistical Release P0211. www.statssa.gov.za
- Todes, A, 2008. Rethinking spatial planning. Town and Regional Planning 52, 9–13.
- United Nations, 2017. Assessment of urbanization data in Africa. United Nations Economic Commission for Africa, Addis Ababa.
- van Belle, JP, 2017. The South Africa country data report: A survey of data sources for the indicators relating to the Sustainable Development Goals. United Nations Economic Commission for Africa, the United Nations Development Programme, the Open Data for Development, and the World Wide Web Foundation.
- van Huyssteen, E, Biermann, S, Naudé, A & le Roux, A, 2009. Advances in spatial analysis to support a more nuanced reading of the South African space economy. Urban Forum 20(2), 195–214. doi: 10.1007/s12132-009-9061-1
- Woolfrey, L. (2014). An open African data approach to improving data quality. Development Policy Research Unit Policy Brief 14/42, University of Cape Town, Cape Town.
- World Council on City Data, 2017. World council city data for the united nations sustainable development goals. http://www.dataforcities.org/
- Yu, D, 2007. The comparability of the statistics South Africa October household surveys and labour force surveys. Stellenbosch economic working papers: 17/2007. Stellenbosch University, Stellenbosch.
- Yu, D, 2009. The comparability of labour force survey (LFS) and quarterly labour force survey (QLFS). Stellenbosch economic working papers: 08/2009. Stellenbosch University, Stellenbosch.