
ABSTRACT
Working poverty exists worldwide and has shown an increase in prevalence over the past few decades. Over the years, there has been an increase in the number and severity of low-wage employment, which in turn contributes significantly to poverty. Whilst paid employment has generally been considered as the predominant means to survive financially, salaries may be too low to maintain reasonable living standards. South African research on low-wage employment and working poverty in particular, are rare. Using data from the first four waves of the National Income Dynamics Study, this study fills the existing research gap by examining low-wage employment, working poverty, and low-wage poverty. The empirical findings indicated that all three groups are predominantly lowly-educated, middle-aged African female employees involved in elementary occupations in the informal sector.
1. Introduction
Whilst paid employment is generally considered the predominant means of avoiding poor living standards, the past two decades have seen a rise in the complex phenomenon of working povertyFootnote1 worldwide (Eardley, Citation1998; Nolan et al., Citation2010; Cheung & Chou, Citation2015). Over time, low-wage employment (LWE) has increased in both number and severity, contributing significantly to poverty (Nolan & Marx, Citation1999). While individuals are engaged in paid work, salaries are too low for households to maintain ‘a reasonable standard of living’ (Cheung & Chou, Citation2015:318).
Working poverty has been a well-researched problem internationally; in the USA, more than 11% of the population reside in poor households with at least one employed member (Brady et al., Citation2010:560). In Hong Kong, 54% of the population living in poverty were working poor in 2012 (HKSAR Government, Citation2013). Sub-Saharan Africa’s working poverty rate in 2016 was 33.1% for workers earning less than US $1.90 and 30% for those earning between US $1.90 and $3.10, per day (ILO, Citation2016).
South Africa remains a country with persistently high levels of poverty and inequality (Leibbrandt et al., Citation2016; Statistics South Africa, Citation2017). Moreover, the incidence of LWE has become more concerning with the increasing informalisation of employment (Yu, Citation2012; Rogan & Skinner, Citation2018). Not only are workers paid wages below the amount necessary to maintain a decent living standard, but legally employees are not entitled to health or retirement benefits (Lilenstein et al., Citation2016). Moreover, low-wage work is generally associated with poor working conditions and job insecurity, such as an environment detrimental to employee health and safety, discrimination by employers, excessive work hours, insufficient opportunities for skills development, as well as a lack of surety or legal protection regarding continuation of employment (Sverke et al., Citation2006; Alli, Citation2008; Bryson & Freeman, Citation2013).
While wage employment is generally expected to reduce poverty incidence, some employees remain poor as wages are too low to alleviate them and their family members out of poverty. This may be the most intuitive cause of working poverty, but the relationship between LWE and working poverty is not as straightforward as one may believe. Multiple studies actually reveal a weak relationship between the two factors, while still emphasising that LWE may be a contributing factor in the evaluation of working poverty (Nolan & Marx, Citation2000; Crettaz & Bonoli, Citation2010; Halleröd et al., Citation2015). The relationship between low earnings and working poverty also remains inexplicit. Low labour force participation, low work intensity and the presence of a high number of dependent household members may all contribute towards the increase of working poverty (Crettaz & Bonoli, Citation2010; Cheung & Chou, Citation2015; Lilenstein et al., Citation2016; Kenworthy & Marx, Citation2017).
While a plethora of local studies on poverty and inequality (e.g. Tregenna & Tsela, Citation2012; Van der Berg, Citation2014; Akanbi, Citation2016; Leibbrandt et al., Citation2016; Statistics South Africa, Citation2017) exist in literature, only a handful of studies deal with LWE and working poverty (to be discussed in Section 2.2). However, these studies did not examine these two phenomenons comprehensively over a long duration, not to say they also did not empirically investigate whether some workers suffer both LWE and working poverty at the same time. The following research questions thus arise: who are the low-wage employed, working poor and low-wage poor (i.e. low-wage employed and working poor simultaneously), and what are the odds of each phenomenon taking place? This study aims to answer these questions to fill the existing local research gap, by using data from the first four waves of the National Income Dynamics Study (NIDS), which took place in 2008, 2010/2011, 2012 and 2014/2015, respectively.
2. Literature review
2.1. Definition of key concepts
Two common definitions of ‘low wage’ exist in literature. Firstly, the absolute definition is based on ‘an estimation of what a household requires to earn above the income poverty threshold’ (Grimshaw, Citation2011:3). An absolute low-wage threshold is useful to analyse the relationship between LWE and poverty, because the threshold is linked to the poverty line (Altman, Citation2007; Visser & Meléndez, Citation2015). For example, Oosthuizen (Citation2012) sets an absolute low-wage threshold at US $2 per day. The second definition sets the low-wage threshold based on ‘a percentage of the median or average wage for the economy’ (Grimshaw, Citation2011:3). Thus, a comprehensive relative threshold, endorsed by the OECD, is two-thirds of median wage in the base year (OECD, Citation1996, Citation2015).
The term ‘working poor’ refers to those who work and reside in poor households (Majid, Citation2001; Strengmann-Kuhn, Citation2004; Gunatilaka, Citation2010; ILO, Citation2016). This implies further inspection into who is deemed a worker and what constitutes poverty (Fleury & Fortin, Citation2006:10). For example, Mosisa (Citation2003:13) only considers persons who spend at least 27 weeks either working or looking for work in his approach, whereas Altman (Citation2007) includes only persons defined as workers earning less than R2 500 per month when identifying the working poor.
It is also important to adopt a working poor definition that is not only based on the poverty line, but also takes into account a country’s labour market characteristics, such as the size of the working-age population, labour force participation rate and unemployment rate.Footnote2 Moreover, by examining labour market characteristics and poverty data simultaneously, working poverty estimates that provide ‘a clearer picture of the relationship between poverty and employment’ can be obtained (Kapsos, Citation2004:2).
2.2. Review of past empirical studies
While there are numerous international studies on LWE (Stewart, Citation2007; Cuesta & Salverda, Citation2009; Lee & Sobeck, Citation2012; Visser & Meléndez, Citation2015; Schnabel, Citation2016), to the authors’ knowledge, only three South African studies exist. First, Valodia et al. (Citation2006) examined LWE using the 2000 and 2004 Labour Force Survey (LFS) data. Two monthly low-wage thresholds were used, namely R1 000 and R2 500, in constant 2000 prices. Upon including all workers for the analysis, LWE probability increased from 46.7% to 50.1% and 22.2% to 26.6% using the former and latter thresholds, respectively. The majority of the low-wage workers were Africans below 45 years and without Matric. Moreover, LWE probability was significantly higher (90%) for those in agriculture and private household sectors.
Second, Altman (Citation2007) used the R2 500 per month threshold to examine LWE with the aid of the 2004 LFS data, and found that LWE probability was above 80% for workers in the agriculture and private household industries, as well as three broad occupation categories, namely skilled agriculture, elementary occupations and domestic workers. The third author, Oosthuizen (Citation2012), only included employees with non-zero earnings when analysing the 2001 and 2007 LFS data. The author calculated the low-wage threshold at two-thirds of the 2007 median hourly wage, adjusted for inflation. This yielded a real threshold of R6.14 and R8.33 for 2001 and 2007 respectively, in constant 2007 prices. The empirical findings indicated that low-pay employees accounted for 38% of total wage employment in 2001, but this proportion dropped to 32% in 2007. Moreover, lowly-educated female Africans engaged in informal, domestic work were associated with significantly higher odds of LWE.
Moving on to working poverty, numerous international studies have been conducted over the years, such as Eardley (Citation1998), Brady et al. (Citation2010), Crettaz & Bonoli (Citation2010), Gunatilaka (Citation2010), Cheung & Chou (Citation2015), Horemans et al. (Citation2016) as well as Hick & Lanau (Citation2017), but few local studies exist. Rogan & Reynolds (Citation2015) examined the 1997–99 October Household Survey (OHS) and 2004–12 General Household Survey (GHS) data. They adopted the lower-bound (R323) and upper-bound (R593) per capita per month poverty lines in 2000 prices, with more emphasis on the former threshold. The empirical findings indicated that the working poverty rate declined from 28.8% in 1997 to 21.4% in 2012, whereas the overall poverty rate dropped from 59.53% to 48.06% when the full population was included. In addition, the percentage of working poor individuals residing in households that received at least one type of social grant increased rapidly from 18% to 63% between 1997 and 2012. The study also found that social grant income’s relative contribution to working poverty reduction rose slightly from 2% to 3% during the same period.
Lilenstein et al. (Citation2016) investigated which groups of employees were most vulnerable to poverty, by analysing the third wave of the NIDS data. Using the poverty threshold of R649 per capita per month in 2012 December prices, the empirical findings derived by the authors indicated a poverty rate of 17% among employed workers and 19% among households with at least one employed member. In addition, poor workers were predominantly female AfricanFootnote3 rural residents with low educational attainment, and were either casually employed or self-employed.
Finn (Citation2015) also used the third wave of NIDS data and a poverty line of R1 319 per month per capita (in 2015 April prices) to examine the relationship between wages and poverty; the sample was restricted to employees who earned a non-zero wage and worked at least 35 h per week. Poor workers were found to be predominantly African urban residents working in the tertiary sector, in particular the trade industry. The author also derived a working poverty line based on workers who lived in poor households and the mean wage that they earned. This line was estimated at R4 125 per month, interpreted as the minimum wage required for the working poor to escape poverty. Using this working poverty line, the author found that the working poverty rate exceeded 80% for agricultural (89.6%) and domestic (95.2%) workers.
Lastly, Vermaak (Citation2010) conducted sequential regression multivariate imputation (SRMI) to impute missing values for the 2000 and 2006 LFS earnings data, before using the R150 and R500 per capita per month (in 2000 prices) thresholds to examine working poverty. After the SRMI, the working poverty rate dropped from 5% to 3% and from 25% to 18% at each threshold, respectively.
in the Appendix summarises the key empirical findings of the above reviewed past local studies. It can be seen that the NIDS data was seriously under-utilised to examine LWE and working poverty over time, not to say low-wage poverty was not examined at all locally.
3. Method and data
3.1. Method
In the first part of the empirical analysis, we present descriptive statistics on the incidence of LWE and working poverty. Regarding the former, we employ both the absolute and relative approaches to measuring LWE. First, an absolute threshold is set in accordance with the proposed national minimum wage legislation, that is, R3 500 per month in nominal terms at the time of 2017 May (Republic of South Africa, Citation2017; Bhorat & Stanwix, Citation2018). Regarding the relative approach, we calculate the low-wage threshold at two-thirds of the median hourly wage in the base year. Since existing literature provides great uncertainty as to which year should be the base year, we derive three relative thresholds. To sum up, the four low-wage thresholds in 2016 December prices are:
Threshold [A]: the proposed national minimum wage of R3 264.93 per month – this amount is used in all four waves of NIDS data to identify the low-wage employed;
Threshold [B]: Two-thirds of the monthly median earnings with the earliest survey as the base year (wave 1 in 2008) which amounts to R1 465.20, before we use this amount to distinguish the low-wage employed in all four waves;
Threshold [C]: Two-thirds of the monthly median earnings with the latest survey as the base year (wave 4 in 2014–15) which amounts to R1 798.56, and we use this amount in all four waves to classify the low-wage employed;
Threshold [D]: Two-thirds of the monthly median earnings for each wave of NIDS, that is, wave 1: R1 465.20; wave 2: R1 893.94; wave 3: R2 040.82; wave 4: R1 798.56.
Threshold [D] is the focus of the forthcoming empirical analysis unless stated otherwise. Also, whilst this study utilises the term ‘low-wage’ rather than ‘low-earnings’, LWE is estimated using monthly earnings.
Next, descriptive statistics on the incidence of working poverty are determined, with the aid of the upper bound poverty line of R779 per capita, per month in 2011 prices, as derived by Statistics South Africa (Citation2015). This is equivalent to R1 071 in 2016 December prices. An individual is considered working poor if he or she is employed and resides in a household whose monthly per capita income falls below the poverty threshold (Strengmann-Kuhn, Citation2004; Rogan & Reynolds, Citation2015). Thus, the working poor definition incorporates ‘two statistical units’, namely the individual and household. The individual forms the basis for determining the working classification while the household forms the basis for determining the poor classification (Majid, Citation2001:272–73). The study also estimates the incidence and probability of being both low-wage employed and working poor, that is, low-wage poor. summarises how the three groups of workers are distinguished.
Table 1. Summary of employed population groups.
With regard to the econometric model, suggests that the two outcomes, LWE and working poverty, are not independent of each other in that an individual may be working poor because he or she is low-wage employed. Moreover, the severity of his working poverty status may increase as his LWE status persists. ‘In such an instance bivariate probit models would be appropriate as they allow for the interdependence of outcomes’ (Chisadza, Citation2015:12).
This model contains two binary dependent variables, namely LWE and working poverty status. Two separate equations, each with its own error term, are jointly modelled. There may be a correlation between the error terms of the two equations, however. That is, both equations may have unobserved variables in common which impact both outcomes (Cotei & Farhat, Citation2011). If the error terms in the two equations are correlated, the model would yield more efficient parameters than when modelling the two dependent variables separately with univariate probit models (Meng & Schmidt, Citation1985).
The bivariate probit model estimates correlation between the error terms of the two equations, represented by correlation coefficient (rho). If rho is positive, the error terms of the two equations are correlated and the two outcomes are best modelled jointly (Oyekale, Citation2015). One shortcoming of this model is that it only derives coefficients and not marginal effects, making detailed interpretation challenging. The coefficients only express the direction of the impact the explanatory variable has on the dependent variable, and not the magnitude of the impact (Chisadza, Citation2015).
The bivariate probit models include demographic (age, gender, population group and geographic location), education (years of educational attainment), work (employment type, occupation, industry and sector) and household-level (number of children, elderly, employed members and unemployed members) explanatory variables to control for the impact that these characteristics may have on LWE and working poverty probabilities.
For the final part of the empirical analysis, we only include those who were employed in all four waves (4.26 million in weighted terms) to examine the changes in LWE status over time. We distinguish three categories of low-wage employed: chronically (three to four waves), transitorily (one to two waves) and never low-wage employed, before we investigate the profile of each category. We also conduct the same analysis on the working poor and low-wage poor by classifying them into three groups.
3.2. Data
Data from the first four waves of NIDS is utilised. NIDS is South Africa’s first national panel study, conducted by the Southern Africa Labour and Development Research Unit at the University of Cape Town. The sample size is 28 226, 34 085, 37 397 and 42 337 individuals for waves 1, 2, 3 and 4 respectively (Chinhema et al., Citation2016). The empirical analysis in Sections 4.1 and 4.2 utilises the full NIDS samples with post-stratified weights, whereas only the balanced panel component is analysed with the results weighted with the panel data weight (which is available when the wave 4 data was released) in Section 4.3.
We use NIDS data for the study because it contains information on both person-level labour income (necessary for analysing LWE) and household income (necessary for analysing working poverty). There is only limited information on work activities despite the availability of both personal and household income data in the Income and Expenditure Survey, whereas the Quarterly Labour Force Survey only captures personal income. The GHS collects both person-level labour income and household expenditure, but the latter is captured in bands with only 10 intervals provided.
Finally, NIDS allows for the capture of multiple labour income sources, with total labour income being the sum of income earned from these sources: primary and secondary jobs; casual work; self-employment; 13th cheque; profit share; extra payment on a piece-rate basis; other bonuses from the primary job; other sources; and helping a friend with their business.
4. Empirical findings
4.1. Descriptive statistics
in the Appendix shows that, despite some fluctuations during the 7-year period, LWE probability decreased between waves 1 and 4 across all four low-wage thresholds. A similar downward trend was observed by Valodia et al. (Citation2006) and Oosthuizen (Citation2012) for the 2000–04 and 2001–07 periods, respectively. In all four waves, LWE probability was the highest using the absolute threshold [A]. In fact, the estimates were 20–30 percentage points higher than those derived using the three relative thresholds [B]-[D].
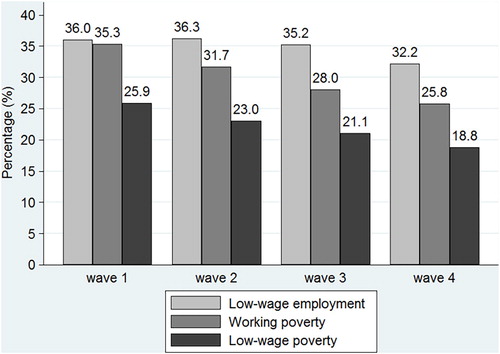
shows that of the total employed population, the working poverty rate decreased continuously from 35.3% to 25.8% between waves 1 and 4. This coincides with the general downward trend in poverty incidence as found by the recent South African studies (Leibbrandt et al., Citation2010; Bhorat et al., Citation2014; Van der Berg, Citation2014). Nonetheless, there was still one quarter of workers being distinguished as poor in wave 4. The odds of someone being both low-wage employed and working poor is also shown in the figure as well as in the Appendix – the probability dropped from 25.9% to 18.8%.
Figure 1. Low-wage employment, working poverty and low-wage poverty probabilities.
The demographic characteristics of the low-wage employed, working poor and low-wage poor in waves 1 and 4 are presented in . These three groups share a similar profile: they were predominantly females (slightly above 50% share), Africans (90%), aged 38 years on average, without Matric (this share was approximately 80%), and residing in urban areas in the KwaZulu-Natal and Gauteng provinces. On average, there were five household members, with two of them being employed.
Table 2. Demographic characteristics of low-wage employed, working poor and low-wage poor, wave 1 versus wave 4 (%).
In terms of labour market characteristics, shows that for all three groups, the majority of them were employees (about 50%) involved in elementary occupations (40% share in wave 4), the private households, community, social and personal (CSP) services as well as the wholesale and retail trade industries (about 20% share in each broad industry category). Finally, the low-wage employed, working poor and low-wage poor mainly worked in the informal sector (the respective shares being 72%, 63% and 73% at the time of wave 4).
Table 3. Work characteristics of low-wage employed, working poor and low-wage poor, wave 1 versus wave 4 (%).
4.2. Econometric analysis
presents the results of the bivariate probit regressions in waves 1 and 4. Females were significantly more likely to be both low-wage employed and working poor in both waves. With regard to population group, coloured, Indian and white workers were significantly less likely to be low-wage employed and working poor in wave 1 only. These two probabilities significantly declined as the worker became older, as indicated by the negative coefficient which increased in absolute terms across the older age cohorts. The results on the province dummies are somewhat mixed. Nonetheless, the general finding is that Gauteng workers were significantly less likely to be low-wage employed and working poor, whereas the opposite took place for the Northern Cape and KwaZulu-Natal workers, compared to Western Cape (reference province category). There was also a significant but concave relationship between education years and these two probabilities, that is, LWE and working poverty probabilities declined at an increasing rate as the years of educational attainment of the worker increased.
Table 4. Bivariate probit regressions on low-wage employment and working poverty likelihoods, waves 1 and 4.
Moving onto the coefficients of the explanatory variables in connection with work characteristics, compared to the reference occupation category (i.e. managers), workers involved in elementary occupations suffered significantly greater odds of LWE and working poverty in both waves. These probabilities were only positive and significant for skilled agricultural workers in wave 1, as well as service workers and operators in wave 4. With regard to the industry dummy variables, compared to the mining workers (reference category), in general, workers from other broad industry categories were significantly more likely to be low-wage employed (wave 1) and working poor (both waves). Furthermore, LWE and working poverty probabilities were significantly higher for informal sector workers, self-employed and casual workers.
Finally, for the household-level explanatory variables, the empirical findings suggest that LWE and working poverty probabilities significantly increased for workers coming from large-sized households with the presence of more children. However, these odds decreased significantly for workers living in households with the presence of more elderly and employed adult members.
4.3. Further analysis
In this section, only those who were employed in all four waves are included for the analysis. First, shows that more than half of workers in the balanced panel were never low-wage employed (56%), working poor (58%) and low-wage poor (70%), during the 7-year period. In contrast, 17%, 18% and 9% were chronically low-wage employed, working poor and low-wage poor respectively.
Table 5. Different groups of low-wage employed, working poor and low-wage poor workers, in the balanced panel.
presents findings for the transitions in LWE, working poverty and low-wage poverty respectively, between waves 1 and 4. Starting with LWE, 55% of low-wage employed in wave 1 no longer suffered this status in wave 4. Next, about 60% of working poor individuals in wave 1 exited this status at the time of wave 4, whereas 62% of those who were initially low-wage poor no longer suffered this inferior status in wave 4.
Table 6. Low-wage employment, working poverty and low-wage poverty transition matrices (row totals): wave 1 versus wave 4.
Lastly, and in the Appendix presents the profile of the three groups at the time of wave 4. The majority of chronically low-wage employed are lowly-educated (without Matric), middle-aged (35–45 years) female Africans who resided in urban areas and the Gauteng and KwaZulu-Natal provinces, and worked as informal sector employees in elementary occupations as well as private household, wholesale and retail industries. The respective profiles of the chronically working poor and chronically low-wage poor are highly similar, except that for the former group it was rather the male share being dominant.
5. Conclusion
This study examined LWE, working poverty and low-wage poverty by examining the first four waves of the NIDS data. The LWE, working poverty and low-wage poverty rates, as percentage of total employment, decreased between waves 1 and 4. These three socio-economic conditions are largely experienced by female, African, middle-aged and urban-resident workers, as well as informal sector workers and workers employed in elementary occupations and in the private household industry. Moreover, findings revealed that, on average, all three groups of workers resided in households with five household members, only two of which were employed. The balanced panel component analysis also found that the chronically low-waged employed, working poor and low-wage poor shared almost the same characteristics as discussed above.
It is evident that previously disadvantaged workers (women and African) still face a greater risk of earning low wages and being poor. This may be linked to low educational attainment, a factor revealed to also increase the probability of LWE and working poverty. Past discriminatory laws in South Africa limited access to quality education by African and female citizens; whilst over 20 years has passed since the abolishment of such laws, the effects of its initial existence are still felt. Government should focus on policy aimed at providing affordable (if not free) quality education and skills training to previously disadvantaged communities. Moreover, the education and training programmes should focus on skills and competencies demanded by the labour market (Festus et al., Citation2016; Lilenstein et al., Citation2016).
Similarly, LWE and working poverty are highly associated with unstable work environments and security such as those experienced by workers in the informal sector and workers with low-skilled occupations (for example, workers in elementary occupations such as domestic workers, street vendors and those who perform simple construction tasks). Policy prescriptions should aim to promote economic growth and infrastructure development within the informal sector, and increase awareness and enforcement of labour regulations with respect to workers in low-skilled or elementary occupations (Valodia et al., Citation2006; Oosthuizen, Citation2012; Murahwa, Citation2016). Focus should be placed on creating quality jobs and transforming existing unstable, low-paying jobs to more stable work environments that pay workers higher earnings (Rogan & Reynolds, Citation2015). Government and the private sector should provide small and informal business owners with easy access to financial and organisational support. That is, to provide them with the skills and knowledge on how to manage and grow their businesses in terms of finances, supply chain processes, employees, customer service and its responsibility to the community and environment (Jiyane et al., Citation2013; Policy, Strategy, Information and Research Department, Citation2016). Furthermore, there should be an increase in the awareness of minimum statutory employment conditions among elementary occupation workers and employers, together with the implementation of effective mechanisms to monitor and enforce compliance (Murahwa, Citation2016).
Increasing the national minimum wage for all sectors may be somewhat contentious. Households cannot meet their basic needs with the current minimum wage, while employers cannot afford an increased minimum wage without running the risk of having to let workers go. The level of minimum wage also does not assist self-employed persons (Lilenstein et al., Citation2016). In this case, the state may assist businesses with special taxation benefits, wage subsidies and training opportunities for workers (Levinsohn et al., Citation2014; Ruzek, Citation2014; Makgalemele, Citation2017).
Also, workers with similar occupations should be encouraged, informed and assisted with the unionisation and formation of their own companies. For example, the number of household cleaning service companies has seen rapid growth over the years (Du Toit, Citation2013). With the formation and proper management of such outsourced companies, elementary occupation workers such as domestic workers, gardeners and labourers can also access financial assistance, tax and wage benefits, and training opportunities through their companies. Moreover, the creation of such companies allows for collective representation, which in turn allows for better monitoring and compliance of employment regulations, consequently increasing job security (Murahwa, Citation2016). The provision of these aids will require consistent monitoring to ensure that businesses are regularly up-skilling their staff and legally taking advantage of tax and wage benefits, to alleviate LWE and working poverty.
The composition of households also plays a significant role in the increased probability of earning low wages and being poor. Results show that larger households with many children not only increase the odds of LWE and working poverty, but it also increases the duration in which these socio-economic conditions are experienced. The additional financial responsibility brought on by children, coupled with low educational attainment and work experience, exacerbates working poverty. Thus, the public and private sectors, non-profit organisations and community members themselves should set up campaigns which increase awareness around effective family planning and the importance of education. These initiatives are particularly important at institutions where many young people are situated, such as schools, universities, libraries and malls (Program for Appropriate Technology in Health (PATH) and United Nations Population Fund, (UNFPA) Citation2006; Longwe et al., Citation2012).
Disclosure statement
No potential conflict of interest was reported by the authors.
Notes
1 Individuals who suffer working poverty will be referred as ‘working poor’ for the rest of the study.
2 In this study, two key criteria, namely labour market status (a person-level variable) and poverty status (a household-level variable) are used to distinguish the working poor – to be explained in Section 3.
3 There are four population groups in South Africa, namely Africans, Coloureds, Indians and Whites. The first three groups of people are collectively known as ‘Blacks’.
References
- Akanbi, OA, 2016. The growth, poverty and inequality nexus in South Africa: Cointegration and causality analysis. Development Southern Africa 33(2), 166–85.
- Alli, B, 2008. Fundamental principles of occupational health and safety. 2nd edn. International Labour Office, Geneva.
- Altman, M, 2007. Low wage work in South Africa. Human Sciences Research Council, Pretoria.
- Bhorat, H & Stanwix, B, 2018. Wage setting and labor regulatory challenges in a middle income country setting: The case of South Africa - Background note for the South Africa systematic country diagnostic. World Bank Group Working Paper 127303. World Bank, Washington, DC.
- Bhorat, H, Tseng, D & Stanwix, B, 2014. Pro-poor growth and social protection in South Africa: Exploring the interactions. Development Southern Africa 31(2), 219–40.
- Brady, D, Fullerton, A & Cross, J, 2010. More than just nickels and dimes: A cross-national analysis of working poverty in affluent democracies. Social Problems 57(4), 55985.
- Bryson, A & Freeman, R, 2013. Employee perceptions of working conditions and the desire for worker representation in Britain and the US. Journal of Labor Research 34(1), 1–29.
- Cheung, K & Chou, K, 2015. Working poor in Hong Kong. Social Indicators Research 129(1), 317–35.
- Chinhema, M, Brophy, T, Brown, M, Leibbrandt, M, Mlatsheni, C & Woolard, I, 2016. National income dynamics study panel user manual. Southern Africa Labour and Development Research Unit, University of Cape Town, Rondebosch.
- Chisadza, S, 2015. A bivariate probit model of the transition from school to work in the post-compulsory schooling period: A case study of young adults in the Cape area. DNA Economics, Pretoria.
- Cotei, C & Farhat, J, 2011. An application of the two-stage Bivariate Probit–Tobit model to corporate financing decisions. Review of Quantitative Finance and Accounting 37(3), 363–80.
- Crettaz, E & Bonoli, G, 2010. Why are some workers poor? The mechanisms that produce working poverty in a comparative perspective. The Reconciliation of Work and Welfare in Europe (RECWOWE) Working Paper No. REC-WP 12/2010. RECWOWE Publication, Edinburgh.
- Cuesta, MB & Salverda, W, 2009. Low-wage employment and the role of education and on-the-job training. Labour (committee. on Canadian Labour History) 23(S1), 5–35.
- Du Toit, D, 2013. From “Cinderella cleaners” to “maids from heaven”: Clients’ and domestic workers’ perceptions of housecleaning services in Stellenbosch. South African Journal of Labour Relations 37(1), 97–114.
- Eardley, T, 1998. Working but poor? Low pay and poverty in Australia. Social Policy Research Centre Discussion Paper No. 91. Social Policy Research Centre (SPRC), University of New South Wales, Sydney.
- Festus, L, Kasongo, A, Moses, M & Yu, D, 2016. The South African labour market, 1995–2015. Development Southern Africa 33(5), 579–99.
- Finn, A, 2015. A national minimum wage in the context of the South African labour market. National Minimum Wage Research Initiative Working Paper No. 1. National Minimum Wage Research Initiative, University of Witwatersrand, Johannesburg.
- Fleury, D & Fortin, M, 2006. When working is not enough to escape poverty: An analysis of Canada's working poor. Human Resources and Social Development Canada Working Paper No. SP-630-06-06E. Human Resources and Social Development Canada, Ottawa.
- Grimshaw, D, 2011. What do we know about low-wage work and low-wage workers? Analysing the definitions, patterns, causes and consequences in international perspective. International Labour Office, Geneva.
- Gunatilaka, R, 2010. Sri Lanka’s working poor. International Labour Office, Geneva.
- Halleröd, B, Ekbrand, H & Bengtsson, M, 2015. In-work poverty and labour market trajectories: Poverty risks among the working population in 22 European countries. Journal of European Social Policy 25(5), 473–88.
- Hick, R & Lanau, A, 2017. In-work poverty in the UK: Problem, policy analysis and platform for action. Cardiff University, Cardiff.
- HKSAR (Government of the Hong Kong Special Administrative Region), 2013. Hong Kong poverty situation report 2012. Government of the Hong Kong Special Administrative Region, Hong Kong.
- Horemans, J, Marx, I & Nolan, B, 2016. Hanging in, but only just: Part-time employment and in-work poverty throughout the crisis. IZA Journal of European Labor Studies 5(5), 1–20.
- ILO (International Labour Organisation), 2016. World employment social outlook: Trends 2016. International Labour Office, Geneva.
- Jiyane, G, Majanja, M, Mostert, B & Ocholla, D, 2013. South Africa as an information and knowledge society: The benefit to informal sector women entrepreneurs. South African Journal of Libraries and Information Science 79(1), 1–12.
- Kapsos, S, 2004. Estimating growth requirements for reducing working poverty: Can the world halve working poverty by 2015? Employment Strategy Department Employment Paper No. 2004/14. International Labour Office, Geneva.
- Kenworthy, L & Marx, I, 2017. In-work poverty in the United States. IZA Discussion Paper No. 10638. IZA Institute of Labor Economics, Bonn.
- Lee, S & Sobeck, K, 2012. Low-wage work: A global perspective. International Labour Review 151(3), 141–55.
- Leibbrandt, M, Finn, A, Argent, J & Woolard, I, 2010. Changes in income poverty over the post-apartheid period: An analysis based on data from the 1993 project for statistics on living standards and development and the 2008 base wave of the national income dynamics study. Studies in Economics and Econometrics 34(3), 25–44.
- Leibbrandt, M, Finn, A & Oosthuizen, M, 2016. Poverty, inequality, and prices in Post-Apartheid South Africa. In Arndt, C, McKay, A & Tarp, F (Eds.), Growth and poverty in sub-Saharan Africa. Oxford University Press, Oxford, 393–418.
- Levinsohn, J, Rankin, N, Roberts, G & Schöer, V, 2014. Wage subsidies and youth employment in South Africa: Evidence from a randomised control trial. Stellenbosch Economic Working Paper No. 02/14. Stellenbosch University, Stellenbosch.
- Lilenstein, K, Woolard, I & Leibbrandt, M, 2016. In-work poverty in South Africa: The impact of income sharing in the presence of high unemployment. SALDRU Working Paper No. 193. Southern Africa Labour and Development Research Unit, University of Cape Town, Rondebosch.
- Longwe, A, Huisman, J & Smits, J, 2012. Effects of knowledge, acceptance and use of contraceptives on household wealth in 26 African countries. Nijmegen Center for Economics Working Paper No. 12–109. Radboud University, Nijmegen.
- Majid, N, 2001. The working poor in developing countries. International Labour Review 140(3), 271–91.
- Makgalemele, M, 2017. Do tax incentives promote development of small medium enterprises that ultimately yield economic growth? Unpublished Masters Dissertation, University Of Witwatersrand, Johannesburg.
- Meng, C & Schmidt, P, 1985. On the cost of partial observability in the bivariate probit model. International Economic Review 26(1), 71–85.
- Mosisa, A, 2003. The working poor in 2001. Monthly Labor Review 126(11/12), 13–19.
- Murahwa, B, 2016. Monitoring and enforcement: Strategies to ensure an effective national minimum wage in South Africa. National Minimum Wage Research Initiative Working Paper Series No. 5. National Minimum Wage Research Initiative, University of Witwatersrand, Johannesburg.
- Nolan, B & Marx, I, 1999. Low pay and household poverty. Luxembourg Income Study Working Paper No. 216. Luxembourg Income Study, Luxembourg.
- Nolan, B & Marx, I. 2000. Low pay and household poverty. In M Gregory, W Salverda & S Bazen (Eds.), Labour market inequalities: Problems and policies of low-wage employment in international perspective. Oxford University Press, Oxford, 100–199.
- Nolan, B, Whelan, C & Maitre, B, 2010. Low pay, in-work poverty and economic vulnerability: A comparative analysis using EU-SILC. University College Dublin Geary Institute Discussion Paper No. WP 201028. Geary Institute, University College Dublin, Dublin.
- OECD (Organisation for Economic Co-operation and Development), 1996. Oecd employment outlook 1996. OECD Publishing, Paris.
- OECD (Organisation for Economic Co-operation and Development), 2015. Oecd employment outlook 2015. OECD Publishing, Paris.
- Oosthuizen, M, 2012. Low pay in South Africa. International Labour Review 151(3), 173–92.
- Oyekale, A, 2015. Factors explaining households’ cash payment for solid waste disposal and recycling behaviors in South Africa. Sustainability 7(12), 15882–99.
- Policy, Strategy, Information and Research Department, 2016. Economic development and growth in Ethekwini: Embracing microbusiness in the informal economy. Policy, Strategy, Information and Research Department, Ethekwini Municipality, Durban.
- Program for Appropriate Technology in Health (PATH) and United Nations Population Fund (UNFPA), 2006. Meeting the need: Strengthening family planning programs. PATH and UNFPA, Seattle.
- Republic of South Africa, 2017. National minimum wage bill 41257 of 2017. Government Gazette, Pretoria.
- Rogan, M & Reynolds, J, 2015. The working poor in South Africa, 1997–2012. Institute of Social and Economic Research Working Paper 2015/4. Institute of Social and Economic Research, Rhodes University, Grahamstown.
- Rogan, M & Skinner, C, 2018. The size and structure of the South African informal sector 2008–2014: A labour-force analysis. In Fourie, F (Ed.), The South African informal sector: Providing jobs, reducing poverty. Human Sciences Research Council (HSRC) Press, Pretoria, 77–102.
- Ruzek, W, 2014. The informal economy as a catalyst for sustainability. Sustainability 2015(7), 23–34.
- Schnabel, C, 2016. Low-wage employment. IZA World of Labor, Bonn.
- Statistics South Africa, 2015. Methodological report on rebasing of national poverty lines and development on pilot provincial poverty lines: Technical report. Statistics South Africa, Pretoria.
- Statistics South Africa, 2017. Poverty trends in South Africa: An examination of absolute poverty between 2006 and 2015. Statistics South Africa, Pretoria.
- Stewart, M, 2007. The interrelated dynamics of unemployment and low-wage employment. Journal of Applied Econometrics 22(3), 511–31.
- Strengmann-Kuhn, W. 2004. Working poor in Europe: A partial basic income for workers? In G Standing (Ed.), Promoting income security as a right: Europe and North America. Anthem Press, London, 253–268.
- Sverke, M, Hellgren, J & Näswall, K, 2006. Job insecurity: A literature review. The National Institute for Working Life, Stockholm.
- Tregenna, F & Tsela, M, 2012. Inequality in South Africa: The distribution of income, expenditure and earnings. Development Southern Africa 29(1), 35–61.
- Valodia, I, Lebani, L, Skinner, C & Devey, R, 2006. Low-waged and informal employment in South Africa. Transformation: Critical Perspectives on Southern Africa 60(1), 90–126.
- Van der Berg, S, 2014. Inequality, poverty and prospects for redistribution. Development Southern Africa 31(2), 197–218.
- Vermaak, C, 2010. The impact of multiple imputation of coarsened data on estimates on the working poor in South Africa. World Institute for Development Economics Research Working Paper No. 2010/86. World Institute for Development Economics Research, United Nations University, Helsinki.
- Visser, MA & Meléndez, E, 2015. Working in the new low-wage economy: Understanding participation in low-wage employment in the recessionary era. Journal of Labor and Society 18(1), 7–29.
- Yu, D, 2012. Defining and measuring informal employment in South Africa. Development Southern Africa 29(1), 157–75.