
 ?Mathematical formulae have been encoded as MathML and are displayed in this HTML version using MathJax in order to improve their display. Uncheck the box to turn MathJax off. This feature requires Javascript. Click on a formula to zoom.
ABSTRACT
This paper investigates a disruption hypothesis that student learning is lost as a direct consequence of teacher strike action in South Africa. At face value estimates from a within-student across-subject analysis suggest that teacher strike participation negatively affects learning for students in the poorest three quarters of schools. Strike action also limits access to nutrition as school closures prevent student participation in daily school feeding programmes. However, despite controlling for student and school level factors that may drive teacher selection into strike participation, unobserved teacher characteristics continue to bias estimates. Assuming that selection on observable characteristics can tell us something about selection on unobservable characteristics, there is an implied negative selection of teachers into strike participation.
1. Introduction
In the transition to South Africa’s democracy in 1994, teachers’ unions played an important role in advocating for positive transformations and resisting apartheid injustices (Chisholm, Citation1999; Govender, Citation2004). In the early 90’s, trade union involvement in reform negotiations helped establish a far more equitable salary structure for teachers, equalising salary scales that had disproportionately favoured white and male educators (Van der Berg & Burger, Citation2010). Today, however, some may argue that the excessive influence unions now wield presents a binding constraint to improvement in education, especially in implementing higher levels of accountability (Van der Berg et al., Citation2016).
Union impacts on educational outcomes have not been explored in quantitative research in South Africa due to a lack of school survey data identifying teacher union members; although studies have discussed the implications of the introduction of new teacher pay systems catalysed by industrial action and union negotiations (Armstrong, Citation2014; Gustafsson & Patel, Citation2008; Van der Berg & Burger, Citation2010). Yet even if data were not a limitation, estimating causal union impacts on educational outcomes is challenging given the labour relations and political framework in which unions operate (Alvarez et al., Citation2007; Murillo et al., Citation2002). In the United States, studies exploit the differential nature and timing of the introduction of collective bargaining agreements across states and districts to estimate this relationship (Hoxby, Citation1996). By contrast, collective bargaining on issues related to wages and education policy takes place at a national level in South Africa. Bargaining agreements are not differentially applied across provinces.
This paperFootnote1 considers just one way in which unions influence education, investigating a disruption hypothesis that opportunity to learn is lost through teacher strike participation. This is possible through exploiting heterogeneity in strike activity among teachers within the same school, applying a student fixed effects analysis to the 3rd survey implemented by the Southern and Eastern Africa Consortium for Monitoring Educational QualityFootnote2 (SEACMEQ III).
This is a topical issue in light of a proposal tabled in 2013 by members of the African National Congress and then again by the largest opposition party, the Democratic Alliance in September 2017, for the declaration of teaching as an ‘essential service’ (Phakathi, Citation2017). These proposals have gathered little momentum in the face of union opposition and supported by The Constitution which enshrines the right to strike. Nevertheless, these proposals are premised on the notion that strike activity is damaging to teacher professionalism (where strikes disrupt the system and are occasionally characterised by riots, outbreaks of violent protest and intimidation) and are harmful for students (Patillo, Citation2012; Von Holdt, Citation2012). The latter is an untested assumption in developing countries in general.
The next section provides background on teachers’ unions and industrial action in the South African education sector. A description of the estimation strategy and data used follow. Results are presented in section 4. The within-student, across-subject fixed effect estimates suggest that teacher strike activity negatively affects learning for students in the poorest three quartiles of schools in South Africa with implications for widening learning inequalities across poorer and wealthier students. But the method goes only some way in eliminating sources of endogeneity. Application of techniques by Altonji et al. (Citation2005) and Oster (Citation2019) in section 5 indicates that it is not possible to rule out that strike effects are driven by omitted variable bias at the level of the teacher, even after controlling for student and school level factors that may inform teachers’ selection into strike action. Assuming that selection on observables can tell us something about selection on unobservables, there is an implied negative selection into strike participation.
2. Background
2.1. International literature
Hoxby (Citation1996) identifies various pathways by which teachers’ unions may affect the education production function. Unionisation may influence the overall budget for school inputs and budgetary mix across alternative inputs. The efficiency with which schools’ inputs are used may also be altered through unionised teachers’ engagement with school inputs. How altered levels and allocations of inputs translate into student achievement gains or losses depends on whether unionised teachers are ‘rent-seeking’ or ‘efficiency-enhancing’ in their behaviour. Therefore, ultimate determination of union impacts comes from a weighing and sifting of the empirical evidence (Bennett & Kaufman, Citation2007:4).
As expected, the evidence on impacts of teachers’ unions on educational outcomes in developed countries is mixed (Baker, Citation2013; Cowen & Strunk, Citation2015; Eberts, Citation2007; Grimes & Register, Citation1991; Hoxby, Citation1996). Despite less empirical evidence from developing contexts, it is more commonly argued that teachers’ unions undermine efficiencies in education (Kingdon et al., Citation2014) especially where teachers’ union power becomes absolute in the absence of strong political leadership, transparency, accountability and monitoring (Patrinos & Kagia, Citation2007). In India, union membership is inimical to learning. Kingdon & Teal (Citation2010) identify a causal negative effect on student achievement as large as 0.23 standard deviations. In Argentina, there is mixed evidence of teachers’ union impacts on teacher tenure, job satisfaction, and class sizes (Murillo et al., Citation2002). In Mexico, the strength of unions as well as their relations with state governments are considered strong predictors of state variation in school performance (Alvarez et al., Citation2007).
While theory supports the possibility of positive, negative or null union impacts on schooling outcomes, it predicts that rent-seeking industrial action will be accompanied by contemporaneously lower student achievement. If students are not in school or being taught, learning cannot take place. But the empirical evidence is contradictory. Negative strike effects on learning are observed in Canada and Belgium but in the United States some studies have identified null impacts (Baker, Citation2013; Belot & Webbink, Citation2010; Johnson, Citation2011; Zwerling, Citation2008).Footnote3 Explanations for these null impacts include that teachers make up for work stoppages so that total instructional time is unchanged and therefore opportunities to learn are unaffected (Zwerling, Citation2008). More plausibly, Baker (Citation2013) attributes the lack of identification of negative effects to uncontrolled sources of endogeneity bias at the level of the district, school, teacher and student. For example, where administration or management is weak, student discipline is a concern or teaching resources are limited, strike activity may be more prevalent as teachers attempt to secure better job conditions for themselves (Hoxby, Citation1996). These factors also affect learning. Additionally, students may match non-randomly to schools and to teachers, while teachers’ unobserved characteristics may themselves be correlated with their decision to strike (Kingdon & Teal, Citation2010).
Although panel data are typically required to control for these sources of endogeneity, cross-sectional school survey data that test students in more than one subject can be exploited to eliminate some sources of endogeneity bias (Kingdon, Citation2006).
2.2. Union membership and strikes in the South African education sector
During apartheid, separate education departments, divided along racial lines, implemented not only distinctive curricula for students but distinctive forms of authority over teachers. In contrast to the more professional treatment of white teachers, control over black teachers was intentionally bureaucratic and authoritarian in line with state intentions for social control (Chisholm, Citation1999). Racial injustices and authoritarian control over black teachers generated persistent teacher resistance (Govender, Citation2004).
While teacher unionisation has grown substantially in post-apartheid South Africa, union membership rates are not unusually high when compared with other education systems (Alvarez et al., Citation2007). Figures from the Public Service Co-ordinating Bargaining Council (PSCBC) and the Education Labour Relations Council (ELRC), indicate that roughly two thirdsFootnote4 of education personnel (including state-paid teachers, administrators, management, support staff and privately employed personnel in schools) are formally identified as members of a teachers’ union in South Africa. In absolute terms, this represents 380 000 members using 2012 data. Limiting the national teacher union membership estimate to only teachers working in schools, this estimate is likely to be higher. Armstrong (Citation2014:4) identifies that 76% of teachers are unionised using the Labour Force Surveys between 2000 and 2007. Shown in , rates of teacher union membership and union affiliation differ markedly across provinces.
Table 1. Union membership in the South African education sector, 2012.
There are different teachers’ unions in South Africa, but the dominant union is the South African Democratic Teachers’ Union (SADTU). They are an affiliate of the Congress of South African Trade Unions (COSATU)– in turn one of the three members in the tripartite ruling alliance – which prioritises their role as a political organisation over their function as a professional body (Chisholm, Citation1999; De Clercq, Citation2013). SADTU membership comprises two thirds of all registered teacher union members and has grown substantially over the past 20 years, with figures in 2012 that were 2.5 times that in 1996.Footnote5 SADTU’s membership growth was largely concentrated between 1996 and 1999 (Govender, Citation2004). The next largest teachers’ union is the National Professional Teachers’ Association of South Africa (NAPTOSA) with just over 50 000 members (or 15% of all teacher union members) in 2012.
In the past decade, strike activity in the education sector has varied notably from year to year. But 2007 and 2010 were exceptionally disruptive with the largest public sector strikes experienced in post-apartheid South Africa. The intensive strike in 2007 involved nearly 1 million public service workers from 17 unions; including nurses, teachers and other civil servants. Union members came out in support of a demand for an across-the-board increase of 12% in salaries, as well as increases in health and housing benefits (Von Holdt, Citation2012).
The 2010 public sector strike and teachers’ involvement in this would be even more prolific, but the 2007 strike was significant in catalysing the largest reform of the teacher pay system since transformations of the mid-1990s (Gustafsson & Patel, Citation2008:1). The Collective Agreement No. 1 of 2008 of the ELRC, which ushered in the Occupation Specific Dispensation (OSD), intended to convert a rather flat age-pay slope for teachers (a teaching career disincentive) into one that compared favourably to that of other professionals, and to teacher pay in other countries. But SADTU blocked pay-for-performance proposals. Notch progression – the opportunity for teachers to rise through the salary scale– was exchanged for large once-off increases in the pay of all educators in the final 2009 agreement.
Nevertheless, returns to experience for teachers have improved since the introduction of OSD over the period 2008–2010, eroding some of the relative unattractiveness of the teacher wage structure (Armstrong, Citation2014). While this is a potentially positive long-run impact of the 2007 strike, OSD has also contributed to a rising educator wage bill (amidst increasing national fiscal constraints) raising concerns for filling of vacant posts and the crowding-out of spending on textbooks and learner support materials.
It is difficult (if not impossible) to separate out the effects of an incentive programme such as the OSD that spans the entire schooling system from other factors that may improve learning (Gustafsson & Patel, Citation2008). We can however attempt to explore contemporaneous disruption effects of the strike on learning using SEACMEQ III (conducted in the September after the July strike). Despite its cross-sectional framework, strike participation does not affect all schools and teachers uniformly. While unions may officially call for a month-long strike, the number of days individual teachers choose to strike is variable across and within schools. This is consistent with research that identifies heterogeneity among union affiliates in South Africa in their opinions of and approaches to collective action (Buhlungu & Tshoaedi, Citation2012).Footnote6
3. Method and data
3.1. Estimation strategy
In the following equation, achievement scores of student i in subject j and attending school k is modelled as a function of student, school and teacher inputs:(1)
(1) A vector of student characteristics for the ith student in school k is represented by
and a vector of school characteristics in the kth school is represented by
. Where data are available for multiple subject teachers, their characteristics are not subsumed within S at the school level. Within the school, variation in characteristics
and strike participation,
, for the jth subject teacher are observed in school k. Unobserved characteristics of the student, the teacher and the school are reflected in the error terms
.
A student fixed effects analysis differences out observed and unobserved student and school characteristics from the estimation. The method examines whether the industrial action of different subject teachers in a school is related to a student’s marks across those subjects in a specific year. As Kingdon (Citation2006) explains, in a simple case of two subjects, unobservables at the level of the student, teacher, school (and higher administrative levels) are differenced out of the estimation as follows:(2)
(2) Assuming that school unobservables and student unobservables are subject invariant such that both μ and η do not have a j subscript, then within the kth school Equation (2) reduces to Equation (3). Student and school level heterogeneity is effectively differenced out of the equation.
(3)
(3)
3.2. Limitations
However, this strategy eliminates some but not all sources of bias. It does not remove unobserved teacher characteristics that may be both correlated with a teacher’s decision to strike, and student achievement. The requirement that
(4)
(4) for causal inference is not completely satisfied. If student ability is subject-varying, this will also bias the estimation.
Given this concern, I use a method proposed by Altonji et al. (Citation2005) and later expanded by Oster (Citation2019) to investigate the sensitivity of strike estimates to omitted variable bias.
3.3. Data
This student fixed effects estimation strategy requires cross-sectional data with at least two subject test scores per student and reasonable variation in the variable of interest, in this case teachers’ strike activity by subject (Kingdon, Citation2006).
The SEACMEQ III dataset for South Africa satisfies these criteria. It collects information on a representative sample of grade 6 students, testing them in 3 areas: health, reading and mathematics.Footnote7 These testing areas are covered in at least 3 of 8 compulsory subjects in the Revised National Curriculum. Health is 1 of 5 focus areas in the compulsory subject, Life Orientation (Department of Education, Citation2003).Footnote8 For comparative purposes scores in each subject are converted to a standardised score (a mean of zero and standard deviation of one).
The estimation strategy also requires that teacher characteristics vary across subjects. Fortunately, most of the student sample in South Africa is taught the three subject areas by more than one teacher. This is not the case for many other countries in the dataset (Hein & Allen, Citation2013). Out of a total sample of 9 071 South African students from 392 schools, only 743 students from 32 schools had a single teacher providing instruction in all the three subjects, while 2 717 students had two different teachers for the three subjects and 5 611 students had three different teachers for the three subjects. In total 1158 grade 6 teachers were surveyed. It is possible to link the characteristics of different subject teachers within a school to the achievement of their students in each subject.
3.4. Model specifications and descriptive statistics
In the estimations, teachers’ strike actionis represented in two ways as identified in . First, an indicator variable takes on a value of one if a teacher self-reports being absent during 2007 for a strike for at least one day (and 0 otherwise). Using this definition, 73% of the South African teachers sampled in SEACMEQ participated in the 2007 strikes – a figure closely comparable to Armstrong’s (Citation2014) estimate of teacher union membership at 76%. Second, a continuous variable for the total number of days a teacher was absent due to strikes that year is also used.
Table 2. Teacher strike activity by school wealth, SEACMEQ III 2007.
The pooled statistics in disguise considerable differences in industrial action across different parts of South Africa’s schooling system that were governed by distinct education departments during apartheid. The first is a system of schools serving a previously disadvantaged population of primarily black students and the second is one of historically privileged schools with a predominantly white student population.Footnote9 A commonly used proxy to identify these two systems is the average wealth status of the schools’ students (measured using an asset-based index of student socioeconomic status (SES) averaged at the school level), distinguishing between the poorest 75% and wealthiest 25% of schools.Footnote10
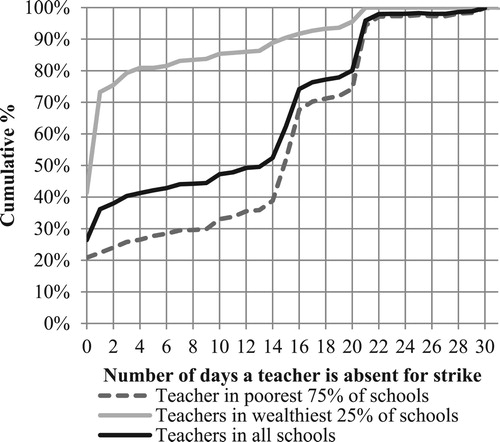
Strike activity in 2007 is more prevalent in the poorest three quartiles of sampled schools as indicated in . Here almost 50% of the teachers sampled went on strike for an average of 15 days or more, while in the wealthiest quartile of schools 50% of teachers sampled were on strike for no more than one day. – a cumulative percentage graph of the number of days teachers strike – visualises these stark differences in strike activity across these school groups. Yet these figures are derived from self-reported responses which suggests they are underestimates of actual strike days. Industrial action may have heterogeneous impacts on student achievement across these systems where studies consistently find separate data generating processes across these groups (Spaull, Citation2013). Therefore, OLS and fixed effects regressions are run separately for the poorest 75% of schools and the wealthiest 25% of schools.
Figure 1. Cumulative % graph of teachers’ strike absenteeism by school wealth status, SEACMEQ III 2007.
Following Kingdon & Teal (Citation2010), teacher characteristics are distinguished in the regressions into two types: variables that are most likely determined prior to joining a teachers’ union and those determined after unionisation. Motivating this approach is the possibility that teacher characteristics may be influenced by unionisation and the militancy of a teacher’s union involvement, so that including them in the production function could bias the strike estimates. The group of teacher variables most likely to be determined prior to union involvement is represented by :
reflects whether the teacher has completed a tertiary education (at least a first degree).
and
are self-explanatory. With respect to
training, most teachers have more than three years of training so this has been used as the reference category with indicator variables included for one year or less of training, two years and three years. Information on other teacher characteristics more likely to be determined post joining a union are represented by
:
reflects the total number of years of teacher experience and
is a proxy for the wealth of the teacher, taking on a value of one if a teacher reports that his or her home is in poor condition or in need of major repairs and zero otherwise. Three continuous variables are included as controls for a teacher’s
including self-reported days absent from school for own illness, funerals and ‘official business’ (such as courses, meetings or examinations in the current year). Two variables are used to capture teaching
identified by each teacher in a subject specific class. The first is a standardised index of teaching equipment as well as an indicator variable for whether there are enough sitting places for students in the classroom. Proxies for teachers’
, include total weekly self-reported hours spent on lesson preparation and marking outside of school, an indicator variable for whether a teacher gets parents to sign children’s homework and another indicator for whether a teacher meets monthly with the school principal to get advice on teaching. Finally, teachers’ subject specific test score results in the three subjects (numeracy, literacy and health) are included to account for their content knowledge.Footnote11
Unfortunately, 164 of 1 558 teachers did not complete the subject specific teacher tests in SEACMEQ III, reducing the available sample size. Before restricting the sample by including a test score, an indicator variable for whether the teacher completed the test is included in model 3 to assess the sensitivity of the estimates to the reduced sample size. Descriptive statistics of these teacher variables are provided in the supplementary appendix, Table A.1.
Model 1 includes only the variable of interest – teacher strike participation. In the second model, teacher characteristics determined prior to union involvement () are included, while model 3 includes post union teacher characteristics (
), except teacher tests scores. Model 4 limits the sample to those students whose teachers completed a subject specific test with the teacher test score as a control. All estimations include indicator variables for the subject test in question where mathematics is the reference category. They also control for probability weights in sampling and standard errors are corrected for clustering between subjects within a student.
4. Results
4.1. The impacts of teacher strike participation
The first section of presents OLS and fixed effects coefficients on the strike participation indicator for the poorest three quartiles and the wealthiest quartile of schools. In the privileged quartile of schools, with higher average student achievement and moderate teacher strike activity, there is no evidence of negative average impacts of teacher strike participation on student achievement. The student fixed effects estimate for striking at least one day is positive and significant in models 1–2 but reduces to positive 0.024 and becomes statistically insignificant in model 4.
Table 3. Estimating grade 6 test scores.
The observed impact of teacher strike participation on student learning in poorer schools is markedly different. In these schools, where teacher unions are strongly represented and strike activity is more militant in character, strike participation appears to be detrimental to learning. In the student fixed effects estimations in the second part of , the coefficient on strike participation is consistently negative and significant. In specification 1, with no other teacher controls, the fixed effect strike estimate is about 7.8% of a standard deviation in learning. Controlling for teacher characteristics likely to be determined before joining a union, reduces the estimate slightly to 6.5%, but adding the remaining teacher controls increases the negative effect to 10% in model 4. By contrast, the OLS estimates are consistently upwardly biased, small in size, positive and statistically insignificant. A similar pattern is observed in analyses of teacher unionisation in India (Kingdon & Teal, Citation2010).
The coefficient on strike participation in model 3, which includes an indicator for whether the teacher wrote the subject content knowledge test, is very similar in magnitude to that in the 4th specification which includes the teacher test score but results in the loss of observations in the estimation. This suggests that the negative coefficient of 10% is not biased by a reduced sample. The 4th model result is also robust to the split of the school sample by the socio-economic status (SES) of students. From the 40th to the 75th school SES percentile, the negative student fixed effects coefficients are concentrated around 10% of a standard deviation.
At face value, the results indicate that the 2007 public sector strike had negative consequences for student learning at the grade 6 level in the poorest 75% of primary schools. The absolute value of the coefficient on the strike participation indicator in these schools is roughly comparable to the coefficient on having a teaching degree as opposed to no degree. In which case, strike participation has the potential to counteract learning benefits associated with employing teachers with higher level university skills. The next section evaluates to what extent this estimate may be overestimated; but it is worth nothing that this effect possibly conflates a union membership effect with a strike effect. If this provides a proxy for the impacts of union membership on student learning, then this effect is notably smaller when compared with Kingdon & Teal’s (Citation2010) estimate that the achievement of students taught by unionised teachers in India is lower by 0.23 standard deviations.
Estimations are also re-run using a full set of teacher controls but replacing the dummy variable indicator for strike participation with a continuous variable for teacher days absent for strikes. Fixed effects estimates in indicate that in the poorest schools, a student’s achievement in a subject will decrease by 0.49% of a standard deviation if their teacher in that subject is absent due to strikes for 1 additional day. Although an additional day of absence for ‘official business’ (which may include attending union related meetings or activities, and training workshops organised by the department), is twice as detrimental to learning as an additional day of absence for strike activity.Footnote12 A positive but weakly significant coefficient of 0.15 is identified on days absent for own illness.
Table 4. Estimating grade 6 test scores using a continuous variable for strike absenteeism, poorest 75% of schools.
Strike impacts are anticipated to most negatively affect students who are the poorest and the weakest academically. This is implied in the different strike estimates observed across the poorest and wealthiest schools but reiterated when running the 4th specification model on sub-samples of rural versus urban schools and by quartiles of student achievement (using the dummy variable – strike participation) as seen in . A negative and significant strike coefficient as large as 17% of a standard deviation is observed for students in rural schools whereas no significant effects are identified for students in urban schools. Negative strike estimates for students in the bottom 3 quartiles of student achievement are observed while estimates are insignificant for top performing quartile of students. This mirrors the results obtained when disaggregating the sample by quartiles of school SES. While the magnitude of the negative coefficient increases across the first three quartiles of student achievement, coefficient sizes are not statistically different.
Table 5. Student fixed effect estimations of grade 6 test scores, sub-samples.
Marginalised students are also disproportionately affected by strikes in terms of access to nutrition. South Africa has a comprehensive national school nutrition programme (NSNP). By 2013 it had expanded to 78% of school children (roughly 9 million children in absolute terms).Footnote13 In 2007 when the NSNP was initially introduced, approximately 6 million children in the poorest quintile 1–3 schools were already beneficiaries. Feeding schemes are targeted at schools serving the poorest children – the same schools that are also closed for longer periods during industrial action. Unfortunately, principal self-reports in SEACMEQ on the days a school is closed are unreliable and underestimate lost learning relative to teacher reports of strike absenteeism.Footnote14 However a much larger dataset gathered at a similar time as SEACMEQ (after the public service strike), namely the Systemic Evaluation 2007, indicates that in schools where grade 3 students reported benefiting from a feeding scheme, on average 17 days were lost due to strike/boycott activity in 2007 as opposed to only ten days in schools without a feeding scheme (see ). While beyond the scope of this study, there may be interplay between lower student achievement observed and access to nutrition (see Glewwe & Miguel, Citation2008). This adds an interesting dimension to debates about teachers’ right to strike where children’s nutrition is improved through school feeding schemes.
Table 6. School days lost due to strikes/boycotts by school feeding.
5. Omitted variable bias
There is no available instrumental variable for strike action in the SEACMEQ III data that informs a teacher’s decision to strike but is uncorrelated with student learning. Instead I use Altonji et al.’s (Citation2005) method (hence forth AET) and a subsequent development on this method by Oster (Citation2019) to draw conclusions about potential omitted variable bias.
The AET method proceeds by carefully examining the selection on observable characteristics as a guide to selection on unobservables, identifying how large the bias from selection on unobservables would be if that selection is in the same order as the selection on observables. The equality of selection on observables and unobservables is reflected in the following condition,(5)
(5) where the error term,
, reflects teacher and other unobservables that are not differenced out through the student fixed effects. The relationship between strike participation and the index of observed teacher characteristics (normalised by the size of the variance in that index) is equated to the relationship between strike participation and the unobservable part that determines student achievement. Under the equality of selection assumption, it is possible to estimate the size of the asymptotic bias. If
and
are orthogonal then
is equivalent to
, where the tildes over the strike variable denote the residuals from a regression of that variable on teacher characteristics. The asymptotic bias in the estimate of interest is reflected as follows:
(6)
(6) Substituting from Equation (5), the bias in Equation (6) can be written as:
(7)
(7) The 3 components of Equation 7, namely
,
and
are estimated and used to calculate what the implied bias would be under the assumption of equality of selection on unobservables and observables (for a discussion on the implementation of this technique see Freier & Storck, Citation2012). The bottom of identifies the bias and ratio for the poorest 75% of schools. The ratio of the main treatment estimate divided by the implied bias provides a measure of how strong the selection on unobservables would have to be, relative to selection on observables, to explain the entire treatment effect.
The direction of the implied bias is negative (as the estimated value of is negative) and its size is multiple times larger than the observed strike effect. This reflects that the estimated negative strike effect in the poorest 75% of schools is overstated, where omitted variable bias could potentially account for the entire observed strike effect. The ratio calculated in the last column of implies that selection on unobservables would only have to be about 10% stronger than selection on observables to explain away the entire strike effect.
Oster (Citation2019) extends the AET methodology in evaluating the robustness of estimates to omitted variable bias but relaxes some of the restrictive assumptions of the AET method. Specifically, AET’s proposed test is valid only when the null hypothesis is a zero treatment effect, and implicitly assumes that including the unobservables would fully explain the outcome with an R-squared of 1. But an R-squared of 1 may underestimate the robustness of results if there is measurement error in the outcome. Oster’s methods allows researchers to calculate a consistent estimate of the bias-adjusted treatment effect, by assuming a value for the relative degree of selection on observed and unobserved variables () and a value for the maximum R-squared (
) that could reasonably be explained if all unobservables were accounted for in the estimation. Applied to this study, a bias-adjusted estimate around the coefficient of strike participation is approximated in the following equation:
The equation considers the movement in the coefficient on strike participation which is rescaled by the movement in R-squared values. Specifically,
is the strike coefficient from a controlled model (i.e. with teacher observables) while
is the strike coefficient from a simple ‘uncontrolled’ regression of the dependent variable on strike participation (subject dummies and an intercept only).
and
correspond to the R-squared from the controlled and uncontrolled models.
calculates bias-adjusted estimates corresponding to the fixed effects estimates in for the poorest three quartiles of schools. A value of 1 is assumed for (a proposed upper bound on the relative degree of selection on observed and unobserved variables) but different values are assigned for the maximum R-squared (
) that could be explained if all unobservables were accounted for in the estimations.
Table 7. Bias-adjusted effect sizes for the poorest 75% of schools, Rmax and delta – Oster method.
Oster recommends a value of that is about 1.3 times the size of the R-squared from a fully controlled model. But in this case where observables explain very little of the within student variation, it is reasonable to apply a more restrictive assumption. For example, if unobservable controls explain three times as much as observed controls so that
= 3*
– this is equivalent to an
. In this case, the bias-adjusted estimate associated with the 4th model specification in is −0.034. At an
of 0.18, the entire effect is explained away assuming
is 1. If we assume
of 1, akin to the AET method, then the proportional selection on unobservables relative to observables (i.e.
) would only have to be very small (0.13) to explain away the entire effect. In this respect, the same conclusions are reached that the estimates are extremely sensitive to the presence of unobserved teacher characteristics.
In Kingdon & Teal’s (Citation2010) estimation of union impacts, causal inference is supported through a positive Altonji bias given a positive relationship between observed teacher characteristics and union membership. By contrast, an inverse relationship between observed teacher characteristics and strike participation in South Africa drives the implied negative bias. It is important to note that while overall there is a negative association between an index of teacher characteristics and strike participation, some traditional indicators of quality are not consistently negatively associated with strike participation. For the sample of teachers in the poorest 75% of schools, I run a school fixed effects regression of observed teacher characteristics on whether a teacher participates in a strike. (Results are summarised in the supplementary online appendix).Footnote15 Contrary to expectations, some proxies for teacher quality are positively correlated with strike participation. Grade 6 teachers who get parents to sign homework or have more equipment or resources in their classrooms have higher levels of strike participation. Moreover, there is no significant association between strike participation or the number of days a teacher strikes and his or her content knowledge in a subject, even if allowing for a non-linear relationship between strike variables and teacher content knowledge. However, strike participation is more prevalent among teachers who spend less time outside of school time preparing for lessons and marking, a potential proxy for job satisfaction or motivation.Footnote16
6. Conclusion
This research investigated a disruption hypothesis that student learning was lost as a direct consequence of teacher participation in the 2007 public service strike. Using a within-student, across-subject fixed effects strategy, results initially suggest that there are heterogeneous impacts of strikes on student achievement. In the privileged upper quartile of schools, where strike participation is less common and the duration of strike action limited, no significant effects were identified. By contrast, in the poorer three quartiles of schools where participation in the strike was widespread, militant and longer in duration, strike activity appears to be detrimental to learning. A student’s performance in a subject taught by a striking teacher was estimated at about 10% of a standard deviation lower than his or her performance in a subject taught by a non-striking teacher. Larger negative strikes estimates are implied for more marginalised groups of students. At face value, these results indicate that industrial action may augment already unacceptable levels of inequality in learning.
Unfortunately, application of the Altonji et al. (Citation2005) method and a more recent extension by Oster (Citation2019) indicates that the negative strike effects observed in the poorest schools may still be strongly biased due to unobserved teacher characteristics. This occurs even after controlling for working conditions (as reflected in student and school level characteristics differenced out of the equation) that may drive teacher selection into strike participation. If we assume that selection on observables can tell us something about selection on unobservables, then there is an implied negative selection into strike participation in the poorest three quarters of schools. The patterns observed are suggestive that striking teachers in these schools have lower levels of motivation or job satisfaction. However, they do not have significantly lower content knowledge than non-striking teachers.
Descriptive evidence does suggest that children in poorer schools targeted with feeding schemes are disproportionately affected by strike activity. In this regard, debates about teachers’ ‘right to strike’ in developing country contexts extend beyond examining learning impacts to vital issues of child nutrition.
A lack of available data limits an investigation of the dynamic impacts of the 2007 public sector strike on learning, yet industrial action could lead to longer term educational improvements if teachers access better working conditions, negotiations introduce incentives that promote higher levels of effort, and better-quality personnel are attracted by improved wage profiles. While system improvements in South Africa have been evident in the past decade (Reddy et al., Citation2016), it is not yet possible to empirically attribute these to changes in teacher compensation. Further research is warranted to explore these long-run equilibrium effects.
Disclosure statement
No potential conflict of interest was reported by the author.
ORCID
Gabrielle Wills http://orcid.org/0000-0001-8040-474X
Additional information
Funding
Notes
1 This paper is derived from my doctoral thesis ‘An economic perspective on school leadership and teachers’ unions in South Africa’ (Wills, Citation2016), with a working paper version of chapter four of the thesis first appearing as a working paper (Wills, Citation2014).
2 The organisational name was originally abbreviated as SACMEQ but this has now been extended to SEACMEQ.
3 Patrinos & Kagia (Citation2007) review a related issue of teacher absenteeism and its impacts for learning in developing country contexts.
4 Included in both the numerator and denominator of the calculation are non-educator personnel such as provincial or district staff, school support staff and privately employed SGB or other staff members at the school level. Some studies have erroneously attributed teacher union membership figures reported by the PSCBC as referring to teachers only resulting in overestimates of teacher unionisation as high as 90% (see Govender Citation2004).
5 SADTU’s growth in membership in the 90s wasn’t merely the result of more teachers joining the profession. There was a large recruitment drive for members by SADTU on the back of the dawn of a new democracy. Govender (Citation2004) indicates that between 1993 and 1995 they had recruited over 80 000 new members, many of whom were young black teachers.
6 There are multiple teachers’ unions in South Africa and more than one union is often represented among staff in the same school. Calls to strike from different unions may vary in intensity, resulting in heterogenous strike action by teachers in the same school depending on their specific union affiliation. However, even where teachers are represented by the same union their response to union calls to strike may differ as described in Von Holdt (Citation2012).
7 SEACMEQ III was stratified using both explicit and implicit strata. The explicit stratification variable was 'region'; in the South African case this is analogous to the nine provinces. The implicit stratum is school size. To have greater control of the final sample size, sampling of schools was conducted using probability proportional to size, where a simple random sample of a fixed number of students is selected within each school (SACMEQ, Citation2010).
8 The health knowledge test was a true or false test focused primarily on assessing student’s knowledge about HIV/AIDs.
9 Schools serving the coloured and to a lesser extent the Indian population during apartheid are less systematically distributed between these 2 sub-systems.
10 When comparing student performance distributions by race and language against distributions by SES across different schooling datasets, student performance in the poorest 75% of schools matches closely with that in the previously disadvantaged system of schools (Spaull, Citation2013).
11 The teacher test scores, constructed using Rasch scaling, are directly comparable to the student test scores. A teacher’s test score takes on the standardised value of their test score for the subject taught.
12 Second to training and curriculum workshops organised by the Department of Education, the most common reason for official business leave has been identified as union-related (Reddy et al., Citation2010:77).
13 This figure is derived from the General Household Survey (GHS).
14 Principal reports of school closures due to industrial action or other events in the poorest 20% of schools is 7 days. But on average teachers in these principals’ schools report striking for 15 days. The discrepancy may also be due to the possibility that schools do not shut if some but not all teachers strike.
15 Striking teachers are older and are also more likely to be male and mathematics teachers as opposed to literacy or life skills teachers.
16 Murillo et al. (Citation2002) find a negative association between teacher union membership and job satisfaction in Argentina.
References
- Altonji, J, Elder, T & Taber, C, 2005. Selection on observed and unobserved variables: Assessing the effectiveness of Catholic schools. Journal of Political Economy 113(1 February), 151–184. doi: 10.1086/426036
- Alvarez, J, Moreno, VG & Patrinos, HA, 2007. Institutional effects as determinants of learning outcomes: Exploring state variations in Mexico. Policy Research Working Paper 4286. World Bank, Washington, DC.
- Armstrong, P, 2014. Teacher wages in South Africa: How attractive is the teaching Profession? Stellenbosch Economics Working Paper Series No. 08/14. University of Stellenbosch: Department of Economics, Stellenbosch.
- Baker, M, 2013. Industrial actions in schools: Strikes and student achievement. The Canadian Journal of Economics 46(3), 1014–1036. doi: 10.1111/caje.12035
- Belot, M & Webbink, D, 2010. Do teacher strikes harm educational achievement of students? Labour 24(4), 391–406. doi: 10.1111/j.1467-9914.2010.00494.x
- Bennett, JT & Kaufman, BE (Eds.), 2007. In What do unions do? A Twenty-year Perspective. Transaction Publishers, New Brunswick, NJ.
- Buhlungu, S & Tshoaedi, M, 2012. Chapter 1 – A contested legacy: Organisational and political challenges facing COSATU. In S Buhlungu & M Tshoaedi (Eds.), COSATU’s Contested Legacy. HSRC Press, Pretoria.
- Chisholm, L, 1999. The democratization of schools and politics of teachers’ work in South Africa. Compare: A Journal of Comparative and International Education 29(2), 111–126. doi: 10.1080/0305792990290202
- Cowen, J & Strunk, KO, 2015. The impact of teachers’s unions on educational outcomes: What we know and what we need to learn. Economics of Education Review 48(October), 208–223. doi: 10.1016/j.econedurev.2015.02.006
- De Clercq, F, 2013. Professionalism in South African education: The challenges of developing teacher professional knowledge, practice, identity and voice. Journal of Education 57(2013), 31–54.
- Department of Education, 2003. Revised national curriculum statement grades R-9 (schools): Teacher’s guide for the development of learning programmes policy guidelines: Life Orientation. Government Printer, Pretoria.
- Eberts, RW, 2007. Teacher unions and student performance: Help or hindrance? The Future of Children 17(1), 175–200. doi: 10.1353/foc.2007.0001
- Freier, R & Storck, J, 2012. The treatment effect of attending a high-quality school and the influence of unobservables. SOEPpapers on Multidisciplinary Panel Data Research, No. 530. Deutsches Institut für Wirtschaftsforschung (DIW), Berlin.
- Glewwe, P & Miguel, EA, 2008. Chapter 56: The impact of child health and nutrition in less developed countries. In P Schultz & JA Strauss (Eds.), Handbook of development Economics, Volume 4. Elsevier, North Holland, pp. 3561–3606.
- Govender, L, 2004. Teacher unions, policy struggles and educational change, 1994 to 2004. In L Chisholm (Ed.), Changing class: Education and social change in post-apartheid South Africa. HSRC Press, Cape Town.
- Grimes, P & Register, C, 1991. Teacher unions and black students’ scores on college entrance exams. Indusrial Relations: Journal of Economy and Society 30(3), 492–500.
- Gustafsson, M & Patel, F, 2008. Managing the teacher pay system: What the local and international data are telling us. Stellenbosch Economic Working Paper Series No. 26/06. University of Stellenbosch, Stellenbosch.
- Hein, C & Allen, R, 2013. Teacher quality in sub-Saharan Africa: Pupil fixed effects estimates for twelve countries. DoQSS Working Paper No. 13-08. Institute of Education, University of London, London.
- Hoxby, C, 1996. How teachers’ unions affect education production. Quarterly Journal of Economics 111(3), 671–718. doi: 10.2307/2946669
- Johnson, DR, 2011. Do strikes and work-to-rule campaigns change elementary school results? Canadian Public Policy 37(4), 479–494. doi: 10.3138/cpp.37.4.479
- Kingdon, G, 2006. Teacher characteristics and student performance in India: A pupil fixed effects approach. Global Poverty Research Group Working Papers GPRG-WPS-059. Global Poverty Research Group, Oxford.
- Kingdon, G, Little A, Aslam M, Rawal S, Moe T, Patrinos H, Beteille T, Banerji R, Parton B and Sharma SK, 2014. A rigorous review of the political economy of education systems in developing countries. Final Report. Education Rigorous Literature Review. DFID, London.
- Kingdon, G & Teal, F, 2010. Teacher unions, teacher pay and student performance in India: A pupil fixed effects approach. Journal of Development Economics 91, 278–288. doi: 10.1016/j.jdeveco.2009.09.001
- Murillo, MV, Tommasi, M, Ronconi, L & Sanguietti, J, 2002. The economic effects of unions in Latin America: Teachers’ unions and education in Argentina. Inter-American Development Bank, Washington, DC.
- Oster, E, 2019. Unobservable selection and coefficient stability: Theory and evidence. Journal of Business and Economic Statistics 37(2), 187–204. doi: 10.1080/07350015.2016.1227711
- Patillo, KM, 2012. Quiet Corruption: Teacher unions and leadership in South African schools. Honours thesis, Wesleyan University, Middletown, Conneticut.
- Patrinos, HA & Kagia, R, 2007. Chapter two: Maximizing the performance of education systems: The case of teacher absenteeism. In EJ Campos & S Pradhan (Eds.), The many faces of corruption: Tracking vulnerabilities at the sector level. World Bank, Washington, DC.
- Phakathi, B, 2017. DA wants education deemed an essential service to prevent strikes. Business Day, 22 September 2017. https://www.businesslive.co.za/bd/national/education/2017-09-22-da-wants-education-deemed-an-essential-service-to-prevent-strikes/.
- Reddy, V, Prinsloo, CH, Netshitangani, T, Moletsane, R, Juan, A & Janse van Rensburg, D, 2010. An Investigation into Educator Leave in the Ordinary Public Schooling System. Commissioned by UNICEF, for the Department of Education, July.
- Reddy, V, Visser, M, Winnaar, L, Arends, F, Juan, AL, Prinsloo, C & Isdale, K, 2016. TIMSS 2015 highlights of mathematics and science achievement of grade 9 South African learners. HSRC, Pretoria.
- SACMEQ, 2010. SACMEQ III project results: Pupil achievement levels in reading and mathematics. SACMEQ, Botswana.
- Spaull, N, 2013. Poverty & privilege: Primary school inequality in South Africa. International Journal of Educational Development 33(5), 436–447. doi: 10.1016/j.ijedudev.2012.09.009
- Van der Berg, S & Burger, R, 2010. Teacher pay in South Africa. Stellenbosch Economic Working Papers No. 26/10. Department of Economics, Stellenbosch University.
- Van der Berg, S, Spaull, N, Wills, G, Gustafsson, M & Kotzé, J, 2016. Identifying binding constraints to educational improvement. Synthesis report for the programme to support pro-poor policy development (PSPPD). Research on Socio-Economic Policy, Stellenbosch University.
- Von Holdt, K, 2012. Chapter 9 – COSATU members and strike violence: What we learn from quantitative and qualitative data. In S Buhlungu & M Tshoaedi (Eds.), COSATU's contested legacy. Human Sciences Research Council, Pretoria, pp. 186–209.
- Wills, G, 2014. The Effects of Teacher Strike Activity on Student Learning in South African Primary Schools. ERSA Working Paper. Economic Research Southern Africa. https://econrsa.org/system/files/publications/working_papers/working_paper_402.pdf.
- Wills, G, March 2016. An economic perspective on school leadership and teachers’ unions in South Africa. Doctoral Dissertation, Stellenbosch University, South Africa. http://resep.sun.ac.za/wp-content/uploads/2016/04/2016-02-21-G-Wills-PhD-School-leadership-and-teachers-unions-in-South-Africa-FINAL.pdf
- Zwerling, HL, 2008. Pennsylvania teachers’ strikes and academic performance. Journal of Collective Negotiations 32(3), 151–172.