
ABSTRACT
Demand for dairy products is growing fast in urban areas. Due to poorly developed rural infrastructure, urban dairy farms are pivotal in making milk available and affordable in towns and cities. Yet current supply fails to meet the increasing demand. In order to formulate fit interventions that can expand urban dairy production, a detailed understanding of urban dairy systems is needed. Using a cluster analysis approach, we profile 304 urban dairy farms in Mekelle, Northern Ethiopia, along three dimensions: input efficiency, market integration, and resilience towards demand seasonality. Our results suggest five distinctive farm types: surviving farms, processing female farms, young male entrepreneurs, established output-efficient farms, and established output-input-efficient farms. We observe large discrepancies in terms of dairy enterprise’s productivity, profitability, and suitability in future urban policy planning. For each of the identified dairy systems, we sketch potential intervention approaches that can feed into more tailored dairy development programmes.
1. Introduction
Economic progress is shifting the starchy-staple diets in the African continent towards food baskets that increasingly include nutrient-dense foods like animal-based produce. This nutritional transition occurs the fastest in urban areas (Hawkes et al., Citation2017). Depending on the considered livestock product, consumption is expected to have a three- to sevenfold increase by 2050 in sub-Saharan Africa. Alarmingly, growth in local production is not keeping up with this increasing demand (Herrero et al., Citation2014). Particularly urban areas are at risk of food and nutrition insecurity, given the rapid urbanisation trends; the total number of African dwellers is projected to rise from 400 million in 2010 to 1.3 billion by 2050 (UN-HABITAT, Citation2014). Identifying appropriate measures to mitigate the negative impact of urbanisation on food and nutrition security is thus pivotal.
Since livestock products are highly perishable and rural infrastructure is often poorly developed, production of such products in urban and peri-urban areas is thriving in many African countries (Amadou et al., Citation2012). Yet, agricultural activities in town and city centres are often unplanned and informal (e.g. Thornton et al., Citation2010). At the same time, policy makers and development practitioners are increasingly aware of the need of steering urban dairy production to safeguard the supply of livestock products in urban centres (UN-HABITAT, Citation2014). Scholarly studies have identified barriers and opportunities of urban livestock production in general (e.g. Hippolyte et al., Citation2015; Gororo & Kashangura, Citation2016; Roessler et al., Citation2016; Crump et al., Citation2019), but have insufficiently covered how these vary across different types and forms of livestock activities within cities. Urban dwellers keep livestock for different reasons and in different ways than farmers in rural areas. Additionally, there is a substantial degree of variation within the group of urban livestock keepers, as well as amongst those who specialise in particular livestock practices such as dairy. Establishing a comprehensive overview of such farm diversity,Footnote1 is essential in order to propose fit regulatory or supportive measures for policy making and programme development.
2. The Ethiopian dairy sector
In this paper, we focus on urban dairy production, as milk products represent the largest source of animal protein in developing countries (Gerosa & Skoet, Citation2013), using Ethiopia as a case study. Within SSA, Ethiopia hosts the largest estimated livestock herd and represents the second-most populous country. Moreover, Ethiopia is amongst one of the fastest urbanising countries in the world; its urban population is about to triple, from 15.2 million in 2012 to 42.3 million by 2034 (Ozlu et al., Citation2015). Recent figures estimate the annual national milk production at 5.2 billion litres. About 80% of this milk is produced by dairy cows and the remaining 20% is camel milk. Goat milk only represents a marginal share of the total annual milk production (i.e. 152 million litres a year) (Shapiro et al., Citation2017). Despite this large volume of cow milk produced, dairy cow productivity remains extremely low (yearly average of 125 kg milk/cow in lowland grazing zones to about 200 kg/cow in highland mixed farming and rainfall sufficient zones) (Mayberry et al., Citation2017). Availability and access to high-quality inputs and services (such as feed, genetics, and health care), as well as a poor market infrastructure and support still hamper milk production and productivity (Makoni et al., Citation2014; Chagwiza et al., Citation2016). Average per capita milk consumption has been estimated at around 20 L, although large variations can be found across towns and cities (Zijlstra et al., Citation2015). These low intake levels are in part due to limited supply, but can also be attributed to a variable demand. Demand seasonality of milk is high in Ethiopia because of fasting rituals that are traditionally embedded in the Orthodox Christian Church, the dominant religious community within the country. During fasting spells, that number to a total of 180–200 days a year, Orthodox followers are presumed to abstain from consuming any animal product. Fasting rituals make milk demand highly variable which is hard to cope with for milk producers and other actors in the dairy value chain (Makoni et al., Citation2014; Chagwiza et al., Citation2016).
Although rural dairy production is the main provider of milk in Ethiopia accounting for about 98% of the total national milk production (Zijlstra et al., Citation2015), smallholder dairy farm systems are rapidly emerging in urban and peri-urban areas and differ greatly from their rural counterparts. Rural dairy cattle farms operate extensive low-input low-output mixed crop livestock systems, where indigenous cattle are predominantly held to provide traction power. The milk produced is mainly used for household consumption and surplus milk is processed into butter and cheese. Urban dairy farming, on the other hand, consist of specialised production units often operated within the farming household’s residence compound, adopting zero-grazing systems due to land scarcity. Most of the feed is purchased, and agro-industrial by-products are often supplemented to the diet. Urban dairy holders typically own improved crossbreeds or pure grade exotic cattle, which give higher milk yields than local breeds. The bulk of produced fresh milk is marketed to neighbours through informal channels or to cafés and restaurants (Brandsma et al., Citation2013; Zijlstra et al., Citation2015; Tesfay et al., Citation2016).
3. Materials and methods
3.1. Data collection
A cross-sectional study was conducted in the seven sub-cities of Mekelle city, the regional capital of the Tigray region, between January and February 2016. Urbanisation in this region is slightly higher than the country’s average (16%) with one out of five living in urban areas (Brandsma et al., Citation2013). Mekelle is the sixth largest city of the country with a population of around 247,000 people aged 10 years and above (CSA, Citation2015). In Tigray, about 95% of the population adheres to the Orthodox Church (CSA, Citation2010), which creates a suitable context to analyse the resilience of dairy farm systems towards demand shocks such as Orthodox fasting events.
Based on the lists gathered from the governmental bureaus of agriculture within each sub-city, there are about 1400 dairy farms (officially) active in Mekelle, out of which we visited 304 for data collection. A Probability Proportional to Size design was used to determine the number of dairy farming households to be sampled within each sub-city. Once the number was set, farmers were selected by convenience. Four trained enumerators interviewed the farmers in the local language and a supervisor guided and closely monitored the data collection. An informed consent was obtained from all respondents. The semi-structured questionnaire used covered information on (a) household characteristics, (b) herd size and structure, (c) farmer experience and training, (d) labour force and labour division, (e) dairy production and marketing of dairy produce, (f) feed purchase, (g) land and credit usage, (h) asset and service ownership, (i) social capital, and (j) household income sources. The questionnaire was piloted before the actual survey took place. Only minor modifications were made after testing.
3.2. Statistical analyses and theoretical framework
Various exploratory statistical tools have been developed to gain insight in farm diversity. A popular method is typology construction that classifies farms into different clusters using multivariate techniques (Dossa et al., Citation2011). We used different clustering methods as it was shown that clustering algorithms may result in different grouping structures of a dataset (Gelbard et al., Citation2007). We report the results of a two-step cluster analysis using a log-likelihood distance measure as it yielded a meaningful classification of the dairy farms with a fairly high goodness-of-fit. Moreover, this method proved to be robust when incorporating different combinations of discriminatory variables. The advantage of a two-step clustering procedure is that it efficiently handles large data sets and that it does not require to predetermine the number of clusters to be generated (Sarstedt & Mooi, Citation2014). The algorithm assumes normality and independence of the included attributes, but remains fairly robust when these assumptions are violated (Chan, Citation2005).
A predefined set of discriminating variables was included in the cluster analysis. We deliberately classified dairy farms along three dimensions: (1) input efficiency measured by milk production to purchased feed ratio; (2) strategies farmers adopt to cope with Orthodox fasting events; and (3) the strength of the market linkages the farmers developed measured through fresh milk producer prices and milk price variation. The operationalisation of these indicators is explained below. We did not perform a factor analysis to reduce the number of explanatory variables in the cluster analysis as the attributes we included are not highly correlated (absolute values were below 0.6). The included indicators allow us to gain insight in the productivity and profitability of urban dairy enterprises as well as their suitability in future urban policy planning.
As urban dairy farm businesses are largely dependent on purchased feed, we included the milk production:feed cost ratio to gain insight into the production-economic viability of farm businesses.Footnote2 This variable was calculated based on the daily milk production and daily cost of purchased feed per animal (accounting for calves, heifers and milking cows). We only considered the feed purchasedFootnote3 and not that acquired through cut-and-carry or exchange, as their contribution was found to be negligible in the total feed uptake. The resulting feed costs typically represent the highest production cost (about 65–70%) (Delgado et al., Citation2008). High milk production:feed cost ratios signal higher input efficiencies of the dairy farms as more milk is produced per unit of feed cost.
As mentioned above, Orthodox fasting has a decisive impact on the dairy farm system in the study region. Fasting greatly affects milk prices and marketability leaving the farmers with few options during fasting: selling milk below production costs, processing milk to increase its shelf life, consuming the milk themselves, giving it away for free or just spoiling it. To assess robustness towards demand shocks resulting from Orthodox fasting, two variables were added, namely the percentage of produced fresh milk being sold and the percentage of produced milk being processed during fasting. We did not consider the percentage milk being consumed by the producing households nor the percentage milk given away during fasting as both strategies represented marginal activities in our dataset.Footnote4
Thirdly, we included two variables reflecting how well the farmers have integrated in the market, namely the minimumFootnote5 fresh milk producer price and the milk price fluctuation experienced by farmers (which we proxied using the difference between the maximum and minimum milk producer price). Farmers who have made good market agreements with their milk buyers, are expected to be more likely to experience smaller price variations and higher milk prices. Moreover, having reliable market outlets encourages dairy holders to invest more in commercial farm systems (Wouters & van der Lee, Citation2010).
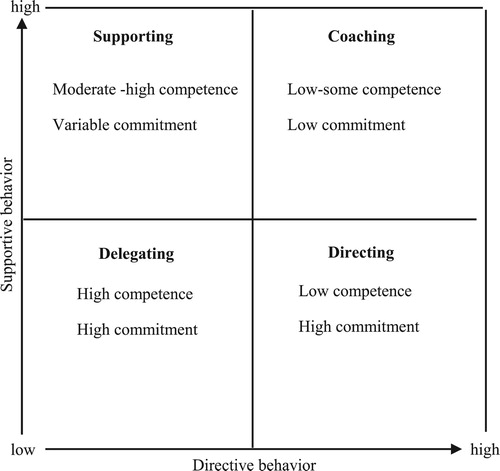
Once the clusters were identified using the discriminatory variables mentioned above, we assessed the differences between the identified farm clusters. For continuous variables, both parametric (ANOVA, Tukey) and non-parametric (Kruskal–Wallis, Chi-square, Mann–Whitney, Fisher’s exact) tests were applied. All analyses were performed using the SPSS 22 software. Having characterised the farm clusters, we disclose development prospects for each of the identified dairy systems. First, we try to identify the livelihood strategies adopted by the dairy systems based on the framework developed by Dorward et al. (Citation2009). We determine which farms are hanging in at subsistence level, who is able to step up and improve, and who is most likely to step out of dairy business. Using insights from the Situational Leadership Theory of Hersey & Blanchard (Citation1969) (), we single out required intervention styles for each dairy system to enhance farm businesses and performances. This theory argues that depending on the competence (ability) and commitment (willingness) of individuals (in this case farms), a leader (policy maker or a non-governmental organisation) should adapt its leadership style and vary the degree of direction and support that is given to the recipients. As such, four distinctive leadership approaches can be defined, which vary from a very tight and top down supervision and control (directing approach) to a merely laissez-faire and bottom-up approach (delegating style). In between these two extremes lie the coaching and supporting approach, more participatory approaches with the interaction between the leader and the individuals. The main difference in both styles lies in the fact that coaching requires more close supervision and direction.
Figure 1. Four leadership styles as set out by the Situational Leadership Theory (elaborated from Hersey & Blanchard, Citation1969).
4. Results and discussion
4.1. Identifying and characterising dairy system clusters
Despite some common features and characteristics, dairy systems score differently in terms of input efficiency, fasting coping strategies, and market integration ( and ). The cluster analysis categorised the dairy holders into five distinctive clusters which we qualified as follows: processing female farms (cluster 1; 21% of the sampled farms), surviving farms (cluster 2; 24%), young male entrepreneurs (cluster 3; 13%), established, output-efficient farms (cluster 4; 31%) and, established output-input-efficient farms (cluster 5; 12%).
Figure 2. Radar chart showing how the different identified farm clusters score relatively in terms of each other for the discriminatory variables and compared to the average dairy holder.
Note: For each discriminatory variable, the relative scores were calculated by dividing the average value of each farmer cluster by the maximum observed value amongst all farmer clusters.
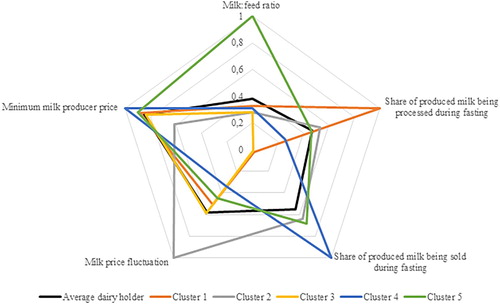
Table 1. Average values (mean ± SE) of the discriminatory variables used in the cluster analysis for the identified farmer clusters.
Farms in cluster 5 clearly outperform the other dairy systems (). Besides being thrice as input efficient compared to its peers, this farm cluster has developed proper fasting coping strategies and established good arrangements with their milk buyers, reflected by the stable and remunerative fresh milk price. Next in line are the dairy holders in cluster 4 who score best in terms of market integration and linkages. They seem to have made good arrangements in the output market as they face the smallest price fluctuations and receive higher milk prices than the other clusters. In terms of fasting coping strategies, all dairy systems seem to cope well with the Orthodox fasting events, except for dairy holders in cluster 3 who cease milk sales nor process the produced milk during fasting. This observation implies that the produced milk is largely spoiled, a big profit loss considering a total number of 180–200 fasting days a year. Farms in cluster 1 on the other hand specialised in milk processing during Orthodox fasting and have fairly good price arrangements with its milk buyers. Finally, dairy holders in cluster 2 are worse off as their milk prices are highly volatile and they receive far less for the milk they produce.
When looking into the socio-economic profiles (), clear patterns emerge. As such, cluster 1 is found to be characterised by a large share of female household heads. Moreover, female household members contribute significantly to the dairy labour force, which is not surprising as this cluster has specialised in milk processing, a task commonly carried out by women both in male- and female-headed households (Gebremedhin et al., Citation2014). Farming households in cluster 2 almost exclusively rely on dairy to sustain their families, whereas dairy farming, on average across the sample, contributes half to two-thirds to total household income. Households in this second cluster tend to have more illiterate or poorly schooled household heads. Cluster 3, on the other hand, is found to be dominated by young, educated, male entrepreneurs, who start up a dairy business because of lucrative reasons. Their household income per member is twice as high compared to that in the other farm clusters. Finally, dairy holders in clusters 4 and 5 share a rather similar socio-economic profile and both host households with significantly larger family sizes compared to the other dairy systems. But cluster 4 displays a significantly higher level of income diversification compared to all the other clusters as 4 out of 5 of their household heads is engaged in secondary and/or tertiary occupations. Moreover, clusters 4 and 5 are distinct on their social embeddedness, with dairy holders in cluster 5 having significantly larger network sizes and higher participation rates in finance groups.
Table 2. Socio-demographic characterisation of the sampled dairy farming households and their heads: mean ± SE for the continuous variables and frequencies for the categorical variables.
A comparison across the clusters on selected characteristics of the dairy farm system is given in . Overall, urban dairy farms are quite young enterprises with limited prior knowledge underscored by the observation that few households keep dairy animals because of family tradition and have on average only one or two relatives that are also engaged in dairy production. Clusters 4 and 5 share that they host the most experienced farm households. These dairy holders have been operating the dairy business for 10 years, roughly 3 years more than average dairy holders in the other dairy systems. Most farms indicate the generation of cash income as the most important reason for keeping dairy animals, while a significant fraction of farms in cluster 5 motivate their business as an investment opportunity. Herd sizes are relatively small (attributed by the farmers interviewed to obvious land scarcity), about two to five heads, although dairy holders in clusters 4 and 5 own one head more on average. All households predominantly keep crossbreeds, although the more experienced farm clusters 4 and 5 might occasionally have a cow from the indigenous breed in their farming compound. Dairy holders in clusters 4 and 5 tend to run their business together with their partner, whereas a larger proportion of single owners is found in the other clusters.
Table 3. Characterisation of the dairy farm systems: mean ± SE for the continuous variables and frequencies for the categorical variables.
Regarding the dairy network, we clearly see that only farms in cluster 3 know little other dairy farming households. But, dairy holders in this cluster as well as those in cluster 1 have a wide network of feed sellers and dairy buyers, whereas an opposite trend is observed for those in clusters 2, 4, and 5. Livestock extension services, artificial insemination, and trading dairy animals are common practice among urban farms, although farms in cluster 4 are significantly less involved in the latter two activities. Labourers are hired by around one-third of the farms across all clusters. These labourers are mainly young boys that take care of the daily feeding, milking, and cleaning tasks (similar findings are published by Duguma et al., Citation2011).
4.2. Differences between dairy systems/clusters
In this paragraph, we provide insights into why certain farm clusters perform better in terms of input efficiency, resilience towards demand shocks, and strength of market linkages.
Regarding feed practices, the following feed types are commonly included: crop residues (from e.g. cereals, pulses and oilseeds), wheat bran, and atella Footnote6 (see also Tesfay et al., Citation2016). Hay is used to a lesser extent and often operates to replace crop residues.Footnote7 Dairy holders in cluster 5 predominantly give a basal diet of hay to their herd (), which partly explains their better milk:feed ratio. Crop residues are known to be poorly digestible and protein-deficient, which in turn limits dairy productivity, while hay has slightly higher crude protein levels (Chalchissa et al., Citation2014). Furthermore, farms in this cluster offer more diverse diets, including four to five feed types on average. Leftovers from food or vegetables, salt and prepared feed mixtures are increasingly included by this cluster to supplement the basal diet. The usage of leftovers as non-conventional feed resource reduces feed costs for cluster 5, but simultaneously enriches the dairy diets (Wadhwa & Bakshi, Citation2013). The supplementation of sodium, on the other hand, tackles the subclinical sodium deficiency, that dairy animals are often faced with which hampers milk production (Suttle, Citation2010; Neckermann, Citation2017). The inclusion of leftovers, common salt and feed mixes are found to all result in an increased milk production and hence explain the higher input efficiency of farms included in cluster 5. This is illustrated in , with significant higher average milk yields in cluster 5 for the feed costs it invests. Dairy holders in cluster 5 spent about 4 times less on purchased feed to achieve the same milk output as those in the other clusters.
Figure 3. Average daily milk production and feed cost for the different identified farm clusters and the average dairy holder (indicated by the black line).
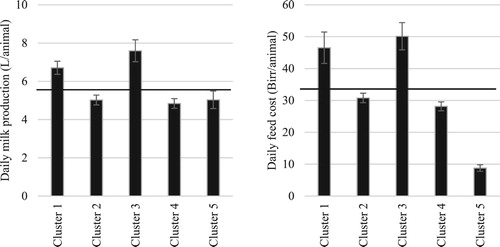
Table 4. Feeding practices within the identified farm clusters: mean ± SE for the continuous variables and frequencies for the categorical variables.
Investigating the feed market arrangements of the different clusters (of which we provide details in Supplementary material Table S.1, S.2, S.3 and S.4), reveals that overall, dairy holders in clusters 1, 3 and 5 consider quality as the most important contract detail in arrangements made with feed suppliers, whereas households in clusters 2 and 4 value the volume and price more. Households in clusters 1, 3 and 5 also make considerably more upfront payments for feed than those in clusters 2 and 4 who mainly pay at the time of transaction. Moreover dairy holders in clusters 1, 3 and 5 purchase significantly smaller quantities of feed. These dairy systems seem to invest in high-quality feeds which they purchase frequently, especially so for the roughages, which are known to deteriorate quick due to improper storage and conservation (Gebremedhin et al., Citation2009; Tesfay et al., Citation2016). Moreover, dairy holders in clusters 1 and 3 source more from rural farmers and less from traders and buy atella more often from local breweries. Despite these differences, dairy holders in clusters 1 and 3 seem to be less confronted with higher feed prices, hence the high feed costs they report might arise from the fact that they buy more feed per animal than do clusters 2 and 4. Dairy holders in cluster 2 experience the largest feed price fluctuations amongst all dairy systems, which confirms their vulnerable status; while farms in cluster 5 succeed in sourcing feed at the lowest prices. High milk productivity (probably due to better and more divergent feeding practices) as well as low feed prices (due to better arrangements with feed sellers and the use of food and vegetable leftovers) thus contribute to the high input efficiency of cluster 5.
Also, in terms of market integration and fasting coping strategies, we find clear differences between the clusters. Selling and processing milk during Orthodox fasting seem to be two opposite coping strategies (suggested by the negative correlation term in ). High price fluctuations and low milk prices drive dairy holders to process their produced milk, whereas an opposite trend is observed for fresh milk marketing. Traditional milk processing is a rather labour-intense and time-consuming activity. Studies by LIVES have revealed that in order to produce 1 kg of butter, on average 15.5 L of milk is needed (Hoekstra, Citation2014). Butter producer prices in our sample vary between 160 and 200 BirrFootnote8/kg. Fresh milk prices on the other hand fluctuate between 10 and 13 Birr/L. The value addition achieved by processing is thus almost negligible, which might explain why farmers barely process milk during non-fasting periods (). Except during Orthodox fasting, when milk demand drops significantly, processing of milk into butter might be interesting for urban farmers as it increases the shelf life of the dairy output so as to bridge the fasting period. As such, we observe that during fasting all dairy systems, except for cluster 3, process at least half of their milk production. Yet the processed milk is only marketed by households within clusters 1 and 2, who sell (surplus) butter to neighbours.Footnote9 Also for butter, dairy holders in cluster 2 receive lower prices and experience bigger price fluctuations as compared to cluster 1 (Supplementary material Table S.5).
Table 5. Correlation matrix of marketing variables and fasting coping strategies.
Table 6. Milk use and fresh milk marketing strategies among the identified farm clusters: mean ± SE for the continuous variables and frequencies for the categorical variables.
Studying the fresh milk arrangements reported by the dairy holders across the clusters, reveals that more dairy holders within clusters 4 and 5 sell their milk to different types of buyers, i.e. neighbours, cafés or traders (). Dairy holders included in these two clusters market their fresh milk relatively more to neighbours compared to other farm clusters, which might explain the better price arrangements they get. Moreover, the payment frequencies they report are less frequent (i.e. weekly or less than weekly), which might suggest that they have closer relationships with their milk buyers as delayed payment is often based on trust. Households in cluster 3 on the other hand sell about 80% of their produced milk to cafés, restaurants or hotels, which partially explains their higher frequency of written arrangements. Probably these milk buyers stop supplying milk (and other processed dairy products) to their customers during Orthodox fasting, which forces the entrepreneurs within cluster 3 to spoil most of the milk they produce during fasting. Again, we observe that dairy holders in clusters 1, 3 and 5 pay much more attention to milk quality than those in clusters 2 and 4, as was the case for feed as well.
An overview of the main characteristics of the identified urban dairy clusters can be found in .
Table 7. Short summary of the identified urban dairy systems.
4.3. Development prospects of the identified dairy clusters
Having characterised the farm clusters, this section aims at gaining insight in the development prospects of the identified urban dairy systems and elicits required interventions for each dairy system by using the livelihood strategies framework developed by Dorward et al. (Citation2009), combined with the Situational Leadership Theory of Hersey & Blanchard (Citation1969) (). We show that people who engage in urban dairy production aspire divergent livelihood strategies (from a merely survival strategy towards purely commercial interest). This results in large discrepancies amongst urban dairy enterprises in terms of productivity, profitability and their suitability in future urban policy planning.
Figure 4. Required intervention styles for the different identified farm clusters.
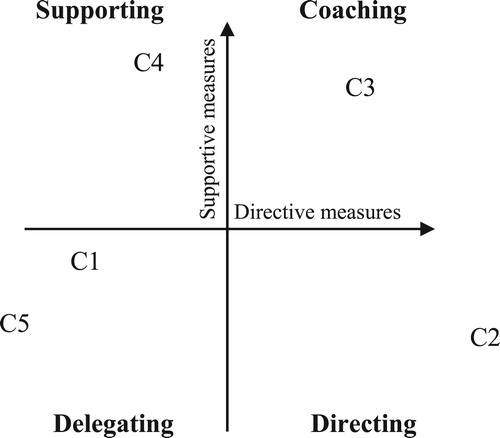
A quarter of the farms we interviewed was trapped into subsistence dairy activities, facing low returns on their investments. These farms, which we termed the surviving farms, are hanging in, and are trapped in a low productivity and efficiency cycle as they lack resources to invest (Tittonell, Citation2014). This cluster of farmers lacks knowhow and is incapable of achieving good dairy cow performances albeit these farmers are definitely willing and persistent to engage in dairy production as it constitutes their major or only source of household income. Improving their farm performance would require directing interventions, in which the farmers are closely and extensively followed up and told what to do and how, when and where to do it, and therefore this cluster might not be a priority subgroup from an intervention programme perspective.
Farms in clusters 1 and 3, female processing farms and educated male entrepreneurs respectively, on the other hand are capable and willing to intensify their dairy businesses, and step up, although farms in cluster 3 want it only partially suggested by the fact that they have not developed proper coping mechanisms for Orthodox fasting periods. Therefore, this cluster requires a more directive intervention approach compared to cluster 1 and should specifically be coached to help them develop proper market channels during Orthodox fasting. A potential strategy could be to link this dairy system to (formal) processing facilities and hence outsource dairy processing. These farms show interest in more formal arrangements suggested by their close cooperation with cafés, restaurants and hotels. Both farm clusters 1 and 3 seem to be the most promising for development programmes. They have fairly good input and output market arrangements, in which specific attention is paid to feed and milk quality, an ever-increasing issue for both consumers and producers.Footnote10 Farmers in cluster 3 have the potential to pave the way towards a more formal operation of the dairy value chain, given their interest of in commercial dairy farming. Farms in cluster 1 on the other hand could be particularly interesting given their specialisation in small-scale milk processing, a traditional task assigned to women. Ensuring women’s inclusion in scaling up and intensification of dairy production will be crucial to develop a gender-sensitive dairy sector, a key target for the Ethiopian government (Herego, Citation2017). It has been shown that urban agriculture empowers women thereby creating positive societal spill-over effects (Slater, Citation2001). Training and technology provision on milk processing might be the entry point in this farm cluster.
Farms in cluster 4, the established output-efficient farms, are a particular cluster. Even though these farms receive the highest milk prices, experience significantly smaller price fluctuations and are still able to sell a large part of their fresh milk during fasting, their input efficiency is rather low. These farms have two options: either they will step out of dairy farming or they will step up. In the former scenario, these farms keep dairy animals primarily to accumulate resources which will allow them to move into other activities that generate higher or more stable returns (Tittonell, Citation2014). If these farms want to step up, they need supporting interventions such as training on good feeding practices to help them improve their milk:feed ratio and information provision on the importance of qualitative feed and milk. This farm cluster should be convinced about the opportunities they have to expand their farm businesses so that they might shift their focus towards dairy farming as the majority of their household heads are involved in secondary and/or tertiary occupations predominantly in the non-farm sector (e.g. trade, construction, transport).
Finally, of all dairy systems, dairy holders in cluster 5, the established output-input-efficient farms, are performing best which paves the way for other farmers. They need little directive intervention, although they could still use supportive measures to raise their input efficiency, market integration, and resilience towards demand seasonality even more.
6. Conclusion
Our empirical research profiled 304 urban dairy holders in Mekelle, Northern Ethiopia, along three dimensions: input efficiency, market integration, and resilience towards demand seasonality. Based on these data, farms were classified into five distinctive urban dairy systems. These are (1) surviving farms, (2) processing female farms, (3) young male entrepreneurs, (4) established output-efficient farms, and (5) established output-input-efficient farms. Thus, on one extreme are surviving farms who are trapped into subsistence dairy activities, facing low returns on their investments. On the other extreme of the productivity spectrum, a small cluster of established output-input-efficient farms are found to be highly input efficient, well integrated into the dairy market and fairly resilient towards demand shocks, needing only small nudges to further enhance their farm operations. In between, there are three clusters of farms that all cope with a low-input efficiency and could use supportive measures to strengthen their market integration and resilience towards demand shocks. For each of the identified farm types, we sketch potential intervention methods which account for competences and willingness of the targeted dairy systems. Although the present research was case study based, similar farm profile types may be identified in other urban localities.
Acknowledgements
We would like to thank the anonymous reviewers for their careful reading of our manuscript and their insightful comments and suggestions.
Disclosure statement
No potential conflict of interest was reported by the authors.
Additional information
Funding
Notes
1 To our knowledge, only one paper has specifically addressed peri-urban dairy diversity (i.e. Toure et al., Citation2015).
2 We did not collect data on the dry matter intake of dairy cows due to accuracy problems; as such we could not use the feed conversion rate. Farmers are more likely to accurately report feed costs, hence our choice for milk production:feed cost ratio.
3 Calculations based on our collected data from the dairy farmers revealed that 95% of the feed fed to the dairy herd is acquainted through purchase.
4 Average percentage of produced milk that is consumed by farming households amounts to barely 4% during Orthodox fasting. Fifteen per cent of the households indicated to give away milk for free, but only 16 out of the 304 interviewed farms indicated to give away milk more ‘frequently’, which was on average less than 2 L of fresh milk a week.
5 We did not include the maximum fresh milk price because of its smaller deviation across different farms. Moreover, when including this variable in the cluster analysis instead of the minimum fresh milk price, we came up with only two farmer clusters which showed high intracluster heterogeneity across several farm characteristics.
6 Atella is a liquid by-product from local beer production in Ethiopia.
7 Less than one-third of the farmers use both crop residues and hay.
8 Birr is the unit of currency in Ethiopia.
9 In our sample of 304 urban farms, only 4 farms sell other dairy produce besides butter (e.g. cheese, yoghurt or buttermilk). Moreover, only 12 farms had other buyers than neighbours (e.g. trader, retailer, or café).
10 The recently launched Livestock Master Plan by the Ethiopian governments pays specific attention to quality improvement both in the input and output livestock markets, see Shapiro et al. (Citation2015).
References
- Amadou, H, Dossa, LH, Lomp, DJP, Abdulkadir, A & Schlecht, E, 2012. A comparison between urban livestock production strategies in Burkina Faso, Mali and Nigeria in West Africa. Tropical Animal Health and Production 44, 1631–42. doi: 10.1007/s11250-012-0118-0
- Brandsma, W, Mengistu, D, Kassa, B, Yohannes, M & van der Lee, J, 2013. The major Ethiopian milksheds. An assessment of development potential. Livestock research report 735. Wageningen UR Livestock Research, Wageningen.
- Chagwiza, C, Muradian, R & Ruerd, R, 2016. Cooperative membership and dairy performance among smallholders in Ethiopia. Food Policy 59, 165–73. doi: 10.1016/j.foodpol.2016.01.008
- Chalchissa, G, Mekasha, Y & Urge, M, 2014. Feed resources quality and feeding practices in urban and peri-urban dairy production of southern Ethiopia. Tropical and Subtropical Agroecosystems 17(3), 539–46.
- Chan, YH, 2005. Biostatistics 304. Cluster analysis. Singapore Medical Journal 46, 153–9.
- Crump, L, Mauti, S, Traoré, A, Shaw, A, Hattendorf, J & Zinsstag, J, 2019. The contribution of livestock to urban resilience: the case of Bamako, Mali. Tropical Animal Health and Production 51, 7–16. doi: 10.1007/s11250-018-1651-2
- CSA (Central Statistical Agency of Ethiopia), 2010. Population and housing census report 2007. Central Statistical Agency of Ethiopia, Addis Ababa.
- CSA (Central Statistical Agency of Ethiopia), 2015. Statistical report on the 2015 urban employment unemployment survey. Central Statistical Agency of Ethiopia, Addis Ababa.
- Delgado, C, Narrod, C & Tiongco, M, 2008. Determinants and implications of the growing scale of livestock farms in four fast-growing developing countries. IFPRI report 157. International Food Policy Research Institute, Washington, DC.
- Dorward, A, Anderson, S, Bernal, YN, Vera, ES, Rushton, J, Pattison, J & Paz, R, 2009. Hanging in, stepping up and stepping out: Livelihood aspirations and strategies of the poor. Development in Practice 19, 240–7. doi: 10.1080/09614520802689535
- Dossa, LH, Abdulkadir, A, Amadou, H, Sangare, S & Schlecht, E, 2011. Exploring the diversity of urban and peri-urban agricultural systems in Sudano-Sahelian West Africa: An attempt towards a regional typology. Landscape and Urban Planning 102, 197–206. doi: 10.1016/j.landurbplan.2011.04.005
- Duguma, B, Kechero, Y & Janssens, GPJ, 2011. Analysis of constraints facing urban dairy farmers and gender responsibility in animal management in Jimma town. African Journal of Basic and Applied Sciences 3, 313–8.
- Gebremedhin, B, Hirpa, A & Berhe, K, 2009. Feed marketing in Ethiopia: Results of rapid market appraisal. IPMS working paper 15. International Livestock Research Institute, Nairobi.
- Gebremedhin, B, Tegegne, A, Hoekstra, D, Jemaneh, S, Shiferaw, K, Bogale, A & Getahun, Y, 2014. Developing the butter value chain in Ethiopia. LIVES working paper 1. International Livestock Research Institute, Nairobi.
- Gelbard, R, Goldman, O & Spiegler, I, 2007. Investigating diversity of clustering methods: An empirical comparison. Data and Knowledge Engineering 63, 155–66. doi: 10.1016/j.datak.2007.01.002
- Gerosa, S & Skoet, J, 2013. Milk availability: Current production and demand and medium-term outlook. In Muehlhoff, E, Bennett, A & McMahon, D (Eds.), Milk and dairy products in human nutrition. Food and Agriculture Organization of the United Nations, Rome.
- Gororo, E & Kashangura, MT, 2016. Broiler production in an urban and peri-urban area of Zimbabwe. Development Southern Africa 33(1), 99–112. doi: 10.1080/0376835X.2015.1113123
- Grootaert, C, Narayan, D, Jones, VN & Woolcock, M, 2004. Measuring social capital: An integrated questionnaire. World Bank working paper 18. The World Bank, Washington, DC.
- Hawkes, C, Harris, J & Gillespie, S, 2017. Changing diets: Urbanization and the nutrition transition. In Stedman-Edwards, P (Ed.), 2017 Global food policy report. International Food Policy Research Institute, Washington, DC.
- Herego, E, 2017. Gender assessment of dairy value chains: Evidence from Ethiopia. Food and Agriculture Organization of the United Nations, Rome.
- Herrero, M, Havlik, P, McIntire, J, Palazzo, A & Valin, H, 2014. African livestock futures: Realizing the potential of livestock for food security, poverty reduction and the environment in sub-Saharan Africa. Office of the Special Representative of the UN Secretary General for Food Security and Nutrition and the United Nations System Influenza Coordination (UNSIC), Geneva.
- Hersey, P & Blanchard, KH, 1969. Life cycle theory of leadership. Training and Development Journal 23(5), 26–34.
- Hippolyte, L, Sangaré, M, Buerkert, A & Schlecht, E, 2015. Intra-urban and peri-urban differences in cattle farming systems of Burkina Faso. Land Use Policy 48, 401–11. doi: 10.1016/j.landusepol.2015.06.031
- Hoekstra, D, 2014. Helping Ethiopia’s rural women with butter processing. https://livesethiopia.wordpress.com/2014/11/14/women-butter-processing/ Accessed 27 August 2018.
- Makoni, N, Mwai, R, Redda, T, van der Zijpp, A & van der Lee, J, 2014. White gold: Opportunities for dairy sector development collaboration in East Africa. CDI report DCI-14-006. Centre for Development Innovation, Wageningen.
- Mayberry, D, Ash, A, Prestwidge, D, Godde, CM, Henderson, B, Duncan, A, Blummel, M, Reddy, YR & Herrero, M, 2017. Yield gap analyses to estimate attainable bovine milk yields and evaluate options to increase production in Ethiopia and India. Agricultural Systems 155, 43–51. doi: 10.1016/j.agsy.2017.04.007
- Neckermann, K, 2017. Mineral status of Zebu cattle (Bos indicus) in the Ethiopian rift valley. MS thesis, Ghent, Faculty of Veterinary Medicine, Ghent University.
- Ozlu, MO, Alemayehu, A, Mukim, M, Lall, SV, Kerr, OT, Kaganova, O, Viola, CO, Hill, R, Hamilton, E, Gapihan, AT, Ayane, BL, Aguilera De Llano, AI, Egziabher, TG & Gebretsadik, SZ, 2015. Ethiopia urbanization review: Urban institutions for a middle-income Ethiopia. World Bank Group, Washington, DC.
- Roessler, R, Mpouam, SE, Muchemwa, T & Schlecht, E, 2016. Emerging development pathways of urban livestock production in rapidly growing West Africa Cities. Sustainability 8, 1199–223. doi: 10.3390/su8111199
- Sarstedt, M & Mooi, E, 2014. Cluster analysis. In Sarstedt, M & Mooi, E (Eds.), A concise guide to market research. The process, data, and methods using IBM SPSS statistics. 2nd edn. Springer, Heidelberg.
- Shapiro, BI, Gebru, G, Desta, S, Negassa, A, Nigussie, K, Aboset, G & Mechale, H, 2015. Ethiopia livestock master plan. Roadmaps for growth and transformation. A contribution to the growth and transformation plan II (2015–2020). ILRI project report. International Livestock Research Institute, Nairobi.
- Shapiro, BI, Gebru, G, Desta, S, Negassa, A, Nigussie, K, Aboset, G & Mechale, H, 2017. Ethiopia livestock sector analysis. A 15 year livestock sector strategy. International Livestock Research Institute, Nairobi.
- Slater, RJ, 2001. Urban agriculture, gender and empowerment: An alternative view. Development Southern Africa 18(5), 635–50. doi: 10.1080/03768350120097478
- Suttle, NF, 2010. Sodium and chloride. In Suttle, NF (Ed.), Mineral nutrition of livestock. 4th edn. Centre for Agriculture and Bioscience International, Cambridge.
- Tesfay, Y, Gebrelibanos, A, Woldemariam, D & Tilahun, H, 2016. Feed resources availability, utilization and marketing in Central and Eastern Tigray, Northern Ethiopia. LIVES working paper 2. International Livestock Research Institute, Nairobi.
- Thornton, A, Nel, E & Hampwaye, G, 2010. Cultivating Kaunda’s plan for self-sufficiency: Is urban agriculture finally beginning to receive support in Zambia? Development Southern Africa 27(4), 613–25. doi: 10.1080/0376835X.2010.508604
- Tittonell, P, 2014. Livelihood strategies, resilience and transformability in African agroecosystems. Agricultural Systems 126, 3–14. doi: 10.1016/j.agsy.2013.10.010
- Toure, A, Moula, N, Kouriba, A, Traore, B, Tindano, K, Leroy, P & Antoine-Moussiaux, N, 2015. Dairy farms typology and management of animal genetic resources in the peri-urban zone of Bamako (Mali). Journal of Agriculture and Rural Development in the Tropics and Subtropics 116(1), 37–47.
- UN-HABITAT (United Nations Human Settlements Programme), 2014. State of African cities 2014. Re-imagining sustainable urban transitions. United Nations Human Settlements Programme, Nairobi.
- Wadhwa, M & Bakshi, MPS, 2013. Utilization of fruit and vegetable wastes as livestock feed and as substrates for generation of other value-added products. Regional Office for Asia and the Pacific publication 2013/04. Food and Agriculture Organization of the United Nations, Bangkok.
- Wouters, B & van der Lee, J, 2010. Inclusion of small-scale milk producers in modern dairy value chains. Market, chains and sustainable development strategy & policy paper No. 25. Wageningen University, Wageningen.
- Zijlstra, J, van der Lee, J, Berhanu, T, Vernooij, A & Boere, A, 2015. Investment opportunities in the Ethiopian dairy sector #2 in the series written for the Ethiopian Netherlands business event 5–6 November 2015. Embassady of the Kingdom of the Netherlands in Addis Ababa, Rijswijk.