
 ?Mathematical formulae have been encoded as MathML and are displayed in this HTML version using MathJax in order to improve their display. Uncheck the box to turn MathJax off. This feature requires Javascript. Click on a formula to zoom.
ABSTRACT
This paper measures the impact of South African minimum wages on small and large firm employment in a sector that is exposed to international competition (agriculture) and one that is not (retail). Small farm employment is most vulnerable to minimum wage legislation. In contrast, large farm employment was shielded from employment losses. While this shift represents a short-run response to minimum wages, it may intensify the long-run movement towards fewer, larger, and more capital-intensive farms. Retail employment experienced no changes in employment, regardless of firm size. These results are in line with the idea that firms exposed to international markets cannot easily increase prices when their employees’ wages increase while non-tradable sectors can more readily shift the burden of higher labour costs onto consumers by increasing prices. Implementation of a uniform national minimum wage ignores this type of heterogeneity, and could lead to intra-industry changes in concentration and inequality.
1. Introduction
In an attempt to reduce inequality and decrease the number of working poor, South Africa implemented a national minimum wage of R20 per hour (around US$1.44) in January 2019. Previously, minimum wages were implemented at a sectoral level. While raising wages of low-wage workers can improve their welfare, the threat of employment loss could enhance it. This paper focusses on employment changes, and is one of the first to consider the heterogeneous impacts of minimum wages within sectors in South Africa: in doing so, we provide evidence about workers and firms that are vulnerable to job loss.
Up until recently, minimum wages in South Africa were implemented selectively and with large differentiation, giving consideration to the specific circumstances of sectors, regions and firm sizes.Footnote1 While exemptions in some sectors and lower floors in others may have minimised employment losses, the many details of sector-specific legislation introduced administrative burdens on employers. Bhorat et al. (Citation2012) emphasise that low compliance in paying minimum wages may result from the complex wage determination structure that has operated in South Africa.Footnote2 A national minimum wage has the potential to partially remedy the problem of non-compliance. Developed countries, such as Germany, have also recently harmonised sector-specific minimum wages into one economy-wide wage-setting framework. This transition has reduced employment levels only marginally (Bossler & Gerner, Citation2016).
A national minimum wage could lead to wage increases, especially in sectors that have not been covered by wage floors previously, while large wage hikes are more likely to lead to employment losses. In this paper, we evaluate the sector-specific approach, and focus on the experience of small firms – especially when these small firms operate in a sector that is exposed to international trade. Firms which produce tradable goods do not enjoy the same control over price mark-ups on their products, and therefore do not have the same options to recover higher labour costs from consumers as firms in non-tradable sectors do.
This paper analyses the effect of minimum wages (as imposed by sectoral determinations) by firm size in the agricultural and retail sectors. The agricultural sector, a tradable sector, is exposed to international competition. By contrast, the local retail sector is closed to export markets. By comparing these two sectors, and considering heterogeneity by firm size, we assess whether the ability to absorb legislated wage increases is determined by economies of scale that are, in turn, associated with firm size; furthermore, we consider whether scale differences only matter when firms are exposed to international markets.
Our results show that most of the disemployment effects resulting from the introduction of minimum wages in the agricultural sector were concentrated on small farms. We show that minimum wages were more binding on small farms, since, on average, they are more labour intensive and hire less-skilled and lower-paid individuals as compared to their larger counterparts. In stark contrast, large farms were shielded from employment losses. Small farms could not absorb the higher wage costs effectively; large farms were less affected due to different production input possibilities and economies of scale. Placing this result into the broader literature on the agricultural sector in South Africa (Liebenberg & Pardey, Citation2012); it seems as if the introduction of minimum wages may have intensified the long-run trend of fewer, but larger farms in South Africa.
Coping with the simultaneous limitations of wage costs and selling produce in competitive international markets is therefore contingent on operating at scale. In contrast, the sensitivity of small firm employment is not apparent in the non-tradable retail sector that is relatively immune to international economic conditions. These results indicate that a more nuanced view is needed when evaluating the effects of minimum wages in South Africa. A national minimum wage could be beneficial to some workers, though could leave others more vulnerable.
Section two of this paper reviews international empirical evidence on the relationship between minimum wages and employment outcomes and discusses heterogeneous impacts of minimum wages on different sectors (tradable and non-tradable) and within sectors (between small and large firms). Section three introduces the dataset and key variables and discusses the estimation strategy and descriptive statistics. Thereafter, econometric results are presented. In the last section, we conclude and discuss policy implications.
2. Evidence of the impact of minimum wages
The impact of minimum wages on employment is perhaps one of the most studied and controversial topics in economics. Perfectly competitive models predict employment reductions in response to minimum wages, while monopsonistic models can incorporate increases. Vast empirical evidence highlights these potential differences.
Until the early 1990s, the consensus was that a robust negative relationship between minimum wages and employment existed. Brown et al. (Citation1982) reviewed the first wave of the minimum wage literature and found consistently negative effects. This position was challenged by the results of Card (Citation1992a, Citation1992b), Katz & Krueger (Citation1992), and Machin & Manning (Citation1994) (inter alia), signalling the emergence of the new minimum wage literature and required updated theoretical perspectives. Card & Krueger’s (Citation1994) seminal study found – contrary to expectations – a very large positive effect of minimum wage increases on employment levels. Results continue to be contested on the grounds of methodological variations and data quality (Card & Krueger, Citation2000; Neumark & Wascher, Citation2000; Neumark & Wascher, Citation2007; Dube et al., Citation2010; Allegretto et al., Citation2011; Neumark et al., Citation2014). Recently, research has turned to the long-run impacts of minimum wages, finding that employers can substitute away from labour towards capital, and leading to a reduction in the growth of job creation (Meer & West, Citation2015; Sorkin, Citation2015).
The minimum wage literature in developing countries is scarcer and more recent. However, in most instances, empirical results support the disemployment hypothesis (Bell, Citation1997; Fajnzylber, Citation2001; Maloney & Mendez, Citation2004; Gindling & Terrell, Citation2005, Citation2007; Arango & Pachon, Citation2007).
In South Africa, Hertz (Citation2005) estimated a decline in employment of South African domestic workers, while Dinkelman & Ranchod (Citation2012) did not. Bhorat et al. (Citation2013) analysed employment outcomes in the retail, taxi, forestry and private security sectors. While the authors found no significant impact of the laws at the extensive margin for any of the sectors, their results suggest that the retail, security and taxi sectors decreased working hours to afford the higher wage costs.
Now turning to studies which have focused on the agricultural sector: Conradie (Citation2005) found that employment decreased for workers on wine farms following the introduction of minimum wages in 2003. In contrast, a case study in the sugar industry by Murray & Van Walbeek (Citation2007) found no large reduction in employment. Bhorat et al. (Citation2014) studied the effect of the agricultural minimum wage on employment, wages and hours worked. Employment decreased, while wages and hours worked increased in response to the introduction of minimum wages. Results from Garbers et al. (Citation2015) and Van der Zee (Citation2017) also found negative employment effects. Furthermore, Garbers et al. (Citation2015) showed that farms have become more capital-intensive and have focused their hiring on better-skilled workers after the imposition of minimum wages. Unskilled jobs were most likely to be terminated following the introduction of minimum wages. Most recently, Ranchod & Bassier (Citation2017) analysed the effect of the 2013 large increase in legislated agricultural minimum wages and found negative effects for the period directly after the minimum wage hike.
Where minimum wages did have disemployment effects in South Africa, the elasticities were large compared to other developing countries. Yet, in many sectors the effects are zero. Minimum wages therefore have heterogeneous, sector-specific impacts. This paper is one of the first to understand the circumstances in which these differences arise.
2.1. Differences in the impact of minimum wages in tradable and non-tradable sectors
A potential reason for cross-sectoral heterogeneity in disemployment effects is that retail, private security and the taxi sectors are non-tradable and face no competition in export markets. On the contrary, agriculture and the clothing industry produce export goods and thus face international competition. Firms in non-tradable sectors can raise prices and shift the burden of higher labour costs onto consumers. Consequently, there is no need to shed employment. To the contrary, firms in tradable sectors face international competition, and can therefore not readily shift the burden of higher labour costs onto foreign consumers. Therefore, we hypothesise that when binding minimum wages are introduced in tradable sectors, firms are more likely to decrease employment if they cannot afford to pay the higher wage costs.
Findings by Fedderke et al. (Citation2006) support this reasoning. Import and, to a lesser extent, export penetration among South African manufacturers was negatively associated with price mark-ups. This emphasises that tradable sectors which face international competition cannot increase prices in response to higher wage costs. Moreover, research by Rankin (Citation2016) shows that small firms in the tradable manufacturing sector are especially vulnerable to institutional wage setting. He notes that when labour-intensive small firms, which employ more low-skilled workers, are confronted with wage pressures from collective bargaining, higher levels of import competition exacerbate employment loss; many small firms exit the market in response.
2.2. Differences in the impact of minimum wages on small and large firms
Another angle along which minimum wages can have heterogeneous impacts is firm size. Rama (Citation2001) argues that for large firms, the monopsonistic model of minimum wages is more accurate whereas the competitive model is more applicable to small and medium-sized firms. Research from Indonesia shows that employment effects differed by firm size (Rama, Citation2001; Del Carpio et al., Citation2012). Small firms experienced significant employment losses (as predicted by the competitive model), whereas large firms experienced an increase in employment (possible only with the monopsonistic model).
Parrot (Citation2004) concluded that small firm employment was not affected by minimum wages in the United States. Sabia (Citation2006), however, accounted for confounding factors, and found that employment declined in small firms, especially among the least skilled workers. No South African minimum wage studies factor firm size into their estimates. However, Magruder (Citation2012) analysed the impact of bargaining councils that extend their collective agreements to small firms, and therefore act in a similar fashion to a sectoral minimum wage. Bargaining councils reduced small-firm employment, while there was no effect on large firms.
Magruder’s (Citation2012) evidence points towards a feature of South African market structure: high levels of concentration exist, large firms dominate the product market and are more immune to policy changes than small firms. Kerr et al. (Citation2014) found that net job creation in South Africa occurred mainly within larger firms; small firms have limited capacity to grow employment. In addition, Matthee et al. (Citation2015) showed that South African exports are dominated by a group of larger ‘super-exporters’. Furthermore, Edwards et al. (Citation2017) show that only the most productive firms are able to export. The overlap between these three empirical observations suggest that large firms are able to use the most productive inputs (capital and better-skilled workers), contributing to their profitability and allowing them to remain competitive in international markets; as a result of their scale, they are able to create new (better skilled) jobs which small firms cannot. By inference, these firms should also be able to weather minimum wage shocks. Small, labour-intensive firms in tradable sectors, on the other hand, do not hire the most productive workers and are therefore less likely to profitably maintain their employment levels in the face of higher labour costs.
3. Data and estimation strategy
3.1. The data
We use the Post-Apartheid Labour Market Series (PALMS) which contains microdata from various household surveys conducted by Statistics South Africa (Kerr & Wittenberg, Citation2017). Our analysis, however, only uses 16 waves of the Labour Force Survey (LFS), from 2000 to 2007. The LFS is nationally representative and surveyed approximately 30 000 households in each instalment. Surveys were conducted in March and September of each year by Statistics South Africa. Waves were treated as repeated cross-sections. The sample was restricted to the working-age population, while self-employed individuals as well as union and government workers were excluded from the sample.Footnote3
Sectoral determinations were set by the Minister of Labour and are published in Government Gazettes.Footnote4 These sectoral determinations were set for specific groups of individuals and stipulate conditions of work, including minimum wages. The South African Standard Classification of Occupations (SASCO) and the International Standard Industrial Classification (ISIC) were reported in the LFS, and were used to identify minimum wage workers.
When the agricultural minimum wage was introduced in March 2003, it varied by geographical locations articulated as areas A and B. Area A represented more affluent local municipalities (and as a result had higher legislated minimum wages), while area B comprised of poorer and often more rural local municipalities (and thus had lower legislated minimum wages).
Complex minimum wage structures were introduced on 1 February 2003 in the retail sector, which varied by region, occupation and whether workers worked part- or full-time. In addition, firms with less than five employees were only required to pay a lower minimum wage than firms with five or more employees, acknowledging the difficulties that small firms face in complying with wage-setting legislation. This concession was, however, removed in 2006.
3.2. Sample selection and key variables
The construction of treatment and control groups was guided by the analysis of Bhorat et al. (Citation2013, Citation2014). The entire dataset was restricted to low-wage individuals in the working-age population, who had less than 12 years of education.Footnote5 Individuals who indicated that they worked more than 15 h a day were not included in the sample.
Unique control groups for both the agricultural and retail sectors were created based on having similar characteristics to the respective treatment groups. The control group used in the employment analysis for the agricultural sector consists of African and mixed-raceFootnote6 individuals who were employed in elementary occupations.Footnote7 The retail sector’s control group for the employment analysis, comprised of employed individuals.Footnote8
When restricting our analysis by firm size, both the treatment and control groups are restricted to the respective firm size category, as we would like the groups to be as similar as possible. This also substantiates why using only employed individuals in our control group is better-suited when conducting a firm size analysis.Footnote9
We distinguish workers based on self-reported firm sizes, following Magruder (Citation2012). While self-reports may be mis-measured for a variety of reasons (such as conflating plant size with firm size), this is less of a concern in the case of agriculture, where individual farmers hire workers.
3.3. Estimation strategy
The estimation strategy is based on Card & Krueger (Citation1995) and Lee (Citation1999). The difference-in-difference model tests whether employment, hours worked and wages changed more in areas where the treatment intensity (wage increases) would have to be higher to comply with minimum wage legislation.Footnote10
is the outcome of interest (employment, hours worked and wages) for individual i in sector k, district council j and period t. The Postt variable is a dummy indicating periods after the introduction of minimum wages. The Wage gapjk variable is measured across district councils.Footnote11 The variable distinguishes between regions where wages had to rise substantially to reach full compliance and those that only had to undergo small adjustments:
is the minimum wage in
and
is the median wageFootnote12 of the treated sector in
, in the year before minimum wages were implemented (2002).Footnote13 The wage gap variable is zero for district councils where the median wage was already higher than the minimum wage at the time of implementation.Footnote14
The coefficient on the interaction () measures the change in outcomes attributable to the minimum wage in the post-law period. The model is run with and without individual controls, dummies for seasonality and district councils.
3.4. Descriptive statistics
shows the average characteristics for the agricultural and retail sectors, as well as their unique control groups over the entire sample period. The top panel reveals that agricultural workers were more likely to be comprised of Africans, the middle-aged, males and workers with very low levels of education (roughly five years of schooling). Real hourly wages in the agricultural sector decreased slightly between 2000 and 2002, after which they increased continually until 2007. This indicates that minimum wages did indeed raise farmworker wages. The number of hours worked by farmworkers decreased from 2000 to 2007, with a substantial decrease from 2002 to 2003, when the minimum wage was introduced. This suggests that employers may have adjusted on the intensive margin to be able to afford the higher labour costs.
Table 1. Average characteristics of the agricultural and retail sectors and their control groups.
On average, workers in the retail sector had around 10 years of schooling, and were also more likely to be middle-aged African individuals.Footnote15 Real wages in the retail sector increased from 2002 to 2007, implying partial compliance with minimum wage legislation in the retail sector. Similarly to the agricultural sector, it seems that employers reduced the number of hours worked somewhat.
Although the chosen dataset is best suited to analyse our research questions, a limiting factor is the amount of observations we have for each district council. We only included district councils in our analysis for which we have at least 30 observations in the pre- and post-period separately. provides the statistics of the number of observations across district councils for the agricultural and retail sector, by firm size and for the pre- and post-period. Our results are only representative of those district councils which have been included in the sample. While the number of observations are reasonable for the agricultural sector as a whole and the smaller farms, the number of observations drop significantly for the largest firm size category. The same holds for the retail sector, however, even the size category of 20 or more workers has too few observations to reliably estimate effects. We, therefore, exclude these from our analysis.
Table 2. The number of observations across district councils for the agricultural and retail sectors, by firm size and time period.
shows the average wage gap for the agricultural and retail sectors across different firm sizes. The higher the wage gap, the more wages had to increase to comply with the minimum wage legislation. The average wage gap in the agricultural sector was 0.57. In other words, minimum wages were set at a level that was roughly 50% higher than the pre-policy median agricultural wage in each district. Notably, wage gaps are only noticeably smaller for farms that employ 50 workers and more; large farms already had the greatest capacity to pay minimum wages before they were imposed. Turning to the retail sector, the wage gap of 0.23 is substantially lower than in the agricultural sector, indicating that the minimum wage was more binding in the agricultural sector than in the retail sector.
Table 3. Average wage gaps for the agricultural and retail sectors.
4. Econometric results and discussion
4.1. Results for the agricultural sector
We now turn to the difference-in-difference results, starting with the agricultural sector. Analysis for the agricultural sector was split into four sub-samples: farms with (i) less than 20 employees, (ii) less than 50 employees (iii) 20 or more employees and (iv) 50 or more employees.
shows the results from the impact of the introduction of minimum wages on employment in agriculture. Two sets of results are shown per table. The first set of results (in the top panel) does not include controls, whereas the second set (in the bottom panel) controls for race, education, gender, age, year fixed effects, district council dummies and agricultural real GDP.Footnote16 Each set of results comprises of five regressions of which the first regression has no farm size restriction, followed by regressions in successive columns that restrict the sample to smaller and larger farms respectively. The dependent variable in is a binary variable and indicates if the individual is employed as a farmworker or falls within the control group as defined earlier. In the regressions restricted by firm size, both the treatment and control groups are restricted to the respective firm size category.
Table 4. Probability of employment in the agricultural sector.
A full specification (in column VI) indicates reductions of about 6.2% in response to minimum wages for the sector as a whole. These results are similar to those found by Bhorat et al. (Citation2014). Similar results apply to workers on farms with less than 20 and less than 50 employees. The difference-in-difference coefficients are larger in columns VII and VIII than for the unrestricted sample, indicating that most of job losses were concentrated on smaller farms. In particular, the results indicate that in response to a one percent change in the initial wage gap, the probability of being a farmworker on a small farm decreased between 6.6% and 7.2% in the post-law period compared to the period before minimum wages were implemented. In contrast, the probability of employment on larger farms – those that employ more than 20 workers – seem to have been shielded from employment losses.Footnote17
Overall then, most of the disemployment effects caused by the introduction of minimum wages in the agricultural sector, occurred on small farms and provide a nuanced view of the mechanisms by which minimum wages operate in agriculture.
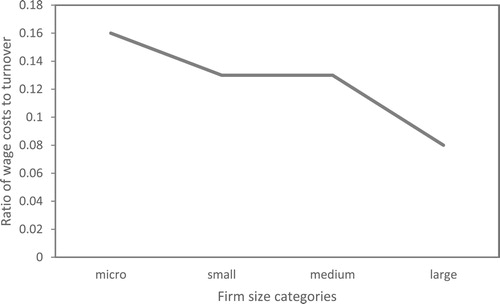
A number of potential explanations exist why small and large farms responded differently to the introduction of minimum wages. Firstly, larger farms, overall, pay higher wages than small firms as was shown in : larger farms had a smaller gap to reach minimum wage levels compared to smaller farms. Larger farms also hire more skilled workers than their smaller counterparts, as proxied by the level of education of farm workers by firm size.Footnote18 Furthermore, large firms have more capital than their smaller counterparts, as evident in . Mechanisation is a viable production choice mainly for larger farms who can exploit economies of scale. Moreover, below shows the proportion of wages paid relative to firms’ turnover by firm size in the agricultural sector: the proportion decreases with firm size. These two figures indicate that larger farms have a more capital intensive production process than smaller farms and this implies that costs in larger farms rose by a smaller proportion than in smaller farms when minimum wages were introduced. Taken together, these factors indicate that minimum wages could place a larger burden on small farms compared to bigger farms. Our results cannot distinguish whether the decrease in small farm employment is due to these farms simply decreasing employment or whether some small farms had to shut down. Future research using firm-level panel data will need to investigate this further.
Figure 1. Median amount of capital in the agricultural sector by firm size. Source: Authors’ calculations using the SARS-NT panel for the 2011 tax year.
Notes: The SARS-NT panel only starts from the 2008 tax year, but figures are only reliable a few years into the dataset and thus, figures for the 2011 tax year are shown here. Amounts are shown in South African Rands.
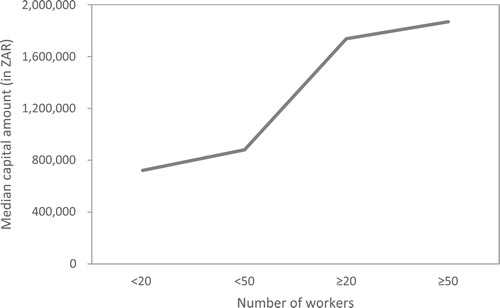
Figure 2. Median ratio of wage costs relative to turnover for the agricultural sector by firm size. Source: Authors’ calculations using the SARS-NT panel for the 2011 tax year.
Notes: Firm size categories are based on turnover measures comparable to those used in the Agricultural Survey in 2016.
This may lead to an increase in the concentration in the agricultural sector which could raise intra-sectoral inequality of production and may intensify an existing problem. Structural change in the agricultural sector has led to major job destruction over the long-run. In the last three decades alone, agricultural employment has decreased by roughly one million (Liebenberg & Kirsten, Citation2013). Moreover, the number of farms decreased, while farm sizes and the number of employees per farm increased. In particular, between 2008 and 2011, the number of farmers in South Africa decreased from 50 332 to 34 905 (Liebenberg & Pardey, Citation2012; Liebenberg & Kirsten, Citation2013). Remaining farm sizes increase as a result of some farmers exiting agriculture combined with relatively few new entrants (Simbi & Aliber, Citation2000).
Results for the hours worked and wage analysis, along with a discussion of these results, are contained in the appendix. Although all of the difference-in-difference coefficients are negative, these coefficients are not statistically significant, meaning that we cannot say with certainty that employers adjusted working hours in order to cope with the legislation. Wage results indicate that minimum wage legislation resulted in higher farmworker pay.
In the following sub-section, results for the retail sector are presented. We consider whether small firms in a sector not exposed to international competition also experienced disemployment effects as a result of the introduction of minimum wages.
4.2. Results for the retail sector
shows the impact of the introduction of minimum wages on the probability of employment in the retail sector.Footnote19
Table 5. Probability of employment in the retail sector.
Regardless of the specification or firm size restriction, minimum wages have no robust impact on employment in the retail sector. This stands in stark contrast to the agricultural sector, where the sector as a whole shed employment, concentrated on small farms. We posit that even small retail firms are able to pass on higher wage costs to local consumers, as they do not have to take prices set in export markets.
Hours worked and wage results are presented and discussed in the appendix. In brief, wages in the sector increased while employers seem to have adjusted hours worked in response to the minimum wage legislation. In contrast to agriculture, wage increases proceeded without any adjustments in employment.
5. Conclusion
There is limited consensus among economists on the nature of the disemployment effect of minimum wages. Empirical results yield heterogeneous effects. While the South African literature analyses many different sectors, it had not looked at mechanisms underlying the effects measured. Previous results show that, overall, non-tradable sectors experienced no disemployment effects; however agriculture, a tradable export sector, experienced large disemployment effects. This paper showed that most of the disemployment effects were concentrated on small farms. Large farms, in contrast, were shielded from employment losses. Our results show the debilitating effect of minimum wages for small farmers who are less adept at competing in international markets than large farmers.
By contrast, these distinctions are not apparent in the retail sector. What sets this sector apart from agriculture is that retail sales are not sensitive to external pressures, enabling retail firms to increase prices and thereby shifting the burden of increasing labour costs onto consumers.
Our results therefore show that the imposition of a national minimum wage will likely have heterogeneous effects. While it is possible that overall the impact could be negligible, this finding ignores the role it could have in reducing small-firm employment, especially in tradable sectors. While the National Development Plan targets small firms for job growth (Republic of South Africa, Citation2013), the national minimum wage makes limited provision for their vulnerability in specific sectors. A uniform approach to minimum wage design could therefore raise intra-industry inequality in tradable sectors.
Disclosure statement
No potential conflict of interest was reported by the authors.
ORCID
Marlies Piek http://orcid.org/0000-0002-0276-1749
Dieter von Fintel http://orcid.org/0000-0001-6771-1315
Notes
1 Prior to the national minimum wage, two independent mechanisms determined minimum wages. Sectoral determinations are legislated directly by central government, but only in selected sectors that employ the poorest workers in the labour market (such as agricultural, retail and domestic employees). Collective agreements, on the other hand, are agreed upon by industry bargaining councils – a collective of union representatives and firms who negotiate wages of better-paid workers (such as metal and clothing workers). These agreements can be extended to uncovered firms within the same sector and jurisdiction at the discretion of the Minister of Labour, regardless of whether employers and employees in these firms were party to the original agreement. These industry agreements, therefore, function in the same way as a conventional minimum wage.
2 Until recently, South Africa had 124 different minimum wage structures (Cassim, Jourdan & Pillay, Citation2015).
3 Union and government workers were excluded from the sample since their wages are often subject to collective bargaining agreements and including them would have confounded the two types of wage legislation.
4 These are available on the Department of Labour’s website, www.labour.gov.za.
5 Defined as earning below R10 000 per month in 2000 Rands.
6 Since the majority of farmworkers are African and of mixed race, the control group was restricted to these race groups. It is furthermore known that different wage-determination processes operate for various race groups (Burger et al., Citation2016).
7 We conducted a sensitivity analysis by defining the control groups for both sectors in various ways (by including and excluding the narrowly unemployed). The signs were the same for either definition, although with varying levels of significance.
8 The employed people in this control group were not restricted by specific skill-levels, since the retail treatment group also included occupations over a range of different occupations and skill-levels.
9 Opting to use only employed individuals in our control groups was based on wanting the treatment and control groups to be as similar as possible, since employed and unemployed individuals often have different characteristics.
10 This estimation strategy essentially measures the intention to treat effect. As we show in the appendix, wages did increase as a result of the minimum wage legislation and thus gives traction to our estimation strategy. Future research could use actual treatment instead, as recent research by Bhorat et al. (Citation2019) suggests.
11 South Africa is divided into 53 district councils. Minimum wages do not vary greatly by geography, except where these districts contain greater numbers of workers in either area A or B municipalities (which are smaller geographic units than district councils).
12 We use the earnings variable which is a consistent income variable across waves and the recommended variable to analyse labour incomes in the PALMS dataset (Kerr & Wittenberg, Citation2017). This variable, however, does not adjust for bracket responses, we therefore, weight the earnings variable by the bracket weight when creating median wages.
13 Both the median and minimum wages are real hourly wages in 2000 Rands.
14 To construct the wage gap variable, each individual in the dataset had to be assigned the hourly real minimum wage for the district council they reside in. However, minimum wage regions (areas A and B) are defined by smaller municipal demarcations which cannot be identified in the data. District councils are the smallest demarcation that can be consistently identified throughout the period of analysis. A district council could therefore comprised of only area A municipalities, only area B municipalities or a mixture of area A and area B municipalities. Population estimates from the 2007 Community Survey were used to calculate the percentage of the district councils’ populations that lived in local municipalities classified as A or B. Minimum wages for mixed district councils were then calculated as follows: E(Minimum wage)j = % of people living in area A * area A minimum wage + % of people living in area B * area B minimum wage. Each individual is assigned this weighted minimum wage according to their district of residence. This was then used to construct the wage gap variable. A similar method was followed for the retail sector, the main difference being that the retail minimum wage varied across three areas instead of two.
15 As mentioned previously, the retail minimum wage ranges across certain occupations, one of which include managers. Since managers are often relatively more educated and remunerated, another treatment group was created to see whether mean characteristics of the treatment group changed. Regressions with this treatment group were also run, but as with the mean characteristics, there were no substantial differences. For future research, one could perhaps split the retail minimum wage into a relatively more skilled and relatively less skilled groups, to get better control groups.
16 A linear probability model was used for the employment regressions for both sectors.
17 This is in line with the descriptive figures from , where large farm employment does not seem to have been negatively affected by the introduction of minimum wages.
18 This is apparent when analysing the number of years of education of farm workers and their wages by firm size; the average (and median) number of years education and wages is significantly higher in larger farms compared to smaller farms. Please see for more details.
19 Since the sample sizes for the largest two firm sizes were too small (as depicted in ), the retail sector analysis was not split by these two firm size categories.
References
- Allegretto, SA, Dube, A & Reich, M, 2011. Do minimum wages really reduce teen employment? Accounting for heterogeneity and selectivity in state panel data. Industrial Relations 50(2), 205–240.
- Arango, CA & Pachon, A, 2007. The minimum wage in Columbia 1984–2001: Favoring the middle class with a bite on the poor. Ensayos Sobre Politica Economica 25(55), 149–193.
- Bell, BD, 1997. The performance of immigrants in the United Kingdom: Evidence from the GHS. The Economic Journal 107(441), 333–344.
- Bhorat, H, Kanbur, R & Mayet, N, 2012. Minimum wage violation in South Africa. International Labor Review 151(3), 277–287.
- Bhorat, H, Kanbur, R & Mayet, N, 2013. The impact of sectoral minimum wage laws on employment, wages, and hours of work in South Africa. IZA Journal of Labor & Development 2(1), 1–27.
- Bhorat, H, Kanbur, R & Stanwix, B, 2014. Estimating the impact of minimum wages on employment, wages and non-wage benefits: The case of agriculture in South Africa. American Journal of Agricultural Economics 96(5), 1402–1419.
- Bhorat, H, Kanbur, R & Stanwix, B, 2019. Compliance with labor laws in developing countries. IZA World of Labor. 80v2.
- Burger, RP, Jafta, RCC & von Fintel, DP, 2016. Affirmative action policies and the evolution of post-apartheid South Africa's racial wage gap, WIDER Working Paper Series 2016/66, World Institute for Development Economic Research.
- Bossler, M & Gerner, H-D, 2016. Employment effects of the new German minimum wage: Evidence from establishment-level micro data. IAB Discussion Paper 10/2016, Institute for Employment Research, Nuremberg.
- Brown, C, Kilroy, C & Kohen, A, 1982. The effect of the minimum wage on employment and unemployment. Journal of Economic Literature 20(2), 487–528.
- Card, D, 1992a. Do minimum wages reduce employment? A case study of California, 1987–89. Industrial and Labor Relations Review 46(1), 38–54.
- Card, D, 1992b. Using regional variation in wages to measure the effects of the federal minimum wage. Industrial and Labor Relations Review 46(1), 22–37.
- Card, C & Krueger, AB, 1994. Minimum wages and employment: A case study of the fast-food industry in New Jersey and Pennsylvania. American Economic Review 84(4), 772–793.
- Card, D & Krueger, AB, 1995. Myth and measurement: The new economics of the minimum wage. Princeton University Press, Princeton, NJ.
- Card, D & Krueger, AB, 2000. Minimum wages and employment: A case study of the fast-food industry in New Jersey and Pennsylvania: Reply. The American Economic Review 90(5), 1397–1420.
- Cassim, A, Jourdan, B & Pillay, K, 2015. The misunderstood minimum wage: A case study of South Africa. Chapter in Global Wage Debates: Politics or Economics? [Online]. https://justjobsnetwork.org/wp-content/pubs/reports/Joint%20Report%202015.pdf. Accessed 20 December 2015.
- Conradie, B, 2005. Wages and wage elasticities for wine and table grapes in South Africa. Agrekon 44(1), 138–156.
- Del Carpio, X, Nguyen, H & Choon Wang, L, 2012. Does the minimum wage affect employment? Evidence from the manufacturing sector in Indonesia. Policy Research working paper No. 6147. World Bank, Washington, DC.
- Dinkelman, T & Ranchod, V, 2012. Evidence on the impact of minimum wage laws in an informal sector: Domestic workers in South Africa. Journal of Development Economics 99(1), 27–45.
- Dube, A, Lester, TW & Reich, M, 2010. Minimum wage effects across state borders: Estimates using contiguous counties. Review of Economics and Statistics 92(4), 945–964.
- Edwards, L, Sanfilippo, M & Sundaram, A, 2017. Importing and firm export performance: New evidence from South Africa. South African Journal of Economics 86(S1), 79–95.
- Fajnzylber, P, 2001. Minimum wage effects throughout the wage distribution: Evidence from Brazil’s formal and informal sectors. Proceedings of the 29th Brazilian Economics Meeting 098, Brazilian Association of Graduate Programs in Economics.
- Fedderke, J, Kularatne, C & Mariotti, M, 2006. Mark-up pricing in South African industry. Journal of African Economies 16(1), 28–69.
- Garbers, C, Burger, R & Rankin, N, 2015. The impact of the agricultural minimum wage on farmworker employment in South Africa: A fixed effects approach. Biennial Conference of the Economic Society of South Africa.
- Gindling, TH & Terrell, K, 2005. The effect of minimum wages on actual wages in formal and informal sectors in Costa Rica. World Development 33(11), 1905–1921.
- Gindling, TH & Terrell, K, 2007. The effects of multiple minimum wages throughout the labour market: The case of Costa Rica. Labour Economics 14(3), 485–511.
- Hertz, T, 2005. The effect of minimum wages on the employment and earnings of South Africa’s domestic service workers. Upjohn Institute Working Paper No. 05-120.
- Katz, LF & Krueger, AB, 1992. The effect of the minimum wage on the fast food industry. Industrial and Labor Relations Review 46(1), 6–21.
- Kerr, A & Wittenberg, M, 2017. A Guide to version 3.2 of the Post-Apartheid Labour Market Series (PALMS).
- Kerr, A, Wittenberg, M & Arrow, J, 2014. Job creation and destruction in South Africa. South African Journal of Economics 82(1), 1–18.
- Kerr, A, Lam, D & Wittenberg, M, 2017. Post-apartheid labour market series [dataset]. Version 3.2. DataFirst [producer and distributor], Cape Town.
- Lee, D, 1999. Wage inequality in the United States during the 1980s: Rising dispersion or falling minimum wage? Quarterly Journal of Economics 114, 977–1023.
- Liebenberg, F & Kirsten, J, 2013. Statistics on farm labour in South Africa. [Online]. https://www.up.ac.za/media/shared/Legacy/sitefiles/file/48/2052/2013workingpaperseries/statisticsonfarmlabourup17okt228nov13.pdf Accessed 13 January 2016.
- Liebenberg, F & Pardey, P, 2012. A long-run view of South African agricultural production and productivity. African Journal of Agricultural and Resource Economics 7(1), 14–38.
- Machin, S & Manning, A, 1994. Minimum wages, wage dispersion and employment: Evidence from the UK wages councils. Industrial and Labor Relations Review 47(2), 319–329.
- Magruder, JR, 2012. High unemployment yet few small firms: The role of centralized bargaining in South Africa. American Economic Journal: Applied Economics 4(3), 138–166.
- Maloney, W & Mendez, J, 2004. Measuring the impact of minimum wages: Evidence from Latin America. In Law and Employment: Lessons from Latin America and the Caribbean, NBER Chapters: 109–130. National Bureau of Economic Research Inc.
- Matthee, M, Farole, T, Naughtin, T & Rankin, N, 2015. South African exporters and the global crisis: Intensive margin shock, extensive margin hangover. South African Journal of Economics 84(20), 183–198.
- Meer, J & West, J, 2015. Effects of the minimum wage on employment dynamics. Journal of Human Resources 39(2), 425–450.
- Murray, J & Van Walbeek, C, 2007. Impact of the sectoral determination for farmworkers in the South African sugar industry: Case study of the Kwazulu-Natal north and south coasts. CSSR Working Paper No. 181, Centre for Social Science Research, South Africa.
- Neumark, D & Wascher, WL, 2000. The effect of New Jersey’s minimum wage increase on fast-food employment: A revision using payroll records. American Economic Review 90(5), 1362–1396.
- Neumark, D, Salas, JMI & Wascher, W, 2014. Revisiting the minimum wage–employment debate: Throwing out the baby with the bathwater? Industrial and Labor Relations Review 67(3), 608–648.
- Parrot, J, 2004. State minimum wages and employment in small businesses. [Online]. https://www.fiscalpolicy.org/minimumwageandsmallbusiness.pdf. Accessed 21 December 2015.
- Posel, D & Casale, D, 2006. Who replies in brackets and what are the implications for earnings estimates? An analysis of earnings data from South Africa. Economic Research Southern Africa Working paper No. 007.
- Rama, M, 2001. The consequences of doubling the minimum wage: The case of Indonesia. Industrial and Labor Relations Review 54(4), 864–881.
- Ranchod, V & Bassier, I, 2017. Estimating the wage and employment effects of a large increase in South Africa’s agricultural minimum wage. REDI3x3 Working paper No. 38.
- Rankin, N, 2016. Labour productivity, factor intensity and labour costs in South African manufacturing. REDI3x3 Working Paper, Cape Town, Research Project on Employment, Income Distribution and Inclusive Growth.
- Republic of South Africa, 2013. National Development Plan 2030. [Online]. https://www.gov.za/sites/www.gov.za/files/Executive%20Summary-NDP%202030%20-%20Our%20future%20-%20make%20it%20work.pdf. Accessed 19 April 2017.
- Sabia, J, 2006. The effect of minimum wage increases on retail and small business employment [Online]. https://www.epionline.org/wp-content/studies/sabia_05-2006.pdf. Accessed 21 December 2015.
- Simbi, T & Aliber, M, 2000. Agricultural employment crisis in South Africa. [Online]. https://www.tips.org.za/files/415.pdf. Accessed 13 January 2016.
- Sorkin, I, 2015. Are there long-run effects of the minimum wage? Review of Economic Dynamics 18, 306–333.
- Van der Zee, K, 2017. Assessing the effects of two agricultural minimum wage shocks in South Africa. Unpublished master’s dissertation. University of Cape Town, Cape Town.
- Von Fintel, D, 2007. Dealing with earnings bracket responses in household surveys – how sharp are midpoint imputations? South African Journal of Economics 75(2), 293–312.
Appendix: Hours worked and wage results for the agricultural and retail sectors
shows whether employers in agriculture responded to the legislation by reducing the number of hours worked. Since our difference-in-difference coefficients are not statistically significant, we cannot say with certainty that employers adjusted hours worked in response to the introduction of minimum wages.
presents the wage results for the agricultural sector. The positive and statistically significant coefficient on the interaction term suggests that farmworker wages increased significantly as a result of the introduction of minimum wages.
shows the results for the number of hours worked in the retail sector. The full specification in column VI suggests that employers decreased hours worked.
Lastly, shows the impact of the introduction of minimum wages on log real wages in the retail sector. Wages in the retail sector as a whole increased as a result of minimum wages.