
ABSTRACT
Waste picking provides between 60 000 and 90 000 informal self-employment opportunities in South Africa. This study investigates the labour market of waste pickers in the Bellville CBD, highlighting their socio-economic vulnerability. Two-thirds had a previous formal sector job for an average three years. Forty per cent of these lost this job due to business layoffs. They earn on average approximately R2 900 per month, with 70% of them earning below the average. This is lower than the average income of R3 645 of the elementary occupation workers in the QLFS 2017 data. For the waste pickers, under-employment likelihood is the highest in the low-income method (26%), followed by the time-based method (24%), and over-qualification method (16%). Waste pickers provide an invaluable service to local authorities. Practitioners and policymakers need to urgently engage in facilitative processes to dignify their working conditions and value the work that they are doing.
JEL CODE:
1. Introduction
More than 2.5 million people are working in South Africa’s informal sector (Rogan & Skinner, Citation2018:77). The contribution of the informal sector to the country’s total employment (accounting for 20% of total non-agricultural employment, as found by Essop & Yu (Citation2008)) cannot be overlooked, especially its role to promote entrepreneurship and self-employment in the face of South Africa’s persistently high unemployment levels.
The informal sector is, however, not the silver bullet, as it is often associated with poor working conditions and low remuneration. Our study focuses attention on the 60 000 to 90 000 (Godfrey et al., Citation2016) informally self-employed waste pickers in South Africa. Waste picking is a primary example of the type of subsistence informal employment activity in the local labour market. The contribution of this study to existing research is firstly the unique primary data collected from waste pickers in Bellville, South Africa. We go further than preceding studies by examining issues such as underemployment, the role of life satisfaction, and the use of trolleys in the lives and livelihoods of these workers.
The motivation for including the realm of under-employment as part of our study is that some workers may not have their potential labour resources fully utilised. This is an important issue when analysing labour markets, as under-utilised labour is not recoverable and high under-employment rate is associated with low income, high rates of welfare dependence and receipts (Wilkins & Wooden, Citation2011). Under-employment also leads to further consequences related to the workers’ general well-being and self-worth in the constructs of life satisfaction and job satisfaction (Wilkins & Wooden, Citation2011; Beukes et al., Citation2017).
Under-employment in South Africa is furthermore under-researched and even more so pertaining to informal employment. This is somewhat surprising given the fact that the under-employment likelihood may be much higher in the informal sector. Consequently, the research strategy and empirical analysis go further than existing studies on informal self-employment. This is the first study that integrates issues of under-employment within the interconnectednessFootnote1 within South African informal employment, using street waste pickers as a case study. In doing so, the vulnerability of informal workers is brought into the domain of policy considerations and new avenues for further research suggested.
2. Literature review
2.1. Decent work and working conditions
The ILO (Citation2019a) views decent work as the culmination of the aspirations of people in their working lives. It encompasses prospects for work that is:
… productive, delivers a fair income, security in the workplace and social protection for families, better prospects for personal development and social integration, freedom for people to express their concerns, organize and participate in the decisions that affect their lives and equality of opportunity and treatment for all women and men. (ILO, Citation2019a:1)
The concept of decent work is intrinsically linked to that of the prevailing working conditions in both formal and informal sectors, by including a far-reaching range of topics and issues such as: ‘ … working time (hours of work, rest periods, and work schedules) to remuneration, as well as the physical conditions and mental demands that exist in the workplace’ (ILO, Citation2019b:1).
The most recent comprehensive overview of South Africa's informal sector (Fourie, Citation2018) provides the conceptual position of waste pickers within the informal sector. Waste pickers can typically be classified within the survivalist tier of the broader informal sector (Makaluza & Burger, Citation2018:179). Most of South Africa’s informal sector consists of survivalist enterprise workers, who entered the sector as a last resort to generate income. They work under harsh conditions, with low incomes and little prospect of upward mobility within the informal sector and/or to the formal sector (Makaluza & Burger, Citation2018:179).
Often conditions in the survivalist tier of informal sector are nowhere close to ‘decent work’ (lack of job security, no pension fund contributions by employers, etc.), so these informal workers who failed to find job in the formal economy engage in low-earning, informal entrepreneurial activities for basic survival. Waste pickers fall in this category as they are self-employed survivalist entrepreneurs. Given the challenge of unemployment and poverty one cannot underestimate the value of survivalist activities in the informal sector to alleviate the immediate material needs of households (Lloyd & Leibbrandt, Citation2018:172).
2.2. Conceptual framework
Feldman (Citation1996) conceptualises under-employment as consisting of five dimensions. briefly explains each dimension, which relates to one of three broad approaches in the literature, i.e. time-based, over-education/skills-based and low-income approaches.
Table 1. Dimensions of underemployment.
In the time-based approach, under-employment represents those who involuntarily work fewer hours than they wished to do or want a full-time position (Beukes et al., Citation2017). In contrast, skills-related under-employed represent persons who had a desire, and were available, to change their current employment to better utilise their skills (Greenwood, Citation1999). Over-education may be of specific relevance to informal self-employment such as waste pickers. Sentime (Citation2011) found that, in Braamfontein, among the ones who did have measureable levels of education, a quarter had matric and approximately a third had post-matric qualifications.
Income-related under-employment is more difficult to accurately measure. One way to deal with this difficulty is to reconceptualise and broaden the definition of under-employment. This is essentially a ‘living wage’ approach that states that if any person earns less than some definition of a living wage, then they are classified as under-employed.Footnote2 This approach is suitable for cross-sectional data. An individual whose labour income is less than 125% of the poverty threshold is considered to be income-related under-employed.
2.3. Review of past South African studies on the informal sector, informal employment and related under-employment
Local empirical studies on the informal sector and informal employment activities are concentrated on three areas. One strand of literature focuses on using methods, other than the StatsSA approach, to redefine and re-estimate the number and profile of informal sector workers. Examples include Essop & Yu (Citation2008), Devey et al. (Citation2005, Citation2006), Heintz & Posel (Citation2008). The second group of studies examines formal/informal sector labour market interdependency and linkages (Budlender et al., Citation2001; Naidoo et al., Citation2004; Valodia & Devey, Citation2011; Essers, Citation2014).
The third group of studies investigated the working conditions and livelihoods of informally employed workers. These include older and recent studies on day labourers (Blaauw et al., Citation2006; Theodore et al., Citation2018). The self-employed section of the informal sector received attention from Schenck & Blaauw (Citation2011a, Citation2011b), Viljoen et al. (Citation2012), Samson (Citation2012, Citation2015) and Schenck et al. (Citation2019). These studies focused on street and landfill waste pickers, with differences in scope, aim and sample size.
Schenck & Blaauw (Citation2011a) examined the demographic characteristics, education, items collected and sold, earnings, and vulnerability of a small sample of waste pickers in different regions in South Africa. Schenck & Blaauw (Citation2011b) was the first attempt to utilise a representative sample (n = 142) of street waste pickers (Pretoria in this case). These studies were purely descriptive in nature and did not address specific issues pertaining to the functioning of this labour market.
Viljoen et al. (Citation2012) investigated another section of the waste value chain by looking at the role and linkages of 17 buy-back centres (BBCs) in Pretoria and Bloemfontein with the activities of waste pickers in the two cities. The findings point towards the symbiotic relationship that exists between the informal collectors of recyclables and the BBCs that offer a market for these products.
Schenck et al. (Citation2016) analysed the socio-economic differences between landfill (n = 363) and street (n = 43) waste pickers in the Free State. The comparison showed that income levels of landfill waste pickers were higher than those of street waste pickers in the same areas as a result of easier access to the recyclables on landfills.
Viljoen et al. (Citation2016) examined the potential institutional and human capital barriers faced by waste pickers across all provinces (n = 914), forcing them to stay in informal self-employment. Schenck et al. (Citation2019) examined the ramifications and unintended consequences that management decisions on South Africa’s landfills can have on the lives and livelihoods of landfill waste pickers. Sekhwela & Samson (Citation2019) analysed a pilot project conducted by the City of Johannesburg and its Pikitup waste management utility at the Robinson Deep landfill. They found that the different perception of integration held by the reclaimers and waste pickers ultimately played a role in the failure of the project.
These three strands in the literature, however, do not include studies on labour market aspects such as under-employment in the informal sector. In fact, there is a lack of studies on under-employment in this sector. The studies found in this field are briefly mentioned below.
Beukes et al. (Citation2017), despite being the most comprehensive local study, only examined under-employment by formal/informal sector briefly. They found that 30% of the time-based under-employed worked in the informal sector; for the over-qualified, skills-based under-employed, only 10% were informal sector workers. The earlier studies by Altman (Citation2009) and Yu (Citation2009) briefly examined the demographic characteristics of time-based under-employed in 2008, without any pertinent analysis done on under-employment by formal/informal sector. Mathebula (Citation2013) examined time-based under-employment in slightly greater detail, using the Quarterly Labour Force (QLFS) 2012 data. Again, no analysis was attempted on under-employment by sector. The same applies to the time-series study by Schoeman et al. (Citation2010).
There is therefore a clear research gap in this literature. None of these local studies examined under-employment in a particular occupation or industry in either the formal or informal sector in great detail.
Our study differs from the above literature on waste pickers in South Africa in several important aspects. Although we also investigate the demographic profile and general working conditions of street waste pickers, we go further by investigating additional elements and working conditions within this labour market, such as possible underemployment, and the impact of use of trolleys or other transport equipment on their productivity. This more in-depth analysis assists in a better understanding of the lives these workers lead. Appropriate policy responses to the permanent nature of this activity can only be formulated if a deeper and nuanced understanding of the activities of waste pickers is obtained.
3. Choice of research area and methodology
The research area for this study is the suburb of Bellville, located within the Cape Town metropolitan municipality. Bellville is a high-density business and residential area with a population of 112 507 people according to the 2011 Census data (Frith, Citation2019). Waste pickers in the central business district (CBD) were chosen as the research population for the data collection because the area has a high intensity of waste pickers roaming the streets. This CBD has a mixture of shops and informal retail spaces (especially alongside the station and taxi rank), which contribute to bigger volumes of waste being created. The city acknowledged the externalities created by their presence and integration of informal waste pickers are important issues for practitioners and policymakers. The BellvilleFootnote3 CBD was chosen through a combination of purposeful sampling and being conveniently situated for the research team to manage the study.
A mixed-method research strategy was chosen (Creswell & Plano Clark, Citation2011). The themes and patterns emerging from the results of several earlier studies on waste pickers informed the decision to include qualitative questions to probe the daily challenges and experiences of the pickers (Schenck & Blaauw, Citation2011a, Citation2011b; Schenck et al., Citation2016). The objective of this article required focus on the quantitative aspects of the research strategy and the results are primarily quantitative in nature therefore.
The questionnaire underwent a pre-test and was re-evaluated and revised. The survey strategy was to conduct individual interviews administered by fieldworkers. An important benefit of this approach was that fieldworkers were able to explain the questions to improve respondents’ understanding of the questions. Five experienced fieldworkers were recruited and trained to complete the questionnaire. Those who could speak isiXhosa, English and Afrikaans were selected to cater for the mother-tongue languages spoken by waste pickers.
Schenck & Blaauw (Citation2011b) reported it is possible to encounter the same waste pickers at different BBCs in the same area. The cross-sectional study was thus completed in one day to ensure the same person was not interviewed twice. The fieldwork was conducted on a Friday in JulyFootnote4 2017. Friday was chosen specifically as this was the day the garbage bins were put out for collection in the Bellville CBD. The aim was to reach as many of the research population as possible. The waste pickers themselves suggested the fieldworkers go to the two BBCs in the vicinity where most of the collectors sell their waste.
The fieldworkers proceeded to the first BBC in Bellville (BBC1).Footnote5 Most waste pickers approached agreed to be interviewed. Some were in a hurry to leave to start collecting again. Two others admitted to having been in jail and wanted to ‘move under the radar’ and declined to participate. However, the authors are satisfied that the research population was covered as comprehensively as possible.
The fieldworkers then moved towards the BBC in Parow (BBC2). The people agreed to be interviewed as it was towards the end of the day and the time for further collection was over. The biggest difference between the two BBCs was that most of the Bellville waste pickers did not have trolleys, while those selling to the BBC in Parow had. The final sample size was 50 (with 30 selling to BBC1 and 20 in BBC2).Footnote6
The completed questionnaires were checked to ensure all sections were completed. Quantitative data was captured on an Excel spreadsheet for use in Stata. The analysis was preceded by the conceptualising of an appropriate approach to classify the under-employment status of the waste pickers in terms of these three approachesFootnote7:
Time-based: The StatsSA approach involves three criteria – working less than 35 h in last week; willing to work longer hours; available to do extra work in next four weeks. We define someone as time-based under-employed as follows: (1) working less than 35 h in last week and (2) currently looking for a full-time job. (See section 4 for an applicable cautionary note on the difference in application between our and StatsSA approaches).
Over-education: Waste picking as an occupation falls under the occupation code 9161: garbage collectors (under the elementary occupations broad occupation category). An employee is over-qualified if his years of education are one standard deviation above the mean years associated with his relevant occupation category (McGuinness, Citation2006). In the third quarter of QLFS 2017, mean and standard deviation of education years in elementary occupations were 8.18 and 3.75, respectively. If the waste picker attained more than 11.93 years of education, he is under-employed.
Low-income: StatsSA (Citation2015) updated the poverty line with the Income and Expenditure Survey (IES) 2010/2011 consumption basket; upper-bound poverty line is R1 071.38 in 2016 December prices.Footnote8 If waste picker’s usual monthly income is less than 125% of upper bound poverty line (R1 339.23 = 1.25 × R1 071.38), he/she is under-employed in this approach proposed by Findeis et al. (Citation2009). In the other approach, the respondent’s answers to the two questions ‘how much income do you usual earned for a day’s waste that you collect?’ and ‘how much money did you earn the last time you sold waste that you have collected?’ – if the income earned last time is 20% less than the usual income, the waste picker is under-employed as suggested by Feldman (Citation1996).Footnote9
4. Limitations and cautionary note for interpreting the results
We acknowledge that time-based underemployment definition is not an exact match to the one used by StatsSA. Our key question in terms of time-based under-employment asks whether a waste picker is looking for a different, full-time job. The StatsSA approach also counts those who are willing and able to work longer hours at their current job. The reason for the difference is in the nature of the occupation. Waste pickers, being informally self-employed, control their own hours and can work longer hours in their current occupation if they wish to do so. Therefore, we had to adjust the question in our questionnaire in an attempt to stick as close as possible to the StatsSA underemployment approaches. We acknowledge our measure may include those looking for a different full-time job because they may be unhappy with their current job for reasons other than only its hours of work.
There is a possible limitation in low-income approach. Friday was the day to conduct fieldwork because that is the day garbage bins are put out for collection. In this way the largest possible sample of respondents could be reached. The implication may be that the earnings potential should be greater on Fridays as the greater availability of waste to collect, increasing the likelihood that income earned last time would be less. We weighed this limitation up against the possible smaller sample size. Furthermore, the waste pickers move to other areas on days when bins are put out there, hence mitigating some of impact of this possible limitation. We do however realise the nature of the job suggests that earnings of waste pickers will be inherently volatile. Again we did our best to mitigate this by utilising several income variables in our analysis, but we agree that the results must be treated with the caution necessitated by these issues.
5. ResultsFootnote10
5.1. Demographic and education profile of the workers
shows that all waste pickers originated from South Africa, with 64% being males. Furthermore, 92% of these workers are coloureds and the rest are Africans, and 92% of the waste pickers speak Afrikaans as home language. The ages of the workers range between 18 and 62 years (mean and standard deviation equal 33.76 and 9.38, respectively). More than three quarters are not married. 34% of waste pickers only attained grades 4–7, 50% attained grades 8–11, and 16% had grade 12 (no one achieved post-matric qualifications). The mean years of education equal 8.56. Although not shown in the table, for those without grade 12, half of them left school before grade 12 due to three main reasons: poverty (26.19%), needing to support their families financially (21.43%), and personal reasons such as drug addiction and pregnancy (19.05%).
Table 2. Demographic and educational attainment characteristics of the waste pickers (%).
5.2. Employment history of workers
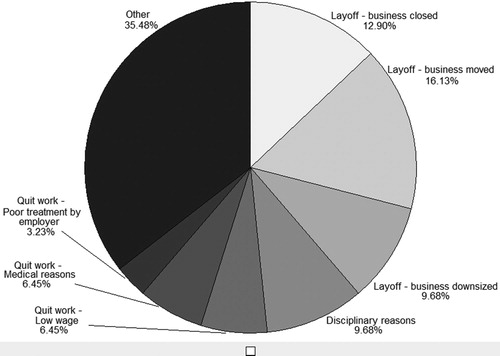
Sixty-two per cent reported they had previously worked in a job that involves the receipt of a pay slip. For this group of workers, average tenure of their last job was 3.1 years. shows that approximately 40% of them left their last job due to business layoffs. Going back to the full sample, 86% claimed they would like to have a full-time job.Footnote11
Figure 1. Reason why the waste pickers left their last job, if they ever worked in a job that involved the receipt of a pay slip.
5.3. Working conditions as a street waste picker
Seventy-eight per cent of waste pickers reported ‘bringing income’ as what they like about their work; whereas 20% claimed ‘scratching in the bins’ as what they dislike, while 18% and 14% answered ‘treated rudely by people’ and ‘bad weather’, respectively (see ). 78% of waste pickers reported either ‘given a trolley’ or ‘given better/bigger trolley’ to make their work better (The possible advantages of having a trolley are obvious when studying and ), while 58% gave the same response when asked what they needed to grow their collection or businesses. The workers were asked why they decided to collect recyclable waste; 56% declared ‘earning money/surviving financially’ as the reason (see ).
Figure 2. Reason why the waste pickers decided to collect recyclable waste.
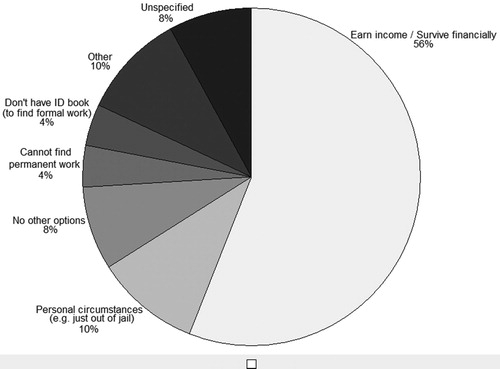
Photo 1. Examples of adapted supermarket trolleys.
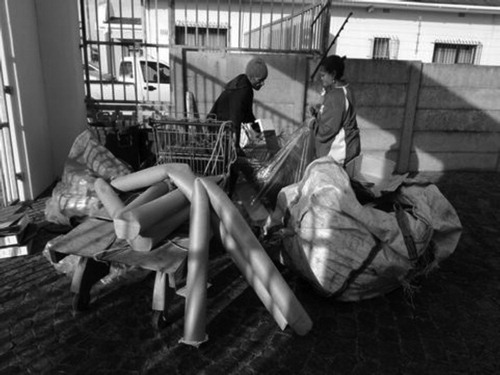
Photo 2. Example of a homemade trolley.
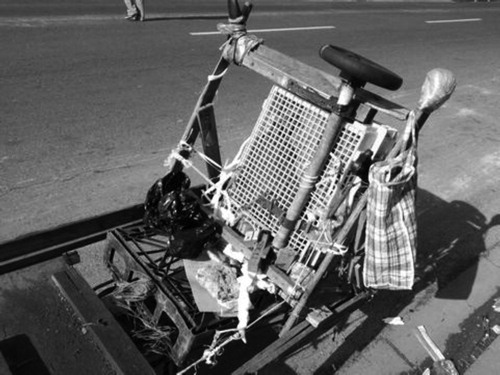
Table 3. Work activities of the waste pickers (%).
Going back to , the waste pickers reported they have been collecting waste for an average duration of 4.13 years. Their daily work hours range between two and 14, with mean and median hours of 9.05 and 9.00, respectively. Although not shown in the table, above 80% worked five to seven days per week (5 days: 35.42%; 6 days: 16.67%; 7 days: 31.25%).Footnote12
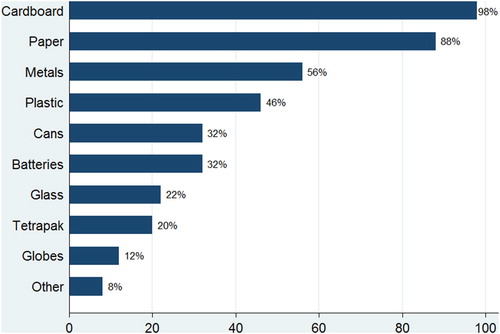
Ninety per cent found the waste at dustbins outside houses; while 52%, 44% and 36% found the waste at shops, industrial areas and schools, respectively (see ). A high proportion of workers reported they collect cardboard (98%) and paper (88%) as the recyclable waste (). Sixty-two per cent of workers reported there are goods (mainly clothes) they collected for personal use; 56% collect food (mainly bread) from dustbins for their own or family’s consumption; 98% of the waste pickers sell the collected waste on a daily basis. Finally, ‘convenient location’ and ‘being paid well’ are main reasons why the workers sell the waste to the two main BBCs.
Figure 3. Where the waste pickers found the waste (more than one option could be declared).
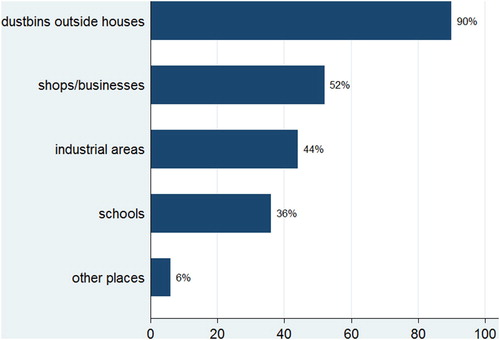
Figure 4. Type of recyclable waste collected by the waste pickers (more than one option could be declared).
Only 54% of the workers claimed they use a trolley to collect the waste products (). For those not using trolleys, 82.6% of them use bagsFootnote13 instead to collect waste. For those having a trolley, 50% said they would like to have a bigger trolley, while nearly 40% said they got the trolley by stealing it at a supermarket. The latter finding is another indication of poverty of waste pickers.
Table 4. Use of trolleys by waste pickers (%).
5.4. Income patterns of workers
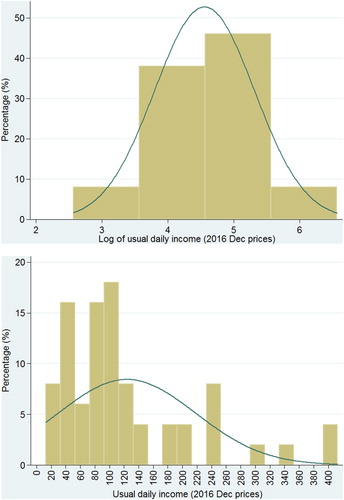
The usual daily income for the sale of a day’s waste ranged between R13 and R400 (see (a)Footnote14), with a mean of R124. After taking the number of workdays per week into consideration, on average, waste pickers earn approximately R2 900 per month (or R97 per day), with 70% of the workers earning below the average. This is lower than the average income of R3 645 of elementary occupation workers upon examining the QLFS 2017 earnings data.
Figure 5. (a) Distribution of usual daily income of waste pickers (2016 December prices). (b) Distribution of log usual daily income of waste pickers (2016 December prices).
shows the mean and median of the four types of daily income, namely the usual daily income, best income (on a good day), worst income (on a bad day) and income earned from the last time the waste was sold. On average, the waste pickers earned R233 on a good day, only R59 on a bad day, and R105 from waste sold last time.
Table 5. Daily income of the waste pickers (2016 December prices).
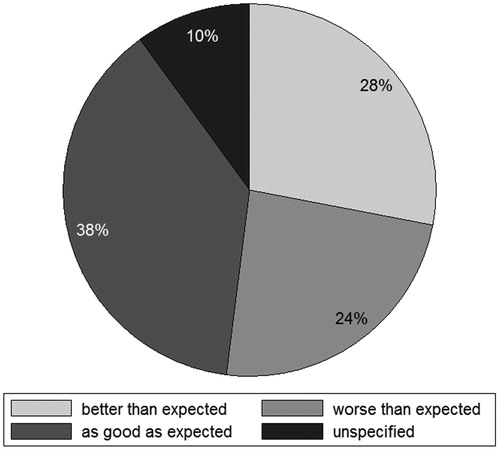
BBC1 provides significantly higher levels of average income to the waste pickers irrespective of the income measure employed. The reasons may lie in better prices offered by the BBC and a more convenient location, enabling the waste pickers to complete more trips per day to it. Finally, only 28% of workers claimed their income is better than expected (see ).
Figure 6. Actual income compared to expected income.
5.5. Social networks and issues of subjective well-being
shows that the majority of workers sleep in hostels or shelters (28%), backyard shacks (24%) or BBCs (24%). Fifty-two per cent reported they stay overnight in Bellville (sleeping on the streets and under bridges). The proportions of workers with access to each facility are: drinking water: – 84%; a place to wash – 68%; toilet – 66%; food – 64%. Furthermore, 70% of workers claimed they are treated well by the public. All workers saw more waste pickers on the streets since they started, while 56% reported health and injury concerns (‘small cuts from glass’ and ‘get sick easily’).
Table 6. Other information on the waste pickers (%).
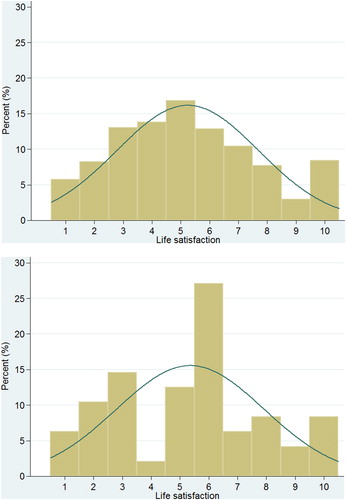
On a scale of 1 (very unhappy) to 10 (very happy), the waste pickers reported how happy they are with life – see (a). Average and median of life satisfaction index are 5.35 and 6, respectively. The results are similar to what happened to the self-employed informal workers in elementary occupations at the time of the 2016 National Income Dynamics Study (mean: 5.23, median: 5), as shown in (b). From the limited literature in this regard, it would seem the waste pickers in this sample have higher levels of subjective well-being than other informally employed workers such as day labourers. For example, Van Wyk (Citation2018) compared the subjective well-being of day labourers in Windhoek and Pretoria in 2015 and 2017; the mean and median were 4.94 and 4.82 in Windhoek, and both equalled 5 in Pretoria.
Figure 7. (a) Distribution of life satisfaction of waste pickers. (b) Distribution of life satisfaction of informal self-employed in elementary occupations, NIDS2016.
5.6. Other working condition aspects, e.g. under-employment
Informal sector workers are expected to be more likely than formal sector workers to be under-employed according to the over-qualification approach, as many workers reluctantly work in this sector to sustain themselves and their dependents (Essop & Yu, Citation2008; Yu, Citation2012). An analysis using the Statistics South Africa 2017 QLFS data confirms this. Under-employment likelihood of informal sector self-employed is the highest with income approach (23.0%), followed by time-based (9.4%) and over-qualification (5.2%) approaches. This is confirmed by . Our findings on waste pickers are similar to the Statistics South Africa QLFS findings on underemployment incidence. For waste pickers, under-employment probability is the highest according to low-income approach (26%), followed by time-based (24%) and over-qualification (16%) approaches.Footnote15 36% of waste pickers are defined as under-employed in one approach, whereas 12% and 2% are distinguished as under-employed in any two or all three approaches, respectively.
Table 7. Underemployment likelihood (%) of non-agricultural workers in each approach.
As mentioned earlier, these results are not nationally representative. They seem to at least provisionally indicate that being informally employed such as waste picking may bring with it a much higher under-employment probability compared to other occupations in the broader informal sector. The statistically significant levels of under-employment of the waste pickers can result in many of the accompanying negative effects of being under-employed, as identified in the literature.
Apart from the obvious issue of inadequate income and high poverty levels among the informally employed, the subconscious effects in terms of subjective well-being are real and ever-present in the minds of these individuals (). Given the importance of income for the subjective well-being of people at the bottom of income distribution (Diener et al., Citation2009:86), the authors employed a cross-sectional regression analysis to investigate possible factors that may have an effect on the income levels of waste pickers.
In all nine models,Footnote16 the advantage of being a male waste picker is statistically significant. Being male enables one to carry bigger loads over longer distances if needed, giving rise to a difference in daily income of between 44 and 52 per cent over female waste pickers. Being married is a significant advantage in terms of usual daily income earned. Married waste pickers can leave home earlier to gain the most advantageous access to the available waste as the spouse is available to complete and/or assist with other important household duties.Footnote17 The hours spent per day on waste did not render a statistically meaningful result in any models. For waste pickers, time spent on waste picking seems to be less important than the timing of the activity itself, in terms of positively influencing income. Early access to the available waste seems to be the key here.
Age and age squared were not statistically significant in any of the models. Being older is expected to be negatively associated with income earned in this physically demanding informal employment activity. Contrary to other studies (Viljoen et al., Citation2016), the use of a trolley did not yield any statistically significant results in all nine models reported in (We tested the trolley dummy variable in specification 1 to nine, but only reported one model with it included as the most expansive one since it was not significant in any model. We also ran a model with only the trolley dummy as explanatory variable. The estimated coefficient, again, was not statistically significant – with a probability of 85 per cent). Although this may at first appear to be a surprising result, it is a function of the specific situation in the area for this study. The waste pickers using a trolley mostly went to the BBC which is much further from the CBD. Those waste pickers who did not use a trolley went to the closest BBC, which is situated within the CBD, enabling them to do multiple trips per day. In practice, even though the waste pickers who went to the distant BBC all used trolleys, they did not gain anything from it in terms of income because their counterparts who sold their recyclables at the other BBC were able to do more trips per day. While the use of a trolley facilitates bigger volumes per trip, this is made up by the others being able to do more trips, albeit with smaller volumes per trip. Although previous studies suggest using a trolley is one of the few ways through which a waste picker can potentially improve their income (Viljoen et al., Citation2018), this is context-specific and does not offer a silver bullet solution to issues of under-employment.
Table 8. Regression of factors associated with the usual daily income generated by the waste pickers.
As expected, the education variables had no significant association with the level of income earned, strengthening the case for the existence of under-employment in terms of the skills-based approach. The analysis confirms that factors influencing income they can earn are mostly exogenous, with no, or at best, little control over it from the waste pickers themselves.Footnote18 We also ran regressions for each individual BBC. However, the sample sizes become quite small (n = 17) for the one BBC and we are hesitant to read too much into the results.Footnote19 It is encouraging though the gender and married variables remain statistically significant and that of the trolley not – as reflected in our income regressions.
presents the results of probit regressions on the likelihood of each type of underemployment. Being male and married offer a statistical significant smaller likelihood of being underemployed in terms of income. This finding makes sense given the results of income regressions in . The same applies for going to the BBC where waste pickers can maximise their income – given their proximity to it and the prices to be earned there. Education, age and hours spent collecting waste is statistically significantly connected to the likelihood of being underemployed in the time-based approach. In the models for over-qualification, education and previous formal employment experience perfectly predict underemployment, causing the model to collapse. No other factors proved to be statistically significant in this approach. Use of a trolley was not statistically significant in any of the models. This strengthen our view that the use of a trolley is probably not a once size fits all solution for underemployment among waste pickers.
Table 9. Logistic estimates of underemployment likelihood.
6. Conclusion and policy considerations
The authors’ analysis of the lives and livelihoods of street waste pickers, originating in the Bellville CBD and delivering their recyclables to two BBCs in Bellville and Parow, revealed that, on average, street waste pickers work more than nine hours a day in an informal employment activity that yields low incomes. Almost all are eager to return to or gain formal employment. However, for most, this is the only viable option to earn some income and therefore they have little choice than to remain waste pickers. The harsh reality of their lives is reflected in the mediocre life satisfaction. Being informally self-employed, according to a formal statistical definition, often masks the reality of the survivalist nature of many of these ‘occupations’. The qualitative discussions with waste pickers revealed they indeed place significant value on the freedom they have to decide on their own hours of work and not ‘having a boss’. Their aggregate welfare (time and monetary reward) is likely higher than other informal workers.
Time-based underemployment is higher among the waste-pickers in this sample compared to informally self-employed in the QLFS. One may conclude that street waste picking is limited in duration, as waste is only put out on certain days and for limited times of day. It suggests there is limited opportunity for work. However, waste pickers often roam different areas on different days of the week to make use of the recyclables being put out in each of the areas. This may help to explain why, despite the possible limited opportunity, the income based underemployment is very similar for this group as for the informally self-employed as a whole in QLFS. Practically, this means that while waste pickers are just as poor as other workers in the informal sector in monetary terms, they often have more free time to do other things (32% work less than eight hours per day).
Waste pickers in this sample display subjective well-being levels similar to that of the informally self-employed in the QLFS and in fact higher than subjective well-being of other informally employed workers such as day labourers (Van Wyk, Citation2018). Blaauw et al. (Citation2020) also found that the subjective well-being of street and landfill waste pickers in Free State is higher than that of other informal workers. Time and individual freedom are important components of agency and the voices of waste pickers should be listened to when seeking ways to enhance the role of waste pickers in the recycling value chain.
Waste pickers provide an invaluable service to local authorities, keeping waste from entering landfills, thereby extending the life of the landfills. We argue that a process of formalising their activities through, for example, the forming of cooperatives may in fact be counterproductive in attempting to internalise some of the positive externalities offered to municipalities and broader recycling industry. Taking decisions impacting the lives of the waste pickers without their participation perpetuate their vulnerability and keep them hovering on the breadline at best, and at worst leave them worse off.
We argue that further (often qualitative research) is needed among the waste pickers in the streets and landfills of South Africa to gain a clearer understanding of how the pickers themselves experience their lives, livelihoods and welfare. This is a crucial precondition for policy makers to assess the contribution of informal waste pickers in the waste economy and to develop strategies to integrate them in the formal waste management strategies of municipalities for their benefit and that of society as a whole.
One strong policy message is that a ‘one-size-fits-all’ solution does not deliver the optimum results on integrating the waste pickers in the waste management strategy of local municipalities. There is a need for an inclusive participatory process to design fit-for-purpose action plans to improve the levels of decency and agency for the waste pickers. The aim should be to facilitate, acknowledge and provide validity and a voice to the waste pickers. Practitioners and policymakers need to urgently engage in facilitative processes to dignify waste pickers’ working conditions and value the services they provide. Engaging with the informally self-employed on issues and policies affecting their work and livelihoods on a case-by-case, municipality-by-municipality basis, is the least society can do in return.
Disclosure statement
No potential conflict of interest was reported by the author(s).
Notes
1 The observations of the fieldworkers while standing at the gates of the BBC provide a fascinating example of this interdependence. There was a woman outside the gate who went through the waste pickers’ collectables while they were waiting in the queue to enter the premises. She was buying items such as clothes, kitchen utensils and other household goods from them. She explained she has a shop in the Wesbank informal settlement where she sells it. This emphasises the interconnectedness of waste picking with other activities in the formal and informal economy.
2 An anonymous reviewer of this article, however, made the important point that interactions with working hours must also be considered, e.g. someone who earns less than the threshold because they voluntarily work only 20 h per week. This is an important area for further investigation.
3 The data was collected from BBCs in Bellville and Parow. Technically, these are two different, adjacent suburbs, but the Parow BBC is on the border with Bellville and, in practice, the waste pickers visiting them are from Bellville, and thus only Bellville is mentioned as the area from which the street waste pickers originate.
4 Cape Town falls within a winter rainfall area, hence July is in the middle of the rainy season. We acknowledge the potential seasonal impact on the productivity of the waste pickers. Previous studies established that in Cape Town inclement weather can make collection difficult. Furthermore, BBCs pay less if paper or cardboard boxes are damp for example (Langenhoven & Dyssel Citation2007). We did our best to account for that by utilising five different measures of daily income (see ).
5 BBC1 and BBC2 were interviewed at different times of day. Theoretically more income could be potentially earned by the end of the day. This could have raised issues of whether the samples represent the sub-populations they intend to if the survey contained questions in term of their activities and income earned on the day of the interview. The key issue in mitigating these risks are the fact that the interviews did not pertain to the income earned from that specific day, but it pertained to various income measures of income earned in a period before the day of the interview. This period is the same for all respondents therefore. In other words, in theory the answers would not have been different had the timing of the interviews been reversed. While we did all we can to mitigate potential systematic income differentials that depends on interview timing, we must acknowledge that another potential problem still exist as pointed out by an anonymous reviewer. Some waste pickers may have ‘permanent’ low-income generating potential, which would systematically include/exclude them from the one BBC or the other permanently. The recall period is not going to solve this, because some high/low earners are not in the sample at all and the pattern of in/exclusion is systematic by being related to the time of day the interview was conducted. The respective sub-samples could therefore still be non-representative and we acknowledge this is a possible limitation of the study.
6 The names of the BBCs were not used for purposes of anonymity.
7 It is possible for a worker to be defined as under-employed under more than one approach.
8 The upper-bound poverty line stands for the expenditure required to meet basic food and non-food needs, with the aid of the cost-of-basic needs approach. In this study, this line is preferred over the lower-bound poverty line, which is derived by assuming that the households sacrifice some basic food needs to meet their non-food requirements. For detailed explanations on how each line is derived, see Statistics South Africa (Citation2015:9).
9 Since, strictly speaking, we are not using panel data to compare the workers’ income across two periods, the results derived by this approach will be shown as supplementary information. That is, the ‘earning less than 125% of poverty line’ income-based approach will be our main focus.
10 The authors fully realise that these results cannot be considered statistically representative of all informal waste pickers in South Africa. This is a particular, targeted sample and the results with regard to the three variables of under-employment could very well differ in other parts of the country, or even within the same city.
11 The question in the survey asked whether they would like to have a full-time job. Further questions probing respondents’ job search activities/strategies were not included as most of them did not have the time to actively seek alternative employment, given the number of hours and days per week that they spent collecting recyclables.
12 While the average daily work hours are nine, upon analysing the data more thoroughly, the standard deviation is fairly high at 3.01. In addition, 32% actually work fewer than eight hours.
13 These bags are mostly pulled manually by the workers along the road to the BBC – which is an arduous task.
14 (b) shows the log of usual income distribution as an additional finding, and the result suggests that the distribution is not as right-skewed when compared to (a).
15 Using the 2010–17 QLFS data, shows that for the informal sector self-employed, under-employment probability was the highest in the low-income approach, while under-employment likelihood was the highest in the over-education approach for formal sector self-employed.
16 In the first model, only the gender is included. Models two to five added being married or not and age are considered. The last four models explored all the demographic variables as well as previous full-time formal work experience. The last model consists of the most extensive model – including all the possible variables. We ran the standard model specification tests. Since the P-values of the specification tests are greater than the conventional alpha values, we accept the null hypothesis that the models have no omitted variables and that they do not suggests any evidence of functional form misspecification.
17 In the sample, for the waster pickers who are married or live together with a partner, 43% travel from home to collect waste, but this proportion is only 30% for unmarried and 25% for divorced or widowed.
18 The authors re-ran the regressions by using income earned from the last time the waste was sold as dependent variable. The results are highly similar to , except that the age in years explanatory variable also became statistically significant in the first two models.
19 The results are available upon request.
References
- Altman, M, 2009. The state of youth: Labour market status and policy challenges. HSRC (Human Sciences Research Council) Press, Cape Town.
- Beukes, R, Fransman, T, Murozvi, S & Yu, D, 2017. Under-employment in South Africa. Development Southern Africa 34(1), 33–55.
- Blaauw, D, Louw, H & Schenck, R, 2006. The employment history of day labourers in South Africa and the income they earn – a case study of day labourers in Pretoria. South African Journal of Economic and Management Sciences, New Series 9(4), 458–71.
- Blaauw, P, Pretorius, A, Viljoen, K & Schenck, R, 2020. Adaptive expectations and subjective well-being of landfill waste pickers in South Africa’s Free State province. Urban Forum 31(1), 135–55.
- Budlender, D, Buwembo, P, Chobokoane, N & Shabalala, N, 2001. The informal economy: Statistical data and research findings; country case study: South Africa. Women in Informal Employment Globalising and Organising (WIEGO), Manchester.
- Creswell, JW & Plano Clark, VLP, 2011. Designing and conducting mixed methods research. 2nd edn. Sage Publishing, Thousand Oaks, CA.
- Devey, R, Skinner, C & Valodia, I, 2005. Second best? Trends and linkages in the informal economy in South Africa. School of development studies working paper No. 06/102. University of KwaZulu-Natal, Durban.
- Devey, R, Skinner, C & Valodia, I, 2006. Definitions, data and the informal economy in South Africa: A critical analysis. In V Padayachee (Ed.), The development decade? Economic and social change in South Africa, 1994–2004. Human Sciences Research Council Press, Cape Town.
- Diener, E, Lucas, RE, Schimmack, U & Helliwell, JF, 2009. Well-being for public policy. Oxford University Press, New York.
- Essers, D, 2014. South Africa labour market transitions during the global financial and economic crisis: Micro-level evidence. Working paper 2014/115. World Institute for Development Economic Research, Helsinki.
- Essop, H & Yu, D, 2008. The South African informal sector (1997–2006). Stellenbosch economic working papers 03/08. Stellenbosch University, Stellenbosch.
- Feldman, D, 1996. The nature antecedents and consequences of under-employment. Journal of Management 22(3), 385–407.
- Findeis, JL, Shields, M & Shrestha, S, 2009. Studies on unemployment and under-employment in rural Pennsylvania: Determining policy options for reducing unemployment and under-employment in rural Pennsylvania. The Center for Rural Pennsylvania, Harrisburg.
- Fourie, FCVN, 2018. The South African informal sector: Creating jobs, reducing poverty. Human Sciences Research Council Press, Cape Town.
- Frith, A, 2019. Bellville – main place 199016 from census 2011. https://census2011.adrianfrith.com/place/199016 Accessed 16 April 2019.
- Godfrey, L, Strydom, W & Phukubye, R, 2016. Integrating the informal sector into the South African waste and recycling economy in the context of extended producer responsibility. https://www.wasteroadmap.co.za/download/informal_sector_2016.pdf Accessed 16 April 2019.
- Greenwood, AD, 1999. International definitions and prospects of under-employment statistics. International Labour Organization: Bureau of Statistics, Geneva.
- Heintz, J & Posel, D, 2008. Revisiting informal employment and segmentation in the South African labour market. The South African Journal of Economics 76(1), 26–44.
- ILO (International Labour Organization), 2019a. Decent work. https://www.ilo.org/global/topics/decent-work/lang–en/index.htm Accessed 16 April 2019.
- ILO (International Labour Organization), 2019b. Working conditions. https://www.ilo.org/global/topics/working-conditions/lang–en/index.htm Accessed 16 April 2019.
- Langenhoven, B & Dyssel, M, 2007. The recycling industry and subsistence waste collectors: A case study of Mitchells plain. Urban Forum 18(1), 114–32.
- Lloyd, N & Leibbrandt, M, 2018. Entry and exit from informal enterprise ownership in South Africa. In FCVN Fourie (Ed.), The South African informal sector: Creating jobs, reducing poverty. Human Sciences Research Council Press, Cape Town.
- Makaluza, N & Burger, R, 2018. Job-seeker entry into the two-tiered informal sector in South Africa. In FCVN Fourie (Ed.), The South African informal sector: Creating jobs, reducing poverty. Human Sciences Research Council Press, Cape Town.
- Mathebula, I, 2013. The determinants of time-related under-employment in South Africa. Statistics South Africa, Pretoria.
- McGuinness, S, 2006. Overeducation in the labour market. Journal of Economic Surveys 20(3), 388–418.
- Naidoo, D, Van Aardt, CJ & Ligthelm, A, 2004. Linkages between the formal and informal sectors in South Africa: An input-output table approach. Bureau for Market Research, University of South Africa, Pretoria.
- Rogan, M & Skinner, CR, 2018. The size and structure of the South African informal sector 2008–2015: A labour-force analysis. In FCVN Fourie (Ed.), The South African informal sector: Creating jobs, reducing poverty. Human Sciences Research Council Press, Cape Town.
- Samson, M, 2012. Wasting value and valuing waste: Insights into the global crisis and the production of value reclaimed from a Soweto garbage dump. Unpublished DPhil thesis, York University, Toronto.
- Samson, M, 2015. Accumulation by dispossession and the informal economy – struggles over knowledge, being and waste at a Soweto garbage dump. Environment and Planning D: Society and Space 33(5), 813–30.
- Schenck, R & Blaauw, PF, 2011a. Living on what others throw away: An exploration of the socioeconomic circumstances of people collecting and selling recyclable waste. The Social Work Practitioner-Researcher 23(2), 135–53.
- Schenck, R & Blaauw, PF, 2011b. The work and lives of street waste pickers in Pretoria: A case study of recycling in South Africa’s urban informal economy. Urban Forum 22(4), 411–30.
- Schenck, CJ, Blaauw, PF & Viljoen, JMM, 2016. The socio-economic differences between landfill and street waste picking in the Free State province. Development Southern Africa 33(4), 532–47.
- Schenck, R, Blaauw, D, Viljoen, K, Swart, R & Mudavanhu, N, 2019. The management of South Africa’s landfills and waste pickers on them: impacting lives and livelihoods. Development Southern Africa 36(1), 80–98.
- Schoeman, CH, Botha, I & Blaauw, PF, 2010. Labour conflict and the persistence of macro under-employment in South Africa. South African Journal of Economic and Management Sciences 13(3), 272–92.
- Sekhwela, MM & Samson, M, 2019. Contested understandings of reclaimer integration – insights from a failed Johannesburg pilot project. Urban Forum. doi:10.1007/s12132-019-09377-1.
- Sentime, K, 2011. Profiling solid waste pickers: A case study of Braamfontein – greater Johannesburg. Africanus 41(2), 96–111.
- StatsSA (Statistics South Africa), 2015. Methodological report on rebasing of national poverty lines and development of pilot provincial poverty lines. Statistics South Africa, Pretoria.
- Theodore, N, Pretorius, A, Blaauw, D & Schenck, C, 2018. Informality and the context of reception in South Africa's new immigrant destinations. Population, Space and Place 24(3), e2119.
- Valodia, I & Devey, R, 2011. Formal, informal economy linkages: Implications for poverty in South Africa. Law, Development and Democracy 14(1), 133–58.
- Van Wyk, AM, 2018. Investigating the subjective well-being of the informally employed: A case study of day labourers in Windhoek and Pretoria. Unpublished masters thesis, North-West University.
- Viljoen, K, Schenck, CJ & Blaauw, PF, 2012. The role and linkages of buy-back centres in the recycling industry: Pretoria and Bloemfontein. Acta Commercii 12(1), 1–12.
- Viljoen, JMM, Blaauw, PF & Schenck, CJ, 2016. “I would rather have a decent job”: Potential barriers preventing street waste pickers from improving their socioeconomic conditions. South African Journal of Economic and Management Sciences 19(2), 175–91.
- Viljoen, JMM, Blaauw, PF & Schenck, R, 2018. “Sometimes you don't make enough to buy food”: An analysis of South African street waste pickers’ income. Journal of Economic and Financial Sciences 11(1), a186. doi:10.4102/jef.v11i1.186.
- Wilkins, R & Wooden, M, 2011. Economic approaches to studying under-employment. In D Feldman & D Maynard (Eds.), Under-employment: Psychological economic and social challenges. Springer, New York.
- Yu, D, 2009. The comparability of Labour Force Survey (LFS) and Quarterly labour Force Survey (QLFS). Stellenbosch economic working papers 08/09. Stellenbosch University, Stellenbosch.
- Yu, D, 2012. Defining and measuring informal employment in South Africa. Development Southern Africa 29(1), 157–75.