
 ?Mathematical formulae have been encoded as MathML and are displayed in this HTML version using MathJax in order to improve their display. Uncheck the box to turn MathJax off. This feature requires Javascript. Click on a formula to zoom.
ABSTRACT
Studies in feminist literature have found that development effects gender equality in labour force participation, but gender equality has also been found to effect economic growth. These two streams of literature, however, lie largely distinct with few studies directly investigating the inter-relationships between development, growth and gender equality, and as such, this lack of knowledge curtails the development of appropriate policy. This study explores the effect of development on gender equality in labour force participation and the effect of this gender equality on economic growth in South Africa on a quarterly basis from 2008 to 18 using Autoregressive Distributive Lag models. Economic development is found to have a positive effect on gender equality in the long run while greater female participation in the labour market is found to have no effect on growth. These results suggest that further development should be prioritised to support gender parity in economic opportunities in South Africa.
JEL CLASSIFICATION:
1. Introduction
The World Economic Forum’s Global Gender Gap (GGP) Index 2018 ranked South Africa 19th out of 149 countries for the overall gender gap. The country was the top performer with respect to health and survival equality, however, it ranked only 91st for economic participation and opportunity. Thus, despite the overall GGP score suggesting that the country is one of the most equal societies and that many of the government’s policies to promote women have yielded success, there is clear evidence that with respect to economic participation and opportunity, females lag behind males in South Africa. Such gender disparity is a continued indictment on the government and private sector’s ability to create a truly equal country for all.
There are several theoretical arguments that seek to explain the effect of economic development on gender equality in labour force participation (LFP). Under the neoclassical model, development is seen to have a positive impact on female LFP. In contrast, under the feminist school of thought a U-shaped relationship is proposed, with development initially decreasing the number of women participating in the labour market, only resulting in greater participation, as per the neoclassical model, in the long run at higher levels of output. Some empirical studies support this U shape, but the evidence is not conclusive. However, the relationship is potentially more complex as economic theory also maintains that the active participation of women in the workforce should have a positive effect on growth; an assertion largely supported by empirical findings. Dollar & Gatti (Citation1999) confirm that it is possible that development effects gender equality and that gender equality also effects growth. While several studies acknowledge that economic development, growth and gender equality may be determined simultaneously (Klasen & Lamanna Citation2009; Luci Citation2009; Gaddis & Klasen Citation2014), few have explicitly explored this aspect of gender equality (Kabeer & Natali Citation2013). The one exception to this is Dollar & Gatti (Citation1999) who found that increases in economic development lead to improvements in various measures of gender equality and, in turn high measures of gender equality in education contribute to high economic growth. Their study, however, did not consider gender equality in LFP.
For South Africa, characterized by years of low economic growth, which is insufficient to support the development of the country and upliftment of its people, it is unclear to what extent gender parity in opportunities is a consequence of the country’s level of development, but also to what extent greater gender equality in opportunities supports economic growth. This has important implications for policymakers, especially at a time when economic growth and development are at the forefront of government’s focus, and women’s economic emancipation remains a key priority area. This study thus seeks to address this lack of knowledge about the effect of development on gender equality in LFP and the effect of gender equality in LFP on economic growth in South Africa. In addition, this is one of only a few studies to examine either of these relationships at the country-level as most studies comprise multi-country datasets. Esteve-Volart (Citation2004) and Klasen & Lamanna (Citation2009) confirm that single country analyses provide a richer understanding of the dynamics of the gender equality and economic growth relationship, while Kilinç et al.’s (Citation2015) study confirmed that the effect of development on gender equality differs across even the most advanced economies.
The remainder of this study is structured as follows: the theoretical relationships between gender equality and economic growth and development are discussed, followed by a review of the empirical tests thereof. The data and methodology are then described, with the results and analysis presented thereafter. The paper concludes with policy recommendations.
2. Literature review
2.1. The effect of economic development on gender equality in labour force participation
The early theoretical argument based on the modernization neoclassical school of thought argued for a purely positive impact of development on gender equality in LFP across all stages of a country’s development (Mincer Citation1958; Krueger Citation1963; Clark Citation1991).Footnote1 Contrary to this view, Boserup (Citation1970)Footnote2 proposed a non-linear U-shaped (convex) relationship to explain the effect of economic development on gender equality, showing that female LFP is dependent on the country’s stage of development. This has become known as the ‘feminization U’ (Luci Citation2009; Kabeer & Natali Citation2013). In low-income agricultural-based economies, where household and market production are closely linked, female LFP is usually high. However, this participation begins to fall as the economy moves towards the manufacturing and services sectors to achieve growth. After a threshold level of output, female participation starts to rise again as a consequence of structural changes in the economy along with greater female education and lower fertility rates (Luci Citation2009). More recently, Eastin & Prakash (Citation2013) proposed a non-linear S-shaped relationship between development and gender equality in LFP. They argue that development has a positive effect on gender equality at low levels of economic output due to social and political developments which support increased female LFP, but as output rises there is a plateau or even negative effect due to potential discriminatory institutions that seek to reinforce male dominance. This is followed by a positive effect at high levels of output due to changes in norms and institutions that support gender parity in employment.
Goldin (Citation1994) graphically examined the relationship between Gross Domestic Product (GDP) per capita, as the measure of development, and LFP of women aged 45–59 across 100 countries using observations in 1980 and 1985 for the two series respectively. Her results traced out the U-shaped relationship proposed by Boserup (Citation1970). Cagatay & Özler (Citation1995) formally tested the effect of development on female LFP. For their sample of 96 countries, they averaged data for the period 1985–90 and estimated a cross-sectional regression. The authors found that the coefficient on the squared GDP term, which captures the curvature of the relationship, was negative, which suggests an inverted U (concave) shape rather than the U shape relationship postulated by theory.
Luci (Citation2009) also tested the U-shaped relationship between GDP and female LFP across 184 countries from 1965 to 2004. Using dynamic panel data techniques to account for possible endogeneity in the relationship, their results confirmed the U shape, suggesting that the results obtained by Cagatay & Özler (Citation1995) may be due to endogeneity or the averaging across time. These findings thus indicate that gender parity in the labour market will not be achieved in developing countries by relying on economic development but rather that active labour market policies are needed to promote female labour market participation. Bussmann (Citation2009), in a study of 134 developed and developing countries over the period 1970–2000, confirmed the U-shaped effect of GDP on women’s LFP but only for developing countries, with no relationship observed for developed countries. Tam (Citation2011) also utilized dynamic panel data estimation for their tests of the relationship between gender equality in LFP and economic development using a sample of 130 countries over the period 1950–80. Their results showed that the U shape holds.
In contrast to these previous studies, Gaddis & Klasen (Citation2014) found very little evidence in support of the U (or inverse U) shape between female LFP and economic development over the period 1980–2008 for a sample of 191 countries. Instead, their results showed that the initial conditions that gave rise to variations in the level of female LFP were the most important determinant of variations in LFP. The authors attribute their differing findings to those of previous studies to the more recent time period they examined. They argue that while the current developed economies may have followed the U shape over the course of their economic development, the U shape cannot explain divergences in LFP of current developing countries, with the exception of a few economies who rely on natural resources.
The findings of Eastin & Prakash (Citation2013) also dispute the feminization U but differ from those of Gaddis & Klasen (Citation2014). In their study of 146 countries over the period 1980–2005, Eastin & Prakash (Citation2013) found an S-shaped relationship between economic output and gender equality in LFP. Consequently, the authors suggest that gender policies must be tailored for each development phase, with particular focus on minimizing the negative effects in the second stage. Kilinç et al. (Citation2015), building on the work of Eastin & Prakash (Citation2013), tested for the existence of a quadratic or cubic relationship between GDP and the share of females in the workforce for the G7 countries over the period 1955–2010. Their results revealed that the relationship is country-specific, with the relationship characterized by an inverted U for Canada, the United Kingdom and the United States; an S shape for Japan; an inverted S shape for France; while no relationship was observed for Italy and Germany. Kilinç et al. (Citation2015) thus concluded that gender equality in economic opportunities is not a direct consequence of economic development and, as such, policies to support female participation in the labour market must be explicitly pursued.
2.2. The effect of gender equality in labour force participation on economic growth
While the effect of economic development on gender equality has been the subject of substantial debate, the theory and evidence largely support the positive effect of gender equality in LFP on economic growth. There are various direct and indirect channels through which gender equality in LFP positively impacts economic growth (Blackden et al. Citation2007). Firstly, gender discrimination in the access to employment and management positions artificially reduces the talent pool from which employers can draw, as less qualified men push more qualified women out of the job market. Consequently, the average productive capacity of the workforce falls limiting the ability of the economy to grow to its full potential (Esteve-Volart Citation2004; Klasen & Lamanna Citation2009). Secondly, female employment has a substantial impact on household behaviour. Sen (Citation1990) and several other scholars (such as Thomas Citation1997; Klasen & Wink Citation2003) argue that female employment and earnings increase the bargaining power of females in the home, which is not only of direct benefit to them, but also results in increased investment in the health and education of their children. This promotion of the human capital of the next generation is likely to support greater economic growth. Greater female employment also typically lowers fertility rates and thus supports economic growth by reducing dependence (Cavalcanti & Tavares Citation2016). Galor & Weil (Citation1996) also show that the higher household income arising from female LFP supports greater savings, which, in turn, raises the capital stock per worker and increases output, while Stotsky (Citation2006) also argued that it can result in more productive investment and the repayment of credit.
Thirdly, when there are different or separate productive activities that men and women undertake, gender inequality can result in distortions, with ‘female activities’ under-resourced and under-capitalised with the opposite being true for ‘male activities’. Due to diminishing marginal returns of the ‘male activities’ and/or losses arising from women being excluded from some of the more productive activities, this distortion reduces output. Moreover, this gender inequality may also reduce maintenance and improvement of existing assets, such as land, and investments in new technology, which will hamper growth (Udry Citation1996; Blackden et al. Citation2007).
The findings of Klasen (Citation1999), from a sample of 109 countries over the period 1960–92, support these theoretical arguments that gender equality in economic opportunities has a positive effect on economic growth. Thus, reducing gender gaps in LFP not only benefits women intrinsically but is also meaningful in economic terms. Klasen & Lamanna (Citation2009) conducted an updated study using a larger sample of 140 countries and a longer time period covering 1960–2000. Their results confirmed that gender equality in LFP has a positive impact on growth, with the effect more pronounced in the Middle East and North Africa (MENA) region and South Asia compared to other parts of the world. The study of Esteve-Volart (Citation2004), which analyzed gender equality and economic growth across the various states of India over the period 1961–91, confirmed a strong positive relationship between gender equality in LFP and economic growth. In a more recent study of 101 countries over the period 1990–2000, Mitra et al. (Citation2015) found that increased equality in economic opportunities led to an increase in growth, with this effect more pronounced in developing compared to developed countries.
Baliamoune-Lutz & McGillivray (Citation2009), however, found that female LFP had a significant negative effect on growth in their study of a sample of countries from sub-Saharan Africa (SSA) and MENA. The authors argued that although these results contrast with theory, they are consistent with the context of these countries, which are characterized by low growth but substantial female economic activity mostly in the agricultural sector.
3. Methodology
3.1. Data and descriptive statistics
The goal of this study is to assess the effects of development on gender equality in LFP in South Africa and the effect of this gender equality on economic growth. Ideally this analysis would be conducted over a long time horizon, however, the time period was restricted due to the lack of labour market data. As such, some of the relationships identified may not fully capture the effects as they take time to manifest and the results of the study should be interpreted with this caveat in mind.
Quarterly data for male and female employment was obtained from Statistics South Africa’s Quarterly Labour Force Surveys (QLFS) for the period 2008–18.Footnote3 Gender equality in employment has typically been measured in the literature as the ratio of female-to-male labour force participation rates (Klasen & Lamanna Citation2009), which is also consistent with the measures used in several international gender equality metrics (Blankenship & Kubicek Citation2018) and was thus used in this study. A value of one, meaning equal LFP across the genders, means equal opportunities to seek and access employment in the workplace. As shown in , gender equality in LFP in South Africa initially worsened following the global financial crisis and the subsequent recession in the country. However, from 2011 onwards an improvement in gender equality was evident, although this was not characterized by a smooth upward trend. At no point during the period under study was there gender parity in employment opportunities in South Africa.
Figure 1. Female-to-male LFP, log of real GDP and economic growth, 2008–18.
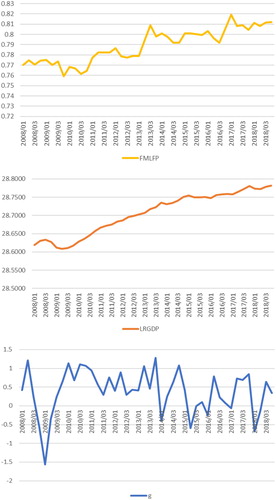
Economic development was measured as seasonally adjusted real GDP (constant 2010 prices), obtained from the South African Reserve Bank, and the natural log thereof computed. As seen in the second panel of , the highest real domestic output was recorded in the final quarter of 2018, while the lowest value occurred in the second quarter of 2009, coinciding with a recessionary period in South Africa. Economic growth was measured as the percentage change in the natural log of real GDP, with the series depicted in the third panel of . The growth rate, while appearing volatile, remained within a narrow band between −0.7% and 1.3% per quarter over the entire period, except for the recession in the first quarter of 2009. This clearly confirms the country’s lacklustre growth in the last decade.
3.2. Model specification
The relationships between economic development and gender equality in LFP, and gender equality in LFP and economic growth are given as followsFootnote4,Footnote5 (Dollar & Gatti Citation1999; Klasen & Lamanna Citation2009; Kilinç et al. Citation2015):(1)
(1)
(2)
(2) where:
is the female to male labour force participation ratio,
is the natural log of real GDP which is used to measure economic development and
is economic growth measured as the
.
3.3. Methodology
3.3.1. Unit root and stationarity tests
In order to determine the appropriate method to estimate these equations, the stationarity of the series had to be ascertained. For this purpose, the Augmented Dickey Fuller (ADF), Phillips & Perron (Citation1988) (PP) and Kwaitowski et al. (Citation1992) (KPSS) tests were used. The ADF test augments the original Dickey & Fuller (Citation1979, Citation1981) test equations with lags of the dependent variable to remove the effects of autocorrelation in the series. The null hypothesis of the test is that the series has a unit root (I(1)) against the alternative hypothesis that the series has no unit root/is stationary (I(0)). Agiakloglou & Newbold (Citation1992) show that the ADF test is sensitive to the use of the incorrect number of lags and, in this circumstance, tends to under-reject the null hypothesis (a Type II error). To avoid this, the optimal number of lags was determined by the Akaike Information Criterion (AIC) due to its good small sample properties.
The PP test follows the ADF test closely, with the same hypotheses, but uses an alternative procedure to handle the autocorrelated residuals, thus avoiding the need to specify an optimal number of lags. Both tests, however, have low power when the series has a ‘near’ unit root but is stationary. The KPSS test, which reverses the null and alternative hypotheses, overcomes this shortcoming. In addition, the KPSS test is also more powerful than these two tests in small samples, as is the case in this study. However, the KPSS test tends to reject the null hypothesis too frequently (a Type I error). Given the limitations of the various tests, they are best used in conjunction to ensure accurate results. For those variables that were found to be non-stationary in levels, the first differences were also tested for the presence of a unit root.
The results for the unit root and stationarity tests, presented in , indicate that real GDP and the FMLFP ratio are non-stationary in levels but stationary in first differences. Economic growth, measured as the percentage change in real GDP, is thus stationary in levels.Footnote6
Table 1. ADF, PP and KPSS test results.
3.3.2. Estimation techniques
As both economic development and gender equality in LFP were found to be I(1), Ordinary Least Squares (OLS) could not be used to estimate equation (1) as it would result in a spurious regression. In the case that two (or more) variables are non-stationary, it is possible that a linear combination of the variables may be stationary; a condition known as cointegration (Engle & Granger Citation1987). If the variables are found to be cointegrated, then it means that a long run equilibrium relationship exists between them. The Autoregressive Distributed Lag (ARDL) model was employed to test for cointegration. Kilinç et al. (Citation2015) also used this approach in their study of the effect of development on gender equality in each of the G7 countries.
Developed by Pesaran & Shin (Citation1999) and Pesaran et al. (Citation2001), the ARDL technique builds on the earlier approaches developed for the analysis of I(1) variables by Engle & Granger (Citation1987), Johansen (Citation1988) and Johansen & Juselius (Citation1990). This model has several advantages over these other methods of testing for cointegration. Firstly, the ARDL model yields consistent estimates of the long run coefficients irrespective of whether the explanatory variables are I(1) or I(0) whereas for the other testing approaches all variables must be I(1) (Pesaran & Shin Citation1999). However, the variables cannot be integrated of any higher order (e.g. I(2)) and thus it is still necessary to pre-test the series to determine their order of integration. As shown in , both variables satisfied this condition. Secondly, and with importance to this study, the ARDL model has good small sample properties, which is not true for the other approaches (Ozturk & Acaravci Citation2010).
Endogeneity may be present in the relationships tested, as documented in several international studies in section 2. The ARDL model, through the inclusion of the appropriate number of lags of the dependent and independent variables in the regression equation, removes residual correlation and therefore mitigates the problem of endogeneity (Pesaran & Shin Citation1999; Kanas & Kouretas Citation2005). The ARDL model thus results in consistent coefficient estimates, which are super consistent when the variables are I(1) (Pesaran & Shin Citation1999). The model has thus been used in several applications where endogeneity among the regressors is likely to be of concern (such as Kanas & Kouretas Citation2005; Gemmel et al. Citation2016; Nkoro & Uko Citation2016; and Ebadi Citation2018) and was thus considered appropriate for this study.
Equation (1) is presented in the ARDL framework as follows:(3)
(3) where
is the first difference operator and
is the white noise error term. The optimal number of lags of the first differenced variables was determined using the AIC.
The bounds test for cointegration entails an F-test of the joint significance of the coefficients on the long run variables in equation (3), with the null and alternative hypotheses as follows: against
The null hypothesis equates to the test of no cointegrating relationship between the variables against the alternative that there is a cointegrating relationship. Pesaran et al. (Citation2001) generated two sets of critical values for each significance level – the upper bound values assume all variables are I(1) and the lower bound values assume that all variables are I(0). If the computed F-statistic exceeds the upper critical value, then the null hypothesis of no cointegration can be rejected, while if the test statistic is below the lower critical value, then the null hypothesis cannot be rejected. If the test statistic falls within the two critical values, then the test is inconclusive (Pesaran et al. Citation2001).
If cointegration is found between the variables, then equation (1) represents the long run relationship and can be estimated to examine the magnitude and direction of the relationship between economic development and equality in LFP. The ARDL Error Correction Model (ECM) can also be estimated. It captures the short-run relationship between changes in economic development and gender equality in LFP but also includes information about the long run through the error correction term (ECT) as shown below:(4)
(4) where
is obtained from equation (1):
. The magnitude of the coefficient on the ECT indicates the speed at which equilibrium is restored and should be negative so that the variables converge to the long run relationship (Ozturk & Acaravci Citation2010).
Turning to the estimation of equation (2), economic growth was found to be I(0) while the FMLFP ratio was I(1). The differing orders of integration of the two variables results in an unbalanced regression meaning that neither OLS nor cointegration techniques can be validly applied (Baffes Citation1997). To account for this, the first differences of the FMLFP ratio were used as the explanatory variable. The ARDL model was favoured over a simple OLS regression for the estimation of the relationship as it provides the advantage that it accounts for endogeneity, as mentioned above. However, no long run relationship was tested for because the variables are stationary. The equation estimated was as follows:(5)
(5)
4. Results and analysis
Prior to estimating the ARDL models, the optimal number of lags of the dependent and independent variables to be included in each equation were determined. The three model orders with the lowest AIC for each specification are shown in . For equation (3), the optimal lag order included one lag of the dependent variable, the change in the FMLFP ratio, and one lag of the change in economic development (1,1), with all three specifications with the lowest AIC signalling only one lag of the change in development. For equation (5), the two model orders with the lowest AIC both indicated a single lag of the dependent variable, economic growth, while the lowest and third lowest both pointed to no lags of the FMLFP ratio. The model order with the lowest AIC was (1,0).
Table 2. AIC results for the optimal lag length of the ARDL models.
The bounds test for cointegration was performed to test the long run relationship between economic development and gender equality in LFP. The F-statistic of 13.29 exceeds the upper critical value at the 1% level meaning that the null hypothesis of no cointegration can be rejected.Footnote7 Thus, there is evidence to suggest that a long run relationship does exist between economic development and gender equality in South Africa. The long run coefficient on development () of 0.27 is positive and significant at 1%, as shown in Panel A of . Although the relationship between gender equality in LFP and economic output may have changed over the course of South Africa’s development (possibly characterized by a U, inverted U or S shape), the results show that over the period 2008–18, greater development as measured by economic output, had a positive effect on female labour market participation. This is consistent with the explanations proposed by Boserup (Citation1970) and Eastin & Prakash (Citation2013) as South Africa is an industrial- and services-orientated economy, with high gender parity in education, falling fertility rates, and strong norms and institutions that support gender parity in LFP.
Table 3. Coefficient estimates from the regression of economic development on the FMLFP ratio.
The results from the ECM, shown in panel B of , indicate that there is no short-run impact of development on gender equality in LFP as the coefficient () is insignificant. Likewise, the first lag of the female-to-male LFP ratio (
) also has no significant effect on the current period value of the female-to-male LFP ratio. The coefficient on the ECT (
) is negative and significant, confirming that any disequilibrium in the long run relationship between development and equality in LFP is corrected for each period. Moreover, the large coefficient of 0.74 demonstrates that the disequilibrium is corrected for rapidly.
The results from equation (5), the regression of changes in gender equality in LFP on economic growth, are presented in . Previous quarter economic growth was found to have a significant positive impact () on current quarter growth while changes in gender equality in LFP (
) had no effect on growth. This latter result differs from the largely positive relationship obtained in the multi-country studies. However, Baliamoune-Lutz & McGillivray (Citation2009), whose study of countries from SSA and MENA found a negative effect of gender equality in LFP on growth, argued that the dynamics of the country may result in findings that contrast with theory. For South Africa, therefore, this finding of no effect can potentially be understood by recognizing that the country lacks many of the critical factors necessary to drive growth, such as capital and strong institutions. As such, without these essential ingredients, even the greater role of females in the labour market, with the attendant benefits described previously, has had little impact on growth in the period 2008–18. However, this result of no relationship may also reflect the short time period studied, as some of the channels through which changes in gender equality in LFP may affect growth, as described in section 2.2, may take time to materialize.
Table 4. Coefficient estimates from the regression of changes in the FMLFP ratio on economic growth.
5. Conclusion and policy recommendations
The results from the study are two-fold. Firstly, they show that economic development has had a positive and significant effect on gender equality in LFP in South Africa over the period 2008–18. Secondly, there is no evidence that changes in gender equality in LFP had an effect on economic growth in South Africa. This latter finding contrasts with the thinking on which gender programmes are built that gender equality will improve economic growth. Based on the findings of this study, policymakers should instead focus on improving economic development and, over time, this will provide greater labour market opportunities for women in South Africa. In addition, because development has been slow in South Africa and gender parity in LFP has yet to be achieved, the government should also look to intervene directly to support greater female participation in the labour market.
In light of these findings, the policy recommendations from general to specific are as follows:
Government has identified manufacturing; wholesale and retail trade; transport; mining; financial services; agriculture and agribusiness; and tourism as the key sectors to drive development in South Africa under the industrialization programme. Policymakers should continue along this trajectory as South Africa’s economy will grow through industrialization and increased business in the services sector which, in turn, will give rise to greater opportunities for females in the labour market.
Currently industrial sectors are male-dominated but over time, government programmes should increase the number of female workers in these sectors to realize gender equality. Women dominate the services sector but in the lower-paid jobs. By educating and training women for the industrial sector and more specialized services jobs, the job market will change as development occurs.
Training programmes should be introduced to prepare women to take up these positions as development occurs. Government could incentivise universities and training institutions to attract more women candidates onto training programmes in male-dominated fields, such as construction and engineering. School programmes (formal and informal) could also be introduced, for example the Science, Technology, Engineering and Mathematics (STEM) programmes for girls, to ensure that the pipeline of women trained address the needs of the market.
Due to the nature of the economy and gendered social relations, it is recommended that child-care facilities are made available to workers who require the services for their families. Some companies do offer these services, but it is not common practice. Carers who have this facility, especially women, are more likely to remain in employment if they have reliable and safe care facilities (Elborgh-Woytek et al. Citation2013).
Finally, flexible working arrangements could reduce the gendered barriers to full employment. If women have more flexible work hours, they would be able to balance their childcare duties with those related to their fulltime employment (Elborgh-Woytek et al. Citation2013).
We recommend that this research is updated in five years to determine whether the relationship between gender equality in LFP, economic development and growth changes over time in South Africa and so enable policies to be adjusted accordingly.
Disclosure statement
No potential conflict of interest was reported by the author(s).
Notes
1 These studies adapted Becker’s (Citation1957) discrimination theory to gender discrimination in employment.
2 Boserup (Citation1970) adapted Kuznet’s (Citation1955) income inequality theory to the gender inequality case.
3 While semi-annual data for the period 2000–07 was available from the previously conducted semi-annual surveys, the employment and unemployment fields differed too much from the quarterly surveys to use the data.
4 No control variables were included. This mirrors the single- (Kilinç et al. Citation2015) and multi-country (Luci Citation2009; Gaddis & Klasen Citation2014) studies of the effect of economic output on gender equality. Moreover, several studies that have examined the effect of a particular variable on economic growth in a country have also excluded control variables (see for example Odhiambo Citation2009; Ozturk & Acaravci Citation2010). The small sample size also impacted upon the decision to exclude control variables.
5 Although some of the theory and evidence surveyed in Section 2.2 points to a non-linear effect of economic growth on gender equality in LFP, this is seen to occur over a long period in a country’s development. Given the short time period examined, it was not possible to ascertain how the effect of development on gender equality in LFP may have changed through South Africa’s development. Instead, this analysis enables us to examine whether economic development in the country has a negative, positive or no effect on gender equality in LFP and hence what portion of the curve South Africa is currently positioned on.
6 The results for economic growth are not shown as it is equivalent to the test of LRGDP in first differences.
7 The lower bound critical values are 5.26 and 7.63 for the 5% and 1% levels respectively, while the upper bound critical values are 6.16 and 8.83 for the 5% and 1% levels respectively based on a sample size of 40.
References
- Agiakloglou, C & Newbold, P, 1992. Empirical evidence on Dickey-Fuller-type tests. Journal of Time Series Analysis 13(6), 471–83. doi: 10.1111/j.1467-9892.1992.tb00121.x
- Baffes, J, 1997. Explaining stationary variables with non-stationary regressors. Applied Economics Letters 4, 69–75. doi: 10.1080/758521836
- Baliamoune-Lutz, M & McGillivray, M, 2009. Does gender inequality reduce growth in sub-Saharan African and Arab countries? African Development Review 21(2), 224–42. doi: 10.1111/j.1467-8268.2009.00209.x
- Becker, GS, 1957. The economics of discrimination. University of Chicago Press, Chicago.
- Blackden, M, Canagarajah, S, Klasen, S & Lawson, D, 2007. Gender and growth in Sub-Saharan Africa: Issues and evidence. In Mavrotas G & Shorrocks A (Eds.), Advancing development. Palgrave Macmillan, London, 349–370.
- Blankenship, J & Kubiçek, P, 2018. Democratization and gender equality in sub-Saharan Africa. The Journal of the Middle East and Africa 9(1), 27–50. doi: 10.1080/21520844.2018.1449458
- Boserup, E, 1970. Women’s role in economic development. St. Martin’s Press, New York, NY.
- Bussmann, M, 2009. The effect of trade openness on women’s welfare and work life. World Development 37(6), 1027–38. doi: 10.1016/j.worlddev.2008.10.007
- Cagatay, N & Özler, S, 1995. Feminisation of the labour force: The effects of long-term development and structural adjustment. World Development 23(11), 1889–94.
- Cavalcanti, T & Tavares, J, 2016. The output cost of gender discrimination: A model-based macroeconomic estimate. The Economic Journal 126(590), 109–34. doi: 10.1111/ecoj.12303
- Clark, R, 1991. Controlling perspectives on women’s access to prestigious occupations: A cross-national investigation. Social Science Quarterly 72(2), 20–32.
- Dickey, DA & Fuller, WA, 1979. Distribution of the estimators for autoregressive time series with a unit root. Journal of the American Statistical Association 74(336), 427–31.
- Dickey, DA & Fuller, WA, 1981. Likelihood ratio statistics for autoregressive time series with a unit root. Econometrica 49(4), 1057–72. doi: 10.2307/1912517
- Dollar, D & Gatti, R, 1999. Gender inequality, income, and growth: Are good times good for women? World Bank policy research report on gender and development working paper series 1, Washington, DC.
- Eastin, J & Prakash, A, 2013. Economic development and gender equality: Is there a gender Kuznets curve? World Politics 65(1), 156–86. doi: 10.1017/S0043887112000275
- Ebadi, E, 2018. On the measurement of the government spending multiplier in the United States: an ARDL cointegration approach. MPRA paper no. 85459.
- Elborgh-Woytek, K, Newiak, M, Kochhar, K, Fabrizio, S, Kpodar, K, Wingender, P, Clements, B & Schwartz, G, 2013. Women, work and the economy: Macroeconomic gains from gender equity. International Monetary Fund staff discussion note SMN/13/10, Washington DC.
- Engle, RF & Granger, CW, 1987. Cointegration and error correction: Representation, estimation, and testing. Econometrica 55(2), 251–76. doi: 10.2307/1913236
- Esteve-Volart, B, 2004. Gender discrimination and growth: Theory and evidence from India. DEDPS working paper 42, London School of Economics and Political Science, London.
- Gaddis, I & Klasen, S, 2014. Economic development, structural change, and women’s labour force participation. Journal of Population Economics 27(3), 639–81. doi: 10.1007/s00148-013-0488-2
- Galor, O & Weil, DN, 1996. The gender gap, fertility and growth. American Economic Review 86(3), 374–87.
- Gemmell, N, Kneller, R & Sanz, I, 2016. Does the composition of government expenditure matter for long-run GDP levels? Oxford Bulletin of Economics and Statistics 78(4), 522–47. doi: 10.1111/obes.12121
- Goldin, C, 1994. The U-shaped female labour force function in economic development and economic history. NBER working paper 4707, National Bureau of Economic Research, Cambridge, MA.
- Johansen, S, 1988. Statistical analysis of cointegration vectors. Journal of Economic Dynamics and Control 12(2–3), 231–54. doi: 10.1016/0165-1889(88)90041-3
- Johansen, S & Juselius, K, 1990. Maximum likelihood estimation and inference on cointegration - with applications to the demand for money. Oxford Bulletin of Economics and Statistics 52(2), 169–210. doi: 10.1111/j.1468-0084.1990.mp52002003.x
- Kabeer, N & Natali, L, 2013. Gender equality and economic growth: Is there a win-win? IDS working paper 417, Institute of Development Studies, London.
- Kanas, A & Kouretas, GP, 2005. A cointegration approach to the lead-lag effect among size-sorted equity portfolios. International Review of Economics and Finance 14(2), 181–201. doi: 10.1016/j.iref.2003.12.004
- Kilinç, D, Onater, E & Yetkiner, H, 2015. The ARDL test of Gender Kuznets Curve for G7 countries. Journal for European Theoretical and Applied Studies 3(2), 37–56.
- Klasen, S, 1999. Does gender inequality reduce growth and development? World Bank policy research department working paper no. 7, Washington DC.
- Klasen, S & Lamanna, F, 2009. The impact of gender inequality in education and employment on economic growth: New evidence for a panel of countries. Feminist Economics 15(3), 91–132. doi: 10.1080/13545700902893106
- Klasen, S & Wink, C, 2003. Missing women: Revisiting the debate. Feminist Economics 9(2/3), 263–99. doi: 10.1080/1354570022000077999
- Krueger, A, 1963. The economics of discrimination. Journal of Political Economy 71(5), 481–86. doi: 10.1086/258796
- Kuznets, S, 1955. Economic growth and income inequality. American Economic Review 45(1), 1–28.
- Kwaitowski, D, Phillips, PCB, Schmidt, P & Shin, Y, 1992. Testing the null hypothesis of stationarity against the alternative of a unit root. Journal of Econometrics 54(1–3), 159–78. doi: 10.1016/0304-4076(92)90104-Y
- Luci, A, 2009. Female labour market participation and economic growth. International Journal of Innovation and Sustainable Development 4(2/3), 97–108. doi: 10.1504/IJISD.2009.028065
- MacKinnon, JG, 1996. Numerical distribution functions for unit root and cointegration tests. Journal of Applied Econometrics 11(6), 601–18. doi: 10.1002/(SICI)1099-1255(199611)11:6<601::AID-JAE417>3.0.CO;2-T
- Mincer, J, 1958. Investment in human capital and personal income distribution. Journal of Political Economy 70(5), 50–79. doi: 10.1086/258725
- Mitra, A, Bang, JT & Biswas, A, 2015. Gender equality and economic growth: Is it equality of opportunity or equality of outcomes? Feminist Economics 21(1), 110–35. doi: 10.1080/13545701.2014.930163
- Nkoro, E & Uko, A, 2016. Autoregressive Distributed Lag (ARDL) cointegration technique: Application and interpretation. Journal of Statistical and Econometric Methods 5(4), 63–91.
- Odhiambo, NM, 2009. Energy consumption and economic growth nexus in Tanzania: An ARDL bounds testing approach. Energy Policy 37, 617–22. doi: 10.1016/j.enpol.2008.09.077
- Ozturk, I & Acaravci, A, 2010. The causal relationship between energy consumption and GDP in Albania, Bulgaria, Hungary and Romania: Evidence from ARDL bound testing approach. Applied Energy 87, 1938–43. doi: 10.1016/j.apenergy.2009.10.010
- Pesaran, MH & Shin, Y, 1999. An autoregressive distributed lag modeling approach to cointegration analysis. In S Strom (Ed.), Econometrics and economic theory in the twentieth century: The Ragnar Frisch centennial symposium. Cambridge University Press, Cambridge, 371–413.
- Pesaran, MH, Shin, Y & Smith, RJ, 2001. Bounds testing approaches to the analysis of level relationships. Journal of Applied Econometrics 16(3), 289–326. doi: 10.1002/jae.616
- Phillips, PCB & Perron, P, 1988. Testing for a unit root in time series regression. Biometrika 75(2), 335–46. doi: 10.1093/biomet/75.2.335
- Sen, A, 1990. Gender and cooperative conflicts. In Tinker I (Ed.), Persistent inequalities: Women and world development. Oxford University Press, Oxford, 123–149.
- Stotsky, J, 2006. Gender and its relevance to macroeconomic policy: A survey. International Monetary Fund working paper WP/06/233, Washington DC.
- Tam, H, 2011. U-shaped female labour participation and economic development: Some panel data evidence. Economics Letters 110, 140–42. doi: 10.1016/j.econlet.2010.11.003
- Thomas, D, 1997. Incomes, expenditures and health outcomes: Evidence on intrahousehold resource allocation. In Haddad LJ, Hoddinott J & Alderman H (Eds.), Intrahousehold resource allocation in developing countries. Johns Hopkins University Press, Baltimore, 142–164.
- Udry, C, 1996. Gender, agricultural production, and theory of the household. Journal of Political Economy 104(5), 1010–46. doi: 10.1086/262050