
 ?Mathematical formulae have been encoded as MathML and are displayed in this HTML version using MathJax in order to improve their display. Uncheck the box to turn MathJax off. This feature requires Javascript. Click on a formula to zoom.
ABSTRACT
This study explores connections between urban planning, sprawl, and social vulnerability factors in the Sub-Saharan context with the aim to investigate the influence of broader planning and land use aspects in quantitative urban social vulnerability assessment. Dar es Salaam, Tanzania serves as the study area because of its substantial informal development, sprawling, and availability of reliable datasets for recent years. Two main research questions are proposed: does urban planning reduce social vulnerability (measured by quality of life and mobility) and does urban sprawl contribute to social vulnerability in this city? Results indicate formally planned urban areas are associated with higher levels of quality of life and mobility. Further results indicate no significant impact of sprawl on social vulnerability factors of residents in the general urban areas of Dar es Salaam, however, informal sprawl is linked to higher social vulnerability.
1. Introduction
It is well established that a majority of the global population now lives in cities, with urbanisation, particularly in developing nations, continuing to increase and intensify (United Nations, Citation2015). In this regard, urban populations and spaces are important subjects of interest to scholars, especially where high rates of urbanisation magnify existing or introduce new inefficient, inequitable, and vulnerable outcomes. Scholars have observed multifaceted relationships between urban areas and vulnerabilities, whereby urban processes and activities have been suggested to accelerate, maintain, and/or reduce defined vulnerabilities of populations and in cities (Adelekan et al., Citation2015; Krellenberg et al., Citation2016). These multifaceted relationships between the urban, urbanisation, and vulnerability require pointed inquiry in specific contexts in order to determine what urban processes and activities affect which populations, by what factors, in what spaces and scales, and to what (or how) they are vulnerable. Specifying the dimensions is inferred to improve understanding of distinct contextual processes and enable targeted approaches to improve equitable outcomes and mitigate defined vulnerabilities in cities, particularly those cities which are still urbanising.
Current impacts of formal urban planning and governance institutions tasked with addressing vulnerabilities and equitable planning are unclear in many Sub-Saharan cities. For example, these institutions often struggle with administrative and resource inconsistencies (Kironde, Citation2000; UN Habitat, Citation2010), as well as data collection and data availability limitations (Borel-Saladin et al., Citation2018). Also, the existence of multiple, overlapping, and multi-scalar formal and informal development activities and systems further complicate the urban landscape (Boamah & Walker, Citation2017). The influences of formal urban planning on vulnerability in Sub-Saharan cities are thus difficult to measure and express.
This paper aims to identify the influence of formal urban planning and sprawling on the social vulnerability of urban residents. Dar es Salaam, Tanzania is the selected case study area. Using quantitative methods such as principal component analysis (PCA), statistical regressions, and spatial mapping techniques, the paper also aims to provide new pathways to build upon the concept of social vulnerability in the Sub-Saharan urban environment. Dar es Salaam’s context of high percentage of informal residents and rate of urbanisation make the city a relevant area for this type of study. Furthermore, the availability of reliable open data sources for Dar es Salaam allowed for the analysis, as other parts of the Sub-Saharan region typically face challenges from limited data availability and access, and/or lack of reliable data which distinguish informally developed areas.
2. Social vulnerability
2.1. Vulnerability, urban vulnerability, and social vulnerability
Vulnerability as a basic term is defined as a system’s susceptibility to harm (Kelman et al., Citation2016). Initially stemming from natural disaster studies, it has been further developed in diverse ways over time across fields, with early vulnerability studies focusing on natural systems, later transitioning to human dimensions of vulnerability (i.e. social and economic), and more recently focusing on coupled socio-environmental systems and comprehensive sustainable development directions (Fang et al., Citation2016; Cho & Chang, Citation2017). Reconfigured conceptualizations of vulnerability across different disciplines have resulted in limited consensus (Salami et al., Citation2017), as well as a lack of agreement on operationalisation (Wolf et al., Citation2013). The IPCC (Intergovernmental Panel on Climate Change) notion of vulnerability is a commonly referenced framework in climate change studies (Salas & Yepes, Citation2018). The definition merges not only susceptibility of systems, but also exposure of external hazards and adaptive capacity or coping of systems.
Urban vulnerability is a relatively new notion in the literature, evolving much like the concept of the urban itself (Krellenberg et al., Citation2016). Urbanisation factors have been linked to increasing vulnerability in cities and amongst populations, particularly the urban poor, prompting a focus on urban contexts in recent years (Baker, Citation2012; Salami et al., Citation2017). Urbanisation processes and the urban context provide additional facets through which complex and integrated interactions can be explored to understand, explain, and measure vulnerability in various spatial–temporal dimensions. Fang et al. (Citation2016) define urban vulnerability as the ‘coping capacity to resist multiple aspects of disturbances from various internal and external natural and human factors,’ (p.156) and incorporate resource, eco-environmental, economic, and social vulnerabilities of the urban context within its conceptualisation. This definition offers a multi-dimensional approach to understand vulnerability involving stressors, which are not limited to biophysical or climate-related hazards (Räsänen et al., Citation2016).
Guided by this definition, two broad dimensions nested within urban vulnerability can be differentiated: environmental and social dimensions. Environmental vulnerability deals with the coping capacity to external natural disturbances, and social vulnerability evaluates the different coping capacity caused by the society operation. In general, social vulnerability acknowledges the impact of external exposures, but emphasises the roles of social, political, economic, and institutional contextual factors on various spatial and temporal scales (Eriksen et al., Citation2008). Similar to the IPCC definition, social vulnerability often includes the aspect of capacity to cope with and adapt to the urban environment (Lee, Citation2014). Therefore, the factors which influence social vulnerability can work to reduce or increase vulnerability depending on coping or adaptation capacities of systems. Along these lines, social vulnerability can be argued to be the humanistic dimension of urban vulnerability in the same way as it constitutes more general forms of vulnerability.
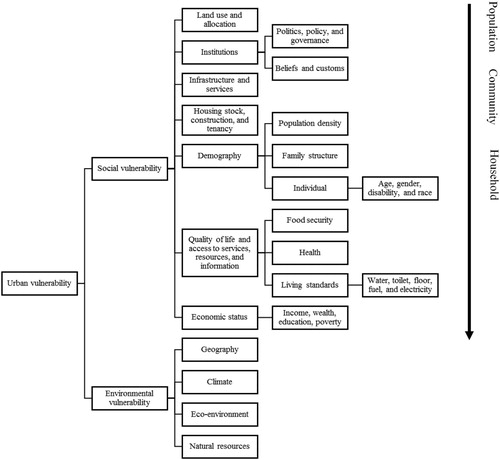
presents a simple representation of the relationships between urban, environmental, and social vulnerability and the factors which influence them. Urban vulnerability is a broader concept for analysing urban dynamics caused by both external and internal factors, while social vulnerability represents a subset of urban vulnerability and emphasises different social units’ (e.g. population, community, or household) coping capacities within the same social-economic structure. For example, factors such as institutions work in different ways to enable coping and adaptation or intensify and activate vulnerability for different social units. It is important to note that social, environmental, urban vulnerability are not dependent on multiple isolated factors but linked by complex and variegated interactions between multiple factors.
Figure 1. Urban vulnerability vs. environmental vulnerability vs. social vulnerability.
2.2. Factors related to social vulnerability
The commonly referenced paper by Cutter et al. (Citation2003), which operationalises social vulnerability factors to environmental hazards, may serve as a starting point to explore factors related to social vulnerability in the urban system. Categories of factors outlined in the paper include (1) demographic factors such as gender, age, race, (2) socio-economic status such as income, political power, personal wealth, (3) housing quality and tenancy, (4) density of the built environment, and (5) infrastructure dependence and access to services, among others. Land use, population growth and density, access to property, and urban governance are additional factors emerging from the notion of urban vulnerability (Krellenberg et al., Citation2016).
Although demographic factors such as age, gender, and race are suggested to influence social vulnerability, results from vulnerability studies are not straightforward. For example, women are generally considered to be a vulnerable demographic (Quarantelli, Citation2003). Dodman et al. (Citation2017) suggest women may face more challenges such as gender norms or differences in rural/urban culture of women’s rights, earn less than males (Cutter et al., Citation2003; Beyer et al., Citation2016) and have greater family care responsibilities (Fernandez et al., Citation2016). This is the case in Dar es Salaam as well (Eriksen et al., Citation2005). While Blumenberg (Citation2004) finds that low-income females are more vulnerable in U.S. cities, some empirical studies suggest female heads of household show no impacts on vulnerability, especially if they are of middle to upper class economic status (Rufat et al., Citation2015). Therefore, demographic factors alone are not necessarily sufficient to indicate social vulnerability.
Socio-economic characteristics are widely accepted individual and household level social vulnerability factors (Pelling, Citation2002), however, also depend on other factors. For example, in Dar es Salaam and other African cities, low-income households with certain demographic characteristics, such as a high number of family members and children are linked to greater vulnerability (Dodman et al., Citation2011; UN Habitat, Citation2015). Low-income households could lead to low or no education of children (Beyer et al., Citation2016). Wealthy households likely have better access to resources, including food, water, transportation, and education (Eriksen et al., Citation2008; Ebert et al., Citation2009; Lawal & Arokoyu, Citation2015; Rufat et al., Citation2015; Beyer et al., Citation2016; Dodman et al., Citation2017). At the same time, not all poor populations are vulnerable to factors such as food insecurity (Bohle et al., Citation1994). Moser (Citation1996) suggests the possession of tangible and intangible assets (labour, human capital, productive assets, household relations, and social capital) as well as the ‘ability to transform those assets into food, or other basic necessities’ (p.2) are a form of resilience to vulnerability and reduce the effects of threats.
Furthermore, at the household level, Tipple (Citation2005) suggests quality of housing construction and infrastructure, location (slope), and regulation, linked with affordable and available land supply, are factors impacting social vulnerability. Wealthier populations are able to afford better constructed homes with sturdy material to withstand environmental hazards (Cutter et al., Citation2003; Flanagan et al., Citation2011). Dodman et al. (Citation2011) note these characteristics in Dar es Salaam as well, particularly in relation to increased vulnerability to floods. Although poor populations are often cited as the most vulnerable in terms of housing construction (Few, Citation2003; Nuwagaba, Citation2003; Baker, Citation2012), scholars have noted they are not always the most vulnerable groups when faced with hazards (Pelling, Citation2002; Eriksen et al., Citation2008) due to strong social networks as well as development of adaptation and coping methods from experiences. More importantly, wealthy households may be more attracted to housing in environmentally unstable areas (e.g. coastal) (Bagstad et al., Citation2007).
Community level characteristics are also commonly referenced aspects of vulnerability. Population density can play a role in producing social vulnerabilities (Abson et al., Citation2012). For example, although more dense areas are likely to have infrastructure and services because of high demand, at the same time, traffic and crowding may reduce mobility, especially in situations in which evacuation is required. Crowding has also been linked to reduced quality of life (Lawal & Arokoyu, Citation2015).
At a broader scale, several factors are proposed to influence vulnerability in the literature, such as politics, governance, and cultural institutions, as well as built environment characteristics. Institutional factors may contribute to positive adaptation ability of societies or intensify vulnerability and lack of coping or adaptation (Kelly & Adger, Citation2000; Tipple, Citation2005; Krellenberg et al., Citation2016). For example, urban development policies and programmes shape urban settlement patterns, guide aspects of tenure security, economic development, infrastructure development, and service provision in cities (Porio, Citation2011). On the other hand, the legacy of colonial institutions, for instance, have been shown to produce vulnerable marginalised communities and populations with reduced coping capacity (Kironde, Citation2000). Civil society groups have also shown to aid or influence coping or adaptation of population groups to hazards (Herslund et al., Citation2016).
Lastly, land use is considered a broad scale factor of urban vulnerability (Krellenberg et al., Citation2016). Informal land use raises added challenges in vulnerability studies, especially within conditions of rapid urbanisation in African cities. For example, informal housing in urban areas has been observed to be located in hazardous areas and linked to poverty and limited coping (Pauleit et al., Citation2015). Populations in urban areas tend to suffer the consequences of variations in quality or lack of infrastructure. In informally developed areas in Dar es Salaam, basic services and transportation costs are higher, and the lack of formal tenure security reduces investment in spaces (Hill & Linder, Citation2011). Furthermore, enforcement of adaptive policies to hazards or risks are a challenge in informal or unplanned urban areas (Kiunsi, Citation2013; Mutanga & Mwiruki, Citation2013).
2.3. Social vulnerability index
Quantifying indicators or factors has been a significant challenge in the assessment of social vulnerability (Mavhura et al., Citation2017). A common approach is the construction of a social vulnerability index. There are three main types of indices: deductive, hierarchical, and inductive (Tate, Citation2012; Coulibaly et al., Citation2015; Reckien, Citation2018). To create a deductive index, selected indicators are normalised and aggregated with or without weighting variables (Ebert et al., Citation2009; Eguaroje et al., Citation2015; Danumah et al., Citation2016). A hierarchical index is a large system consisting with many sub-indices of different categories. An inductive index is produced by a principle component analysis approach to reduce a large group of correlated factors. Although there are recognised issues and limitations with the index approaches (Lankao & Qin, Citation2011; Fernandez et al., Citation2016), as well as with the aggregation of the indicators into a composite index (Jones & Andrey, Citation2007), indices are commonly utilised and can be readily interpreted by policy makers and decision makers.
2.4. Planning, Sprawl, and Vulnerability in Tanzania
Land in Tanzania was nationalised in 1967 and is allocated administratively, making the sale of land illegal (Briggs & Mwapfupe, Citation1999; Kombe, Citation1994). However, land allocation standards and administrative systems put in place to manage land and planning have been recognised as inadequate, impractical, and unable keep up with the demand of the growing population (Briggs & Mwapfupe, Citation1999; Kironde, Citation2006). These inadequacies of planning and government administration opened the way for unregulated, informal land markets to thrive and constitute many of the land transactions (Kironde, Citation2006; Hill et al, Citation2014). Over 70% of residents in Tanzania live in informal areas, one of the highest percentages in Sub-Saharan Africa (Kombe & Kreibich, Citation2006; Rasmussen, Citation2013).
With insecure land tenure and lack of practical land use plans, urban sprawl becomes a pressing issue. There is an increasing amount of empirical evidence of urban sprawl in Tanzania, with observed built-up area expanding much faster than population growth (Mkalawa & Haixiao, Citation2014; Congedo & Macchi, Citation2015; Mkalawa, Citation2016; Bhanjee & Zhang, Citation2018). Kombe (Citation2005) further argues for the role of poverty in driving changes in the built environment, which includes spatial expansion to meet affordable housing needs (Andreasen et al., Citation2017; Briggs & Mwapfupe, Citation1999). Urban sprawl in Tanzania is different from that of western countries because residents of sprawled areas do not necessarily live in these areas out of choice or preferences, but because of the lack of choices in housing and lack of access in other areas closer to the urban centre (Kironde, Citation2006; Mkalawa, Citation2016).
Urban sprawl directly causes environmental degradation and affects the livelihoods of people. Vulnerability assessments using diverse approaches are present in the Tanzania context and literature, however, most of the available studies focus on environmental vulnerability (Congedo et al., Citation2013; Hambati, Citation2013; Hambati & Gaston, Citation2015; Kebede & Nicholls, Citation2012; Mutanga & Mwiruki, Citation2013). For instance, Congedo & Macchi (Citation2015) compared 2002–2011 land cover changes with 2002–2012 population growth in Dar es Salaam and argued for a relation between urban sprawl and climate vulnerability. Mutanga & Mwiruki (Citation2013) evaluated Dar es Salaam’s adaptive capacity with the increasing frequency of floods. They found administrative support in place, but a lack of technical and financial ability for the implementation process.
There are two main gaps in the existing literature. First, few studies explored social vulnerability in a complete urban setup. For example, Sarris & Karfakis (Citation2006) adopted an economic strategy, linking vulnerability to the probability of poverty of a household and evaluated household vulnerability status. However, their study only focused on rural Tanzania. Dodman et al. (Citation2011) discussed the varying coping capacity in dealing with risk and called for a broader framework for analysing vulnerability. Andreasen & Moller-Jensen (Citation2017) explored the dependent relation of livelihood on mobility based on data collected from semi-structured interviews of suburban residents of Dar es Salaam. There is a lack of social vulnerability analysis inclusive of unplanned/informal areas and sprawl at a small scale. In addition, it is important to include institutional factors, such as planning and governance, which have low representation in the urban vulnerability literature in general (Cho & Chang, Citation2017).
Further, most of the available literature followed a qualitative strategy, and/or used GIS mapping methods and remote sensing techniques (Sarris & Karfakis, Citation2006; Lyimo & Kangalawe, Citation2010; Dodman et al., Citation2011; Kebede & Nicholls, Citation2012; Mutanga & Mwiruki, Citation2013; Congedo & Macchi, Citation2015; Hambati & Gaston, Citation2015; Bhanjee & Zhang, Citation2018). These studies successfully revealed the existence and the status of vulnerability issues in Tanzania. However, they have limited contribution towards understanding what factors cause vulnerability issues, and how to quantify the effects of these factors. In this sense, a regression analysis could contribute toward a more comprehensive understanding of urban vulnerability in the Tanzania context. To our knowledge, there are very few quantitative analyses of urban vulnerability. Sarris & Karfakis (Citation2006) and Mutabazi et al. (Citation2015) evaluated vulnerability based on agriculture productivity and income poverty, respectively. Both studies focused on rural areas.
3. Research questions
To address the gaps in the literature, this study aims to develop a social vulnerability assessment which quantitatively incorporates urban planning related processes (i.e. land use, informal development) in addition to social and economic factors specifically in the Sub-Saharan African context. In other words, it aims to quantitatively determine whether urban planning and land use factors significantly contribute to or influence social vulnerability in African cities and if so, for stakeholders to consider incorporating these broader scale factors in future studies for more comprehensive social vulnerability assessment. Two main research questions frame the study: (1) does urban planning reduce social vulnerability and (2) does urban sprawl contribute to social vulnerability? Three hypotheses stem from these research questions.
Hypothesis 1: Planned urban areas are less socially vulnerable than informally developed urban areas. This hypothesis proposes that urban planning is an important factor which reduces social vulnerability and unplanned or informal areas are more socially vulnerable. Urban planning activities are expected to optimise infrastructure and service land uses, and planned areas are also more likely to have tenure security and better housing structure (Richmond et al., Citation2018). Therefore, the variable of planning encompasses multidimensional factors useful for social vulnerability assessment in the African urban context.
Hypothesis 2: Sprawled areas have higher social vulnerability than non-sprawled areas, i.e. urban sprawl intensifies social vulnerability. This second hypothesis draws from the literature which argues that sprawl has costs, including the destruction of the natural environment and agricultural land, various forms of pollution, poor sanitation and decreased services, increased commuting, traffic congestion, and low-density housing. Economically, sprawl has been suggested to contribute to high energy consumption and increasing energy costs, land market inefficiencies, high costs of services, high transportation costs, and increases in land prices and land speculation (Cobbinah & Amoako, Citation2012). Furthermore, in the African context, sprawled areas are likely to be areas where poorer populations live (Dodman et al., Citation2017). In this sense, urban sprawl, like urban planning, encompasses various social, spatial, and economic factors within this one indicator, and may be a useful multi-dimensional indicator of social vulnerability.
Hypothesis 3: Planned sprawl areas are less socially vulnerable than informally developed sprawl areas. The third hypothesis essentially posits that planned urban sprawl is less vulnerable than unplanned urban sprawl. The difference between this hypothesis and the previous one is the results of this hypothesis allow for a more specific analysis of urban sprawl contributions to social vulnerability. Whereas urban sprawl and urban planning measured separately may be useful indicators of social vulnerability, the combination of informal development and sprawl may provide some insights into compounding negative effects.
4. Study area and data collection
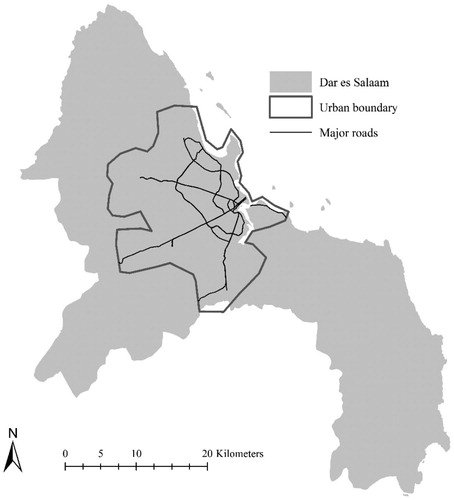
Dar es Salaam, Tanzania was selected for this study because of its location as a growing coastal city in the sub-Saharan Africa region as well as the availability of openly sourced data such as urban land use with informal settlement data. It is a city urbanising faster than planning and has kept up in terms of influx of rural-urban migrants, population growth, as well as spatial expansion of the urban areas over the past 40 years (Hambati & Gaston, Citation2015). High demand for housing and low-density unplanned expansion in Dar es Salaam combined with lack of infrastructure and services have been noted to increase social vulnerabilities such as reduced quality of life, mobility, and access to the city and services (Andreasen, & Møller-Jensen, Citation2017; Andreasen et al., Citation2017; Dodman et al., Citation2017). presents the selected urban study area within the greater city administrative boundary. The urban study area (urban boundary) is consolidated based on 2002 administrative ward unit boundaries where social-economic data is available.
Figure 2. Study area.
Social, demographic, and economic data at the household level were obtained from the 2015–16 Tanzania Demographic and Health Survey and Malaria Indicator Survey (2015–16 TDHS-MIS). Each household in the survey was associated with a spatial cluster consisting of up to 22 households per cluster (31 clusters total in the study area). Along with survey data, GPS data of the survey clusters were provided for download, which allowed for spatial analysis and mapping.
For population data, the Global Human Settlements (GHS) programme of the European Commission population raster data were downloaded for Dar es Salaam at the 250 m scale for the year 2015 (Pesaresi et al., Citation2013). Road data were downloaded as a shapefile from mapcruzin.com to assess a measure of access to transportation and a road network. The mapcruzin data is based off road data from openstreetmap.org, a collective web-based mapping network supported by various institutions and organisations, including several universities. It is important to note the downloaded roads were not as comprehensive as the source openstreetmap.org, but were deemed sufficient for the analysis.
Urban land use data with informal settlements as well as planned residential areas for the years 1982, 1992, and 2002 were downloaded from the Socioeconomic Data and Application Center (SEDAC) website, affiliated with Columbia University and NASA (Šliužas, Citation2004). The 2014 urban land use data were estimated based on previous land use, built up area proportion, road distance and density, as well as slope, among others.
The central business district (CBD) in Dar es Salaam is considered in this paper to be the city centre, which is selected. To measure sprawl, the central business district (CBD) point was selected and mapped in order to measure distance from each data point in the study area to the CBD. Since there was no predefined central business district point to base the measurement from, a point in the centre of the area identified as the greater business district by google maps was selected and mapped.
Guided by , presents a final list of the indicators/variables selected and calculated from the above data sources for further social vulnerability analyses. Variables created from the 2015–16 TDHS-MIS survey were grouped into three categories: quality of life, economic status, and demographic attributes. These variables are at the household scale. Quality of life variables include living standard factors, food security and access to services and resources. Due to limited economic variables available in survey data, two proxy variables were selected: education level and bank account. A household with a bank account indicates potentiality to secure a loan and considered to be less vulnerable than storing cash at home (Tipple, Citation2005). Similarly, a household with higher and education level usually indicates a higher level of economic status (Lawal & Arokoyu, Citation2015; Rufat et al., Citation2015). In terms of demographic variables, number of children under the age of 5, number of household members, gender of the head of household, and age of the head of the household were selected.
Table 1. Variable dictionary.
In addition, four urban planning and built environment variables – population density, distance to roads (access), sprawl, and planning dummy variables were calculated in ArcGIS as factors which influence social vulnerability on the larger urban scale. Population density was calculated as the number of people within a 250m2 cell averaged by cluster of the study area. Distances to roads were the distances from each data point to the closest major road within a 1 km radius and averaged by cluster. Urban planned residential areas were calculated and coded as 0 if the majority of a cluster had unplanned residential land use and 1 if the majority of a cluster had planned residential land use. Lastly, a sprawl dummy was calculated based on the distance to the CBD for each observation in relation to the median distance. For each ward unit, if the distance to the CBD was greater than the median distance of all wards, it was considered sprawled and coded as 1. All other points within the median distance were considered to be part of the main city and coded 0.
5. Principal component analyses
The household social variables were expected to be highly correlated. This presented a challenge for further regression analyses. In addition, it was more difficult to provide meaningful interpretations if all the variables were directly used in regression analyses. Therefore, principal component analyses (PCA) were performed in SPSS to reduce the number of social variables. presents the results. The variables within these components were recoded from the original survey to be in the form of most to least vulnerable for ease of interpretation before the PCA. For instance, the lower scale of source of drinking water were unimproved sources such as unprotected surface water and the higher end sources were piped water in the yard or home. In this sense, a higher value meant less vulnerable.
Table 2. PCA results of social variables.
The first component indicated general quality of life (QOL). It was heavily loaded by variables related to a household’s basic needs such as clean water, sanitation, food security, electricity, and sturdy housing structure. All the variables were positively loaded into this component, with higher QOL value indicating better sources of drinking water, electricity, sanitation facility, housing floor material, and food security, i.e. better quality of life.
The second component was positively loaded by variables related to mobility and connectivity, and constituted a household’s mobility (MOB) component. It indicated the ability of individuals within the household to physically move around the city (bicycle and automobile) as well as have access to information and resources which would enable mobility (phone and radio). Higher MOB values were associated with higher level of mobility and lower social vulnerability.
6. Descriptive statistics
Descriptive statistics for the complete set of variables are in . The household social vulnerability variables (QOL and MOB) were normalised by the PCA. The mean of the PLAN dummy was 0.188, indicating that only 18.8% of the development are planned and majority were unplanned or informal.
Table 3. Descriptive statistics of all variables.
presents correlation coefficients between variables. Correlations between the PCA component variables (QOL and MOB) and economic status (EDU and BANK) are positive and significant at the 1% significance level. This is in line with the literature linking dimensions of accessibility (mobility), housing quality (quality of life), and socioeconomic status with social vulnerability in similarly associated patterns (Lawal & Arokoyu, Citation2015; Rufat et al., Citation2015). The strongest correlations for quality of life (QOL) were mobility (MOB), education (EDU), bank account (BANK), population density (DEN) and distance to roads (DISR). For mobility (MOB), the strongest correlations were education (EDU), bank account (BANK), and population density (DEN).
Table 4. Correlation coefficients.
No significant correlations resulted from the urban sprawl variable (S) with each of the social variables. This suggested sprawl as a variable on its own did not significantly correlate with social vulnerability variables, however, there was a chance it would be a useful variable when other factors were present. For the urban planning variable (PLAN) there was a significant relation (at the 5% significance level) only with quality of life (QOL) but not mobility (MOB). The significant positive relationship suggested planning may contribute to improved quality of life. This supported the first hypothesis, however further analysis was required to understand the relationships between all selected variables.
7. Regression analyses
Further regression analyses of QOL and MOB were utilised to explore the hypotheses. Two simple linear regression models were set up, as:
(1)
(1)
(2)
(2) where X, Y were two sets of control variables. IFOR is an informal dummy variable, with IFOR = 1 for informal development and = 0 otherwise. The PLAN dummy was used to assess Hypothesis 1 about whether planning helps in reducing social vulnerability. The dummy variable S was to assess the role of urban sprawl, i.e. Hypothesis 2. The two interaction variables (PLAN*S, IFOR*S) were to assess how urban sprawl interacts with planned and informal development, and to address Hypothesis 3.
Regression results are shown in . Planning and sprawl, as well as the interaction variables, were the variables of interest to address the hypothesis. Additional economic, demographic, and infrastructure variables were used as control variables.
Table 5. Final linear regression models for quality of life and mobility.
The estimates of control variables generally align with expectations. Greater level of education (proxy for economic status) have significant and positive impacts on both quality of life and mobility, suggesting that education helps in increasing the accessibility to infrastructure, services, and resources and therefore, is linked with decreased social vulnerability. The studies of Sarris & Karfakis (Citation2006) and Mutabaze et al. (Citation2015) did not suggest education as a significant determinant for household vulnerability. However, both studies focused on rural areas, rather than cities. This result is consistent with the available empirical evidences of better economic status factors related to better life quality and mobility, while the poor in Dar es Salaam generally have more difficulty in accessing basic services (Olvera et al., Citation2003). Another economic variable is BANK, having a bank account. It is positive but not significant for either model. This result is consistent with the existing literature (Sarris & Karfakis, Citation2006).
For demographic variables, number of household members (HHN) has a significantly positive impact in both models, implying more members are related to better quality of life and mobility. This is consistent with the results of Mutabazi et al. (Citation2015), who found that increasing household size reduced the vulnerability related to income poverty, especially for the households within the lowest income quartile. Further, Sarris & Karfakis (Citation2006) found that a higher dependency ratio leads to a lower level of productivity, which is consistent with our results. Having fewer young children in the household (CHILD5), i.e. higher level of dependency ratio, is linked with better quality of life.
The mobility model suggests that households with older heads (AGE) have greater mobility. Households with male heads (GENDER) are significantly linked with better mobility, but not quality of life. This result supports existing observations in Dar es Salaam of men being more mobile than women, as women tend to be responsible for household duties (Olvera et al., Citation2003). Sarris & Karfakis (Citation2006) drew a similar conclusion about the impact of gender on economic productivity. Both higher quality of life and better mobility are significantly related to a lower population density, suggesting lower population density is linked with reduced social vulnerability, as expected.
Distance to primary and secondary roads (DISR) has a negative impact in mobility model, suggesting the closer to the road network the higher the mobility. However, this impact is not significant. The quality of life model suggests that the farther away from the major roads, the higher the quality of life, and this effect is significant at the 10% level. This makes sense, because local roads or local means of travel (walking/public transportation), rather than major roads, are more relevant for residents’ daily life (Mkalawa & Haixiao, Citation2014). Furthermore, Mkalawa (Citation2016) notes most people in Dar es Salaam do not own vehicles and the transportation system has not kept up with urban population growth, even in wealthy areas (Olvera et al., Citation2003). In this sense, being located adjacent to this major transportation infrastructure may not improve quality of life for most urban residents.
summarises the factors that significantly affect quality of life and mobility, including the hypothesised variables. For the results of the first hypothesis (urban planning), the models suggest planned development in Dar es Salaam significantly improves quality of life and mobility. Relationships between quality of life and availability of urban planned infrastructure and services are supported in the literature (Andreasen, & Møller-Jensen, Citation2017). Because major aspects of planning include infrastructure and service provision, connections between planning and quality to basic services, food security, and mobility are fitting.
Table 6. Factors significantly affecting quality of life and mobility.
As for the second hypothesis about whether sprawl affects quality of life and mobility, the sprawl dummy variable (S) has a negative, but insignificant impact in both models. Nevertheless, the two interaction variables reveal that sprawl interacts differently with planned and informal development. Planned sprawl (PLAN*S) has a positive, but not significant impact on quality of life and mobility. Informal sprawl (IFOR*S) has a significant and negative impact, supporting the third hypothesis. Informally developed sprawl areas have lower quality of life and mobility. This can be explained by the known limitations in infrastructure and services in peripheral areas of Dar es Salaam (Dodman et al., Citation2011).
8. Conclusion
This study proposed three hypotheses related to urban social vulnerability incorporating urban planning factors (land use and sprawl) in social vulnerability assessment. Dar es Salaam was a particularly relevant study area because of the significant informal land use development, sprawl, and dataset availability to test the impact of these variables. The study further aimed to enhance social vulnerability measurement by utilising reliable existing open data sources in scholarly research when data is often difficult to source or obtain from other channels. Also, separating social vulnerability into two models (quality of life and mobility) guided by the PCA allowed for a more targeted assessment of variable influence.
Results suggest, in Dar es Salaam, planning is a significant predictor for the aspect of quality of life and mobility, while sprawl is not a significant predictor for both. However, sprawl interacts with informal and planned development in different ways to affect urban residents’ quality of life and mobility. Only areas with informally developed sprawl are significantly linked with lower quality of life and mobility, meaning greater social vulnerability. Another crucial result is the strength of the interrelations between the main social vulnerability factors (quality of life and mobility) and economic status, suggesting these major characteristics are important for improving social vulnerability, regardless of planning, sprawl, or any other factors.
Planning and sprawl could be important variables to incorporate in quantitative social vulnerability assessments as a means (1) to measure the influence of broad scale urban factors on the local scale, and (2) to contribute toward more inclusive and wide-ranging local assessment than currently exists in the literature. Improved social vulnerability assessments at the local scale could be utilised by planners and stakeholders, for example, to better understand contextual nuances and enable more targeted approaches to reduce or prevent vulnerabilities of urban residents. Significant results in this study suggest these variables may be worthwhile to consider in future quantitative assessments of other Sub-Saharan cities and contexts, especially growing cities such as Dar es Salaam.
Acknowledgements
This work is part of the Ph.D. dissertation of Bhanjee (Citation2019). Dr Sumei Zhang chaired the dissertation committee. We thank Dr David Simpson, Dr Margath Walker, Dr Alex Awiti, and the two anonymous reviewers for their constructive suggestions and comments.
Disclosure statement
No potential conflict of interest was reported by the author(s).
References
- Abson, DJ, Dougill, AJ & Stringer, LC, 2012. Using principal component analysis for information-rich socio-ecological vulnerability mapping in Southern Africa. Applied Geography 35(1-2), 515–24.
- Adelekan, I, Johnson, C, Manda, M, Matyas, D, Mberu, B, Parnell, S, Pelling M, Satterthwaite D, Vivekananda, J, 2015. Disaster risk and its reduction: An agenda for urban Africa. International Development Planning Review 37(1), 33–43.
- Andreasen, MH & Møller-Jensen, L, 2017. Access to the city: Mobility patterns, transport and accessibility in peripheral settlements of Dar es Salaam. Journal of Transport Geography 62, 20–9.
- Andreasen, MH, Agergaard, J & Møller-Jensen, L, 2017. Suburbanisation, homeownership aspirations and urban housing: Exploring urban expansion in Dar es Salaam. Urban Studies 54(10), 2342–59.
- Bagstad, KJ, Stapleton, K & D'Agostino, JR, 2007. Taxes, subsidies, and insurance as drivers of United States coastal development. Ecological Economics 63(2-3), 285–98.
- Baker, JL (Ed.). 2012. Climate change, disaster risk, and the urban poor: Cities building resilience for a changing world. World Bank Publications, Washington, DC.
- Beyer, LI, Chaudhuri, J & Kagima, B, 2016. Kenya's focus on urban vulnerability and resilience in the midst of urban transitions in Nairobi. Development Southern Africa 33(1), 3–22.
- Bhanjee, S, 2019. Urban (Un)planning and social vulnerability in the context of rapid urbanization and data constraints: A quantitative study of Dar Es Salaam, Tanzania. Doctoral Dissertation, University of Louisville.
- Bhanjee, S & Zhang, CH, 2018. Mapping latest patterns of urban sprawl in Dar es Salaam, Tanzania. Papers in Applied Geography 4(3), 292–304.
- Blumenberg, E, 2004. En-gendering effective planning: Spatial mismatch, low-income women, and transportation policy. Journal of the American Planning Association 70(3), 269–81.
- Boamah, EF & Walker, M, 2017. Legal pluralism, land tenure and the production of “nomotropic urban spaces” in post-colonial Accra, Ghana. Geography Research Forum 36, 86–109.
- Bohle, HG, Downing, TE & Watts, MJ, 1994. Climate change and social vulnerability: Toward a sociology and geography of food insecurity. Global environmental change 4(1), 37–48.
- Borel-Saladin, J, Shifa, M & Donald, A, 2018. 4 Understanding and addressing poverty, labour force, and urbanisation data gaps in sub-Saharan Africa. Urban Food Systems Governance and Poverty in African Cities, 68.
- Briggs, J & Mwamfupe, D, 1999. The changing nature of the peri-urban zone in Africa: Evidence from Dar-es-Salaam, Tanzania. Scottish Geographical Journal 115(4), 269–82.
- Cho, SY & Chang, H, 2017. Recent research approaches to urban flood vulnerability, 2006–2016. Natural Hazards 88(1), 633–49.
- Cobbinah, PB & Amoako, C, 2012. Urban sprawl and the loss of peri-urban land in Kumasi, Ghana. International Journal of Social and Human Sciences 6(388), e397.
- Congedo, L & Macchi, S, 2015. The demographic dimension of climate change vulnerability: Exploring the relation between population growth and urban sprawl in Dar es Salaam. Current Opinion in Environmental Sustainability 13, 1–10.
- Congedo, L, Munafò, M & Macchi, S, 2013. Investigating the relationship between land cover and vulnerability to climate change in Dar es Salaam. Sapieza University, Rome.
- Coulibaly, JY, Mbow, C, Sileshi, GW, Beedy, T, Kundhlande, G & Musau, J, 2015. Mapping vulnerability to climate change in Malawi: Spatial and social differentiation in the Shire River Basin. American Journal of Climate Change 4(03), 282–94.
- Cutter, SL, Boruff, BJ & Shirley, WL, 2003. Social vulnerability to environmental hazards. Social Science Quarterly 84(2), 242–61.
- Danumah, JH, Odai, SN, Saley, BM, Szarzynski, J, Thiel, M, Kwaku, A, Kouame FK, Akpa, LY, 2016. Flood risk assessment and mapping in Abidjan district using multi-criteria analysis (AHP) model and geoinformation techniques (Cote d’ivoire). Geoenvironmental Disasters 3(1), 10.
- Dodman, D, Kibona, E & Kiluma, L, 2011. Tomorrow is too late: Responding to social and climate vulnerability in Dar es Salaam, Tanzania. Case study prepared for the Global Report on Human Settlements.
- Dodman, D, Leck, H, Rusca, M & Colenbrander, S, 2017. African urbanisation and urbanism: Implications for risk accumulation and reduction. International Journal of Disaster Risk Reduction 26, 7–15.
- Ebert, A, Kerle, N & Stein, A, 2009. Urban social vulnerability assessment with physical proxies and spatial metrics derived from air-and spaceborne imagery and GIS data. Natural Hazards 48(2), 275–94.
- Eguaroje, O, Alaga, T, Ogbole, J, Omolere, S, Alwadood, J, Kolawole, I, Muibi KH, Nnaemeka D, Popoola DS, Samson, S, Adewoyin JE, Jesuleye I, Badru RA, Atijosan A, Ajileye OO, 2015. Flood vulnerability assessment of Ibadan city, Oyo state, Nigeria. World Environment 5(4), 149–59.
- Eriksen, SH, Brown, K & Kelly, PM, 2005. The dynamics of vulnerability: Locating coping strategies in Kenya and Tanzania. The Geographical Journal 171(4), 287–305.
- Eriksen, S, O'Brien, K & Rosentrater, L, 2008. Climate change in Eastern and Southern Africa: Impacts, vulnerability and adaptation. GECHS Report, 2, Oslo, Norway, pp. 1–26.
- Fang, C, Wang, Y & Fang, J, 2016. A comprehensive assessment of urban vulnerability and its spatial differentiation in China. Journal of Geographical Sciences 26(2), 153–70.
- Fernandez, P, Mourato, S & Moreira, M, 2016. Social vulnerability assessment of flood risk using GIS-based multicriteria decision analysis. A case study of Vila Nova de Gaia (Portugal). Geomatics, Natural Hazards and Risk 7(4), 1367–89.
- Few, R, 2003. Flooding, vulnerability and coping strategies: Local responses to a global threat. Progress in Development Studies 3(1), 43–58.
- Flanagan, BE, Gregory, EW, Hallisey, EJ, Heitgerd, JL & Lewis, B, 2011. A social vulnerability index for disaster management. Journal of Homeland Security and Emergency Management 8(1), 1–22.
- Hambati, H, 2013. Weathering the storm: Disaster risk and vulnerability assessment of informal settlements in Mwanza city, Tanzania. International Journal of Environmental Studies 70(6), 919–39.
- Hambati, H & Gaston, G, 2015. Revealing the vulnerability of urban communities to flood hazard in Tanzania: A case of the Dar es Salaam city ecosystem. International Journal of Geospatial and Environmental Research 2(1), 3.
- Herslund, LB, Jalayer, F, Jean-Baptiste, N, Jørgensen, G, Kabisch, S, Kombe, W, Lindley, S, Nyed, PK, Pauleit, S, Printz, A, Vedeld, T, 2016. A multi-dimensional assessment of urban vulnerability to climate change in sub-Saharan Africa. Natural Hazards 82(2), 149–72.
- Hill, A & Lindner, C, 2011. Simulation informal urban growth in Dar es Salaam, Tanzania-A CA-based land-use simulation model supporting strategic urban planning. In Koch, A, & Mendl, P (Eds.), Modeling and simulating urban processes. LIT-Verlag, Munste, pp. 77–98.
- Hill, A, Hühner, T, Kreibich, V & Lindner, C, 2014. Dar es Salaam, megacity of tomorrow: Informal urban expansion and the provision of technical infrastructure. In Kraas, F, Aggarwal, S, Coy, M & Mertins, G (Eds.), Megacities. International year of planet earth. Springer, Dordrecht, pp. 165–77.
- Jones, B & Andrey, J, 2007. Vulnerability index construction: Methodological choices and their influence on identifying vulnerable neighbourhoods. International Journal of Emergency Management 4(2), 269–95.
- Kebede, AS & Nicholls, RJ, 2012. Exposure and vulnerability to climate extremes: Population and asset exposure to coastal flooding in Dar es Salaam, Tanzania. Regional Environmental Change 12(1), 81–94.
- Kelly, PM & Adger, WN, 2000. Theory and practice in assessing vulnerability to climate change and facilitating adaptation. Climatic Change 47(4), 325–52.
- Kelman, I, Gaillard, JC, Lewis, J & Mercer, J, 2016. Learning from the history of disaster vulnerability and resilience research and practice for climate change. Natural Hazards 82(S1), 129–43.
- Kironde, JL, 2000. Understanding land markets in African urban areas: The case of Dar es Salaam, Tanzania. Habitat International 24(2), 151–65.
- Kironde, JL, 2006. The regulatory framework, unplanned development and urban poverty: Findings from Dar es Salaam, Tanzania. Land Use Policy 23(4), 460–72.
- Kiunsi, R, 2013. The constraints on climate change adaptation in a city with a large development deficit: The case of Dar es Salaam. Environment and Urbanization 25(2), 321–37.
- Kombe, JW, 1994. The demise of public urban land management and the emergence of informal land markets in Tanzania: A case of Dar-es-Salaam city. Habitat International 18(1), 23–43.
- Kombe, WJ, 2005. Land use dynamics in peri-urban areas and their implications on the urban growth and form: the case of Dar es Salaam, Tanzania. Habitat International 29(1), 113–35.
- Kombe, WJ & Kreibich, V, 2006. Governance of informal urbanisation in Tanzania. Mkuki na Nyota Publishers, Dar es Salaam.
- Krellenberg, K, Welz, J, Link, F & Barth, K, 2016. Urban vulnerability and the contribution of socio-environmental fragmentation: Theoretical and methodological pathways. Progress in Human Geography 41(4), 1–24.
- Lankao, PR & Qin, H, 2011. Conceptualizing urban vulnerability to global climate and environmental change. Current Opinion in Environmental Sustainability 3(3), 142–9.
- Lawal, O & Arokoyu, SB, 2015. Modelling social vulnerability in sub-Saharan West Africa using a geographical information system. Jàmbá: Journal of Disaster Risk Studies 7(1), 1–11.
- Lee, Y-J, 2014. Social vulnerability indicators as a sustainable planning tool. Environmental Impact Assessment Review 44, 31–42.
- Lyimo, JG & Kangalawe, RY, 2010. Vulnerability and adaptive strategies to the impact of climate change and variability. The case of rural households in semi-arid Tanzania. Environmental Economics 1(Iss. 2), 89–97.
- Mavhura, E, Manyena, B & Collins, AE, 2017. An approach for measuring social vulnerability in context: The case of flood hazards in Muzarabani district, Zimbabwe. Geoforum; Journal of Physical, Human, and Regional Geosciences 86, 103–117.
- Mkalawa, CC, 2016. Analyzing Dar es Salaam urban change and its spatial pattern. International Journal of Urban Planning and Transportation 31(1), 1138–50.
- Mkalawa, CC & Haixiao, P, 2014. Dar es Salaam city temporal growth and its influence on transportation. Urban, Planning and Transport Research 2(1), 423–46.
- Moser, C, 1996. Confronting crisis: A summary and household responses to poverty and vulnerability in four poor urban communities. Banco Mundial.
- Mutabazi, KD, Sieber, S, Maeda, C & Tscherning, K, 2015. Assessing the determinants of poverty and vulnerability of smallholder farmers in a changing climate: The case of Morogoro region, Tanzania. Regional Environmental Change 15(7), 1243–58.
- Mutanga, SS & Mwiruki, B, 2013. Managing vulnerability to climate extremes in Africa: Some policy insights into frequent flooding in Dar es Salaam, Tanzania.
- Nuwagaba, A, 2003. Urban poverty and environmental health: The case of Kampala city, Uganda. In Kwesi Darkoh, MB & Rwomire, A (Eds.), Human impact on environment and sustainable development in Africa-contemporary perspectives on developing societies. Ashgate Publishers, Hampshire, 403–28.
- Olvera, LD, Plat, D & Pochet, P, 2003. Transportation conditions and access to services in a context of urban sprawl and deregulation. The case of Dar es Salaam. Transport Policy 10(4), 287–98.
- Pauleit, S, Coly, A, Fohlmeister, S, Gasparini, P, Jørgensen, G, Kabisch, S, Kombe, WJ, Lindley, S, Simonis, I, Yeshitela, K, 2015. Urban vulnerability and climate change in Africa. Future City, 4.
- Pelling, M, 2002. Assessing urban vulnerability and social adaptation to risk: Evidence from Santo Domingo. International Development Planning Review 24(1), 59–76.
- Pesaresi, M, Huadong, G, Blaes, X, Ehrlich, D, Ferri, S, Gueguen, L, Halkia, M, Kauffmann, M, Kemper, T, Lu, L, Marin-Herrera, MA, Ouzounis, GK, Scavazzon, M, Soille, P, Syrris, V, Zanchetta, L, 2013. A global human settlement layer from optical HR/VHR RS data: Concept and first results. IEEE Journal of Selected Topics in Applied Earth Observations and Remote Sensing 6(5), 2102–31.
- Porio, E, 2011. Vulnerability, adaptation, and resilience to floods and climate change-related risks among marginal, riverine communities in Metro Manila. Asian Journal of Social Science 39(4), 425–45.
- Quarantelli, EL, 2003. Urban vulnerability to disasters in developing countries: Managing risks. Building Safer Cities, 211.
- Räsänen, A, Juhola, S, Nygren, A, Käkönen, M, Kallio, M, Monge, AM & Kanninen, M, 2016. Climate change, multiple stressors and human vulnerability: A systematic review. Regional Environmental Change 16(8), 2291–302.
- Rasmussen, MI, 2013. The power of the informal settlements–the case of Dar es Salaam, Tanzania. Planum—the Journal of Urbanism 1, 26.
- Reckien, D, 2018. What is in an index? Construction method, data metric, and weighting scheme determine the outcome of composite social vulnerability indices in New York city. Regional Environmental Change 18, 1439–51.
- Richmond, A, Myers, I & Namuli, H, 2018. Urban informality and vulnerability: A case study in Kampala, Uganda. Urban Science 2(1), 22.
- Rufat, S, Tate, E, Burton, CG & Maroof, AS, 2015. Social vulnerability to floods: Review of case studies and implications for measurement. International Journal of Disaster Risk Reduction 14, 470–86.
- Salami, RO, von Meding, JK & Giggins, H, 2017. Urban settlements’ vulnerability to flood risks in African cities: A conceptual framework. Jàmbá: Journal of Disaster Risk Studies 9(1), 1–9.
- Salas, J & Yepes, V, 2018. Urban vulnerability assessment: Advances from the strategic planning outlook. Journal of Cleaner Production 179, 544–58.
- Sarris, A, & Karfakis, P, 2006. Household vulnerability in rural Tanzania. CSAE Conference: Reducing poverty and inequality: How can Africa be included.
- Šliužas, RV, 2004. Managing informal settlements: A study using geo-information in Dar es Salaam, Tanzania. Doctoral dissertation, University Utrecht.
- Tate, E, 2012. Social vulnerability indices: A comparative assessment using uncertainty and sensitivity analysis. Natural Hazards 63(2), 325–47.
- Tipple, G, 2005. Housing and urban vulnerability in rapidly-developing cities. Journal of Contingencies and Crisis Management 13(2), 66–75.
- UN Habitat, 2010. Citywide action plan for upgrading unplanned and unserviced settlements in Dar es Salaam. UN Habitat, Nairobi, Kenya.
- UN Habitat, 2015. Habitat III issue paper 22 informal settlements. United Nations, New York, NY.
- United Nations, Department of Economic and Social Affairs, Population Division, 2015. World population prospects: The 2015 revision, key findings and advance tables. Working Paper No. ESA/P/WP.241.
- Wolf, S, Hinkel, J, Hallier, M, Bisaro, A, Lincke, D, Ionescu, C & Klein, RJ, 2013. Clarifying vulnerability definitions and assessments using formalisation. International Journal of Climate Change Strategies and Management 5(1), 54–70.