
 ?Mathematical formulae have been encoded as MathML and are displayed in this HTML version using MathJax in order to improve their display. Uncheck the box to turn MathJax off. This feature requires Javascript. Click on a formula to zoom.
ABSTRACT
To measure policy progress, one key science, technology and innovation indicator has long captured the imagination of policy makers: gross domestic R&D expenditure as a proportion of the gross domestic product of a country. However, African development challenges inform new policy commitments to orient STI towards inclusive and sustainable development. Such dynamics led us to question how the prevailing STI measurement frameworks need to change. A starting point is to add a complementary measure: how can existing methods be used to assess and track the gross domestic R&D expenditure oriented to drive equitable and inclusive human development? The paper aims to design such a complementary indicator using existing national R&D datasets collected in line with the Frascati guidelines. We focus our experimentation in the South African context, with a view to generalising new measures to the sub-Saharan African context over the longer term.
1. Introduction
In the late 1990s and 2000s, economic growth was inextricably linked to the ability of a country to make the transition to a ‘knowledge economy’. The new science, technology and innovation (STI) policy developed in many African countries after 1994 reflected the aspirations towards structural economic transformation, in which value is increasingly generated from the use of knowledge, through technological innovation and highly skilled human resources, to a greater degree than from the exploitation of natural resources and physical activity. Innovation of new products and processes based on the R&D generated by universities, public and private research institutes, and the strengthening of knowledge flows between actors in national, regional or sectoral systems of innovation, became a key goal.
To measure the progress of a country towards a knowledge economy, under the guidance of the OECD, international standard STI indicators became widely accepted. One key indicator long captured the imagination of policy makers: gross domestic R&D expenditure as a proportion of the gross domestic product of a country (GERD/GDP). That is, does a country spend a large enough portion of its total GDP on formal research and development, defined as ‘creative work undertaken on a systematic basis in order to increase the stock of knowledge, including knowledge of man, culture and society, and the use of this stock of knowledge to devise new applications’ (OECD, Citation2015a)?
As an indicator, GERD/GDP has great symbolic power and appeal for policy makers. Research suggests that policy makers are more likely to use indicators that are relevant, simple, timely and comparable (Morlacchi & Martin, Citation2009; Manyuchi, Citation2018). GERD/GDP is simple, easy to calculate, and allows for a high degree of comparability across countries at different stages of development. It also allows policy makers to measure progress towards knowledge intensification of their own economy, over time. In South Africa, as in other emerging economies, ambitious targets were set, measurement systems were put in place and policy makers began an annual discussion around the conditions that facilitate or constrain progress towards the target set.
In contrast to the dominant policy discourse of growth, there is now a strong coupling of dual goals: to create ‘inclusive’ growth, and a ‘better’ society. In the African context, the STI Strategy for Africa (STISA) agenda emphasises that sustained growth, competitiveness and economic transformation requires sustained investment in new technologies, and continuous innovation that impacts on critical sectors for the well-being of all citizens. Six development priorities identify the most urgent (and enduring) African socio-economic developmental challenges that STI should address, ranging from creating wealth, to preventing diseases and ensuring well-being, to eradicating hunger and ensuring food security. In South Africa, after political change in 1994, STI policies aimed to improve national R&D investment in order to contribute to dual policy goals: to promote economic growth and human development (DST, Citation1996). The stark inequality, characterised by persistent and increasingly high levels of poverty and unemployment (World Bank, Citation2018), informs new policy commitments to orient STI towards inclusive and sustainable development.
Such dynamics led us to question how the prevailing STI measurement frameworks need to change. There is a need to design a new set of measures and indicators that can reflect the orientation of STI to developmental challenges in the South African – and African – context more appropriately. One starting point is to add a complementary measure to the symbolic policy target: how can existing methods be used to assess and track the gross domestic R&D expenditure oriented to drive inclusive human development?
The paper aims to design such a complementary indicator as but one experiment towards the larger task of appropriate STI measurement frameworks (Kruss, Citation2018). It draws on national R&D datasets collected in line with Frascati guidelines (OECD, Citation2015a). We focus experimentation in the South African context, with a view to generalising new measures to sub-Saharan Africa over the longer term. Given current data limitations, the paper is of necessity more strongly conceptual, and can only provide empirical illustrations.
Section 2 of the paper emphasises the growing global and national demand for new measures, and outlines the evolution of the conceptual underpinnings and logic of the GERD/GDP indicator, to provide guidelines for a new measure. Section 3 reviews five indicator frameworks oriented to inclusive human development, and argues that because most are too complex and require too many datasets that are not easily available, the conceptual underpinnings for such a new STI indicator should be based on the United Nations’ Human Development Index. Section 4 outlines the design and operationalisation of the proposed model to calculate the new human development oriented R&D intensity (HDRDI) indicator. Section 5 uses South African R&D data as a first step to experiment with possibilities for building this indicator, bearing in mind that data challenges limit the comparative analysis at this stage. Section 6 considers the potential value, and sets out an agenda for further research and experimentation.
2. What can we learn from the evolution of the GERD/GDP indicator?
This section elaborates the growing demand for new STI indicators and then traces the conceptual logic of the GERD/GDP indicator, to determine the properties and functions required from new complementary indicators.
2.1. The demand for new indicators and measures
Higher R&D spending, and higher economic growth, may not lead to higher and more equitable human development (Bhalla & Fluitman, Citation1985; Sylwester, Citation2001; Suri et al., Citation2011; Chaturvedi & Srinivas, Citation2012;Cozzens & Thakur, Citation2014). The OECD Blue Sky conferences were opportunities to obtain global consensus for the mounting evidence that current measurement standards do not sufficiently capture how STI contributes to social and human development goals (OECD, Citation2012, Citation2015b; Charmes et al., Citation2016; Kruss, Citation2018) or to sustainable development (Bordt et al., Citation2006). Authors like Carvalho (Citation2018:373) criticised the ‘revival’ of the GERD/GDP indicator prompted by new policy agendas in developed economies in Europe, arguing that it amounts largely to ‘wishful’ thinking:
Governments have been promising much more than they are capable of delivering but, paradoxically, the popularity of the R&D intensity indicator remains high despite the complete lack of effectiveness of R&D policy based on R&D intensity targets.
Ten years ago, innovation measurement using the Oslo manual was introduced and supported in African countries, as part of national efforts to promote STI, and continental efforts to produce internationally comparable indicators (UNU-INTECH, Citation2004; AU-NEPAD, Citation2010). From the outset, there was extensive debate on how the standard instruments could be adapted to take into account a ‘mass of inexplicable phenomena’. In contexts with low levels of technological capability and industrialisation (Diyamett & Wangwe, Citation2006; Kruss et al., Citation2012), and major human development challenges, how are the standard instruments for measuring R&D and innovation to be utilised?
Here, the development challenges relate to stimulating innovation and facilitating diffusion of existing knowledge and technologies on a wider scale, to wider social benefit, particularly to address social problems such as health, environmental sustainability and poverty. Researchers in the global South critically engage with current STI policy, to assess whether and how it does or can address the goals of inclusive development (Dagnino, Citation2012; Daniels et al., Citation2017). Innovation studies scholars investigate how STI policies can be redesigned to promote sustainable livelihoods, income-generating opportunities for marginalised communities, and well-being for all citizens through improving the delivery of basic services (Thomas et al., Citation2012; Bortagaray & Gras, Citation2014; Cozzens & Sutz, Citation2014; Foster & Heeks, Citation2015).
In a context like South Africa, recently estimated to be the most unequal in the world, with growing poverty and unemployment for large proportions of the population (World Bank, Citation2018), we need additional indicators to guide national STI expenditure. The White Paper on STI (DST, Citation2018) attempts to orient the national system of innovation to address these socio-economic development challenges in a more contextually grounded manner than in the past, to support not only economic growth but also environmental sustainability, inclusive development and improved government performance. It recognises that current STI policy is too strongly informed by narrow linear models of R&D-led innovation.
Developing a new indicator of how national R&D effort is oriented to human development is one approach to use datasets in new ways, to give effect to these new policy commitments.
The main contribution of this paper is to propose one such complementary indicator that can be enshrined in the imaginations and practices of policy makers. Creating new survey datasets is a costly and time consuming process. Taking a more pragmatic approach, this is one of many possible new indicators that can be developed from existing R&D and business innovation datasets, or patent and publication datasets. The next section explores why the GERD/GDP indicator has been so useful to policy makers, to motivate why we start the process of designing new indicators here, and identify what a new indicator will need to be able to do.
2.2. Origins in attempts to measure the research budget of the United States
Godin (Citation2003, Citation2015) argues that the measure of GERD is ‘the most cherished indicator’ popularised by OECD to inform national science budgets. He traces the measure back to efforts by Bernal (1939) in the United States, who was the first to propose the significance of an indicator of the national research budget as a percentage of national income. Vannevar Bush (1940) took the measurement effort further, but the President’s Scientific Research Board (1947) developed a method to estimate the national budget, and formally introduced the indicator of GERD/GDP.
Of historical interest, this board set a 1% goal for 1957, which has since been adopted widely by STI policy makers (Gaillard, Citation2010; Nkwoma Inekwe, Citation2015). Godin notes that there was no rationale or detailed motivation for this target.
This early methodology provided the basis for the international standards enshrined in the Frascati manual from 1963 (see De la Mothe, Citation1992; OECD, Citation2015a). Godin (Citation2003:12) notes that at this point, the nomenclature changed to the more familiar terms, and that ‘the OECD is responsible for the worldwide popularisation of the GERD indicator, and above all, the GERD/GDP ratio’. This completed the evolution of the indicator – it informed the invention of the concept of ‘R&D intensity’, with which the indicator GERD/GDP became synonymous.
2.3. Symbolic power of the indicator increases with global economic shifts
The sustained power of the indicator can be explained by global economic shifts towards the ‘knowledge economy’ (Godin, Citation2006; Powell & Snellman, Citation2004), which required governments to strengthen national R&D foundations, based on the premise that higher R&D spend leads to higher economic growth. Godin (Citation2003) shows that through all of its publications and datasets, the OECD popularised the spread and use of the indicator for setting national planning targets. From the 1980s, the indicator was widely used to compare national economic progress, and inform the allocation of public resources. Governments used the target to support higher STI funding decisions, motivated as a matter of global prestige. International organisations like UNESCO reinforced the symbolic value of the indicator by setting targets for developing countries, and for global funding programmes.
Currently, league tables of global leaders in R&D spending abound. Besides the OECD, World Bank, UNESCO Institute of Statistics and European Union, a range of other business oriented sitesFootnote1 focus on STI data trends – and the ‘most cherished’ indicator remains GERD/GDP. One compelling motivation is that it is a simple, easy to calculate and easy to use measure. The UN now links higher R&D spending to efforts to achieve the Sustainable Development Goals (SDGs), and offers data from UIS to monitor progress. As its website proposes: ‘to evaluate a country’s commitment to R&D, look at spending as a percentage of GDP’ (uis.unesco.org/apps/visualisations/research-and-development-spending).
The task of the paper is therefore to propose a complementary, simple, easy to compute and widely applicable indicator of R&D and inclusive human development that can become enshrined in the imaginations and practices of policy makers in Africa, to guide national R&D investment decisions and planning targets, and compare country progress. Such a complementary measure could serve to foreground whether current policy is oriented sufficiently to achieve the dual commitment to economic growth and human development.
3. How can we develop an indicator of R&D and human development?
Section 3 explores a range of potential conceptual and methodological frameworks for such a complementary indicator. As Nardo et al. (Citation2005) emphasise, a clear and coherent theoretical framework is the critical starting point when constructing indicators. The starting point here is pragmatic, to consider what options are currently available that can be adapted or used as a foundation for creating a new indicator. Section 3 first interrogates how the UN’s Human Development Index can contribute, and then, considers the potential of four other contemporary indices of well-being and social progress.
3.1. The Human Development Index as the ‘most cherished’ indicator of development
In terms of international standards, the Human Development Index (HDI) is the ‘most cherished’ indicator of human development, emerging from an earlier global debate on the relationship between economic growth and human development.
The HDI has its origins in Sen’s ‘capability approach’, and he was integrally involved in developing the conceptual framework and methodology for measurement (Anand & Sen, Citation1994). Anand & Sen (Citation2000:2031) critiqued the ‘preoccupation with commodity production, opulence and financial success’ reflected in dominant indicators such as GDP per capita. They rejected the focus on ‘wealth maximisation’ without consideration of the distribution of wealth, equality and social justice.
The human development approach in contrast aims to promote the ‘good and free human lives’ for which wealth maximisation is typically sought. Economic growth does not automatically lead to human development – a country may grow rapidly with a poor quality of life for its citizens, or conversely, a country may have a good quality of life with only low or moderate growth of GDP per capita. The measure is based on the recognition that economic growth is not an end in itself, but a means for human development (Anand & Sen, Citation2000; Ranis et al., Citation2000; Suri et al., Citation2011). Most importantly, measurement would have to be sensitive to the un/equal distribution of income or social goods, rather than averages. Implicit in this measure then, is the goal of inclusive development.
This approach informed the first Human Development Index produced by the UN in 1990, based on three core dimensions: a long and healthy life, knowledge and a decent standard of living. Health is operationalised through a measure of life expectancy at birth, education is measured by the degree of literacy in the adult population, and standard of living should be measured by income distribution and poverty. In practice, standard of living is measured by the logarithm of national GDP per capita, which precludes measurement of the un/equal distribution of income. This constraint arose from the lack of availability of national datasets of individual incomes in many countries, especially low and middle income countries (Anand & Sen, Citation1994).
As a result, the value of this indicator was very soon questioned (McGillivary, Citation1991; Noorbakhsh, Citation1998). Numerous attempts followed to address the lack of a measure of distribution, so that more disaggregated analysis could be undertaken to reflect the human development of excluded and marginalised groups within a country (Hicks, Citation1997; Grimm et al., Citation2008; Harttgen & Klasen, Citation2012). Others like Berenger & Verdier-Chouchane (Citation2007) returned to Sen’s capability approach to propose an alternate measure to the HDI. The global standard was finally amended, with the creation of an Inequality Adjusted HDI:
The IHDI combines a country’s average achievements in health, education and income with how those achievements are distributed among a country’s population, by ‘discounting’ each dimension’s average value according to its level of inequality. (http://hdr.undp.org/en/content/inequality-adjusted-human-development-index-ihdi)
3.2. Indicator frameworks for human development, well-being and social progress
Critique of the value of the HDI as the ‘most cherished’ indicator to measure human development stimulated a number of attempts to create a more sophisticated and nuanced index, centred on the notions of human development, well-being and social progress more broadly. For example, the Beyond GDP initiative of the European Commission aims to develop indicators that are ‘as clear and appealing as GDP, but more inclusive of environmental and social aspects of progress’ (http://ec.europa.eu/environment/beyond_gdp/index_en.html).
This section reviews the main conceptual framework and dimensions of four initiatives selected as potential models.
The Index of Economic Well-being, based on the work of Lars Osberg (Osberg & Sharpe, Citation1998, Citation2002, Citation2011), allows for measurement of distributional inequalities, and for different weightings between four dimensions, to take into account the subjective understandings of economic well-being in different country contexts. The disadvantage, however, is that given this flexibility and nuance, there are 24 components, and many of these are calculated from multiple underlying variables. This requires a very wide range of data.
While it was possible to create an index for Canada, given the excellent public data sources available, this was not possible for many OECD countries – and is unlikely to be possible for South Africa and other African countries. The trade-off between the complexity of the indicator and the widespread availability of the datasets required is an issue for all of the indices considered here.
The Social Progress Index claims to provide a measure based on a human development and capabilities approach more effectively, by providing a means to assess human needs and the conditions that enable all to reach their potential (Stern et al., Citation2018). This index focuses on non-economic aspects of well-being, and on outcomes, to contribute to understanding how inputs lead to improved social outcomes. Indicator selection was based on criteria of alignment with the conceptual framework, and availability of sources that are well established but up to date, publicly available and available for all countries (Porter et al., Citation2014; Stern et al., Citation2014). Again, a wide range of data is required for each of four components of the three main dimensions. For example, for the dimension of well-being, one of the four components is Access to ICT, which itself has four measures: mobile telephone subscriptions, internet users, participation in online governance and access to independent media. Data availability is also a constraint here.
The OECD’s Better Life index likewise promises to go beyond ‘cold numbers of GDP and economic statistics’ to compare countries across 11 dimensions critical to material well-being and quality of life. Their interactive Index is the pivot around which a body of work on well-being and social progress has grown (OECD, Citation2017; Kasparian & Rolland, Citation2012). Aggregation of the 11 dimensions is not prescribed, to allow for country variation in subjective weighting factors (Mizobuchi, Citation2014; Markowic et al., Citation2016). The conceptual logic therefore does not lend itself to informing the design of a single indicator.
Most recently, there is extensive international collaboration to develop measures of progress on the UN’s 17 Sustainable Development Goals (https://sustainabledevelopment.un.org/post2015/transformingourworld; UN, Citation2016, Citation2017). The Inter-Agency and Expert Group on SDG Indicators developed a global framework that includes 232 indicators, adopted in 2017 to guide practice. Ideally, given that there is global agreement around the 17 development goals and indicators, a new indicator of R&D intensity oriented to human development should be aligned with the conceptual underpinnings of the SDGs. However, the volume of dimensions and indicators – the 2018 dashboard report ran to over 460 pages (Bertelsmann Stiftung and Sustainable Development Solutions Network Citation2018) – means that adopting the logic of the SDG framework would be extremely complex and costly (see Kahn & Koc, Citation2016 for an attempt at designing STI indicators for the SDGs).
In summary, none of these four indices lend themselves to the design of a simple, new, high-level indicator of R&D oriented to inclusive human development, which can easily be calculated using existing national R&D expenditure data. These features are essential to create a complementary indicator with anything like the symbolic power of the ‘most cherished’ indicator. Hence, we propose to adopt the conceptual logic of the Human Development Index, ideally, as adjusted for inequality. The next section goes on to explain the technical details of the model designed.
4. Measuring R&D intensity for inclusive human development
This section uses the conceptual underpinnings of the HDI together with the logic of the GERD/GDP indicator, to propose a new complementary indicator. With a similar logic of adjusting the HDI for inequality, ideally it was intended that an inequality adjusted indicator for human development oriented R&D intensity should be calculated. However, initial attempts to obtain the necessary distributional data failed. Given the data limitations, we propose to focus the model only on measuring Human Development-oriented R&D Intensity (HDRDI) in this paper, as a first step. Section 6 and the Appendix elaborate these data challenges, and plans for future enhancement.
4.1. The model to calculate the HDRDI
The HDI is calculated from measures of three dimensions: health, education and standard of living (as a proxy measure of well-being). Therefore, by extension, to calculate the human development oriented R&D intensity (HDRDI), we would need to use the components of Gross Expenditure on R&D (GERD) and of total national wealth associated with these three dimensions.
The proposed model for the human development oriented R&D intensity measure requires two steps: calculating each component, and then combining these to create a single indicator.
The first step entails the calculation of the indices for each component, using a concept similar to GERD/GDP. summarises the description of the indicator for each component, and the formula used to calculate it.
Table 1. Calculating the HDRDI.
The second step is to combine the three dimensional indices. Again, taking the same logic used to calculate the HDI (UNDP Citation2018a; Citation2018b), the HDRDI is compiled from the geometric mean of the three component indices, as in equation (1) below.
(1)
(1) IHealth, IEducation and Iwell-being may be interpreted as the amount of R&D expenditure expressed as a proportion of total expenditure on health, education and well-being, respectively. These indices share the conceptual logic of the GERD/GDP index. Therefore, the HDRDI is an aggregate human development-oriented R&D intensity index, calculated as the average of these three indices.
Section 5 goes on to use South African R&D data over time to experiment with and demonstrate the potential value of the new indicator. The next section explains how we operationalised the key variables.
To experiment with the new indicator for country comparative purposes, an attempt was made to draw on the data of a range of African countries that now conduct R&D surveys, such as Uganda, Nigeria and Kenya (AUDA-NEPAD, Citation2019). Unfortunately, the key data on socio-economic objectives has not been consistently or systematically gathered and is not yet available in the public domain for these countries. The NEPAD African STI Initiative has prioritised creating a better dataset going forward (AUDA-NEPAD, Citation2019). Hence, it was only possible to conduct within country analysis, over time.
4.2. Operationalising the variables
To operationalise the R&D expenditure variables, we use the South African National R&D Survey for the period 2003–15. The survey covers the main institutional sectors that perform R&D in South Africa, both private and public, namely the business, not-for-profit organisations (NPO), government, science council and higher education sectors. The survey investigates annually the domestic R&D expenditure, performance and flows of funds, as well as the ‘people’ dedicated to the R&D function nationally.
The Frascati manual (OECD, Citation2015a:333–339) developed a classification system to identify the socio-economic objectives or main purpose of a R&D programme, whether based in a firm, university, science council, government department or NPO. The primary objective is classified to most closely reflect the R&D objectives of a public or private sector actor. The South African R&D survey adapted its classification system from the Australian and New Zealand Standard Research Classification (ANZSRC), in turn adapted from the OECD classification. The OECD Socio-economic Objectives list (SEOs) consists of 14 categories, while South Africa’s consists of 21 categories, to suit the local context, but aligned with Frascati guidelines.
We propose to use the SEO classifications of R&D expenditure related to the total R&D expenditure on health (RD_Health), total R&D expenditure on education (RD_Education) and the total R&D expenditure on well-being (RD_Well-being) (). We selected the SEO of R&D on ‘social development and community services’ as a proxy for well-being, because it is the closest measure standard of living. Included in this category are objectives such as ‘community services’, ‘public services’, and ‘urban issues’. The health category includes R&D focused on objectives such as ‘public health’ and ‘health and support services’; whilst the education category includes objectives such as ‘early childhood and primary education’, ‘special education’ or ‘education policy’.
Table 2. Operationalising variables.
To operationalise the national expenditure variables, we use data from a range of global databases and national statistical sources as indicated in .
5. Using the HDRDI indicator in the South African context
Bearing in mind that, ideally, the HDRDI should be adjusted for inequality, what does this new indicator measure, and how can it be used in the South African STI policy space? Essentially, the indicator measures the proportionate domestic R&D expenditure to total national expenditure on human development priorities. That is, while GERD/GDP reflects the knowledge intensity of the economy, the HDRDI separates out an indicator of the knowledge intensity of human development activity. The policy relevance is to provide one new measure to alert politicians and policy makers to consider whether the STI system is sufficiently oriented to the goal of inclusive human development.
We must be clear about the value-add and what is possible from such ‘symbolic’ indicators for policy-making. Arond & Bell (Citation2010:24) reiterate the well-known limitations of this data: ‘the only kinds of policy decision that can be illuminated by indicators of the scale of a country’s R&D are decisions about trying to change that scale’. We would add, that the HDRDI may further inform decisions about the orientation of the scale of investment towards the developmental goals of a country.
How then may the proposed HDRDI indicator be used at national level, to inform decisions about the orientation and scale of R&D investment? presents a comparative trajectory of three STI indicators over time: GERD/GDP, the HDI and the new HDRDI. We interpret the high-level policy implications of each of these trajectories, and how they may contribute to the national policy debate in complementary ways.
Figure 1. The three indicators over time.
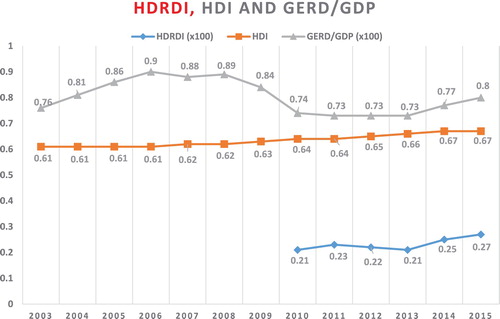
The trend for GERD/GDP has been variable, with a steady increase from 2003 to hover around the high-point of 0.9% for the period 2006–08 and then a decline to hover around the 0.73 mark for the period 2010–13 before a slow rise again from 2014 to 0.8 in 2015. This must be interpreted in the context of a decline in GDP in recent years, however, which may push R&D intensity upwards (IDEA Consult, Citation2008).
South Africa’s knowledge intensity in 2015/16 is low relative to high-level income countries, such as Japan (3.28), Finland (2.90), Germany (2.88) and the USA (2.79). It is also low relative to its BRICS counterparts. China (2.07), Brazil (1.17) and Russia (1.13) have attained the 1% target, and although India (0.63) has a lower indicator, the size of the population makes comparison difficult. South Africa out-performs comparator countries on the African continent, such as Senegal (0.54), Uganda (0.5) or Mauritius (0.18), although it is in a comparable range to Egypt (0.72).
The policy message is clear: in the past five years, South Africa’s domestic expenditure on R&D may be growing, but the country needs to increase the scale of investment at a faster rate, to contribute to economic growth and human development.
In contrast, the HDI has been very steady over the entire period, increasing only minimally, from 0.61 in 2003 to 0.67 in 2015. The most up to date data for 2017 showed that the HDI remains at a similar level (0.699). In contrast to the South African trajectory is a steady improvement globally over the past decades, with countries typically moving to a higher level status: ‘average HDI levels have risen significantly since 1990 – 22 percent globally and 51 percent in least developed countries’ (http://hdr.undp.org/en/2018-update).
South Africa has not followed this upward trend at all. Moreover, with inequality adjustments, in 2017 the IHDI stood at a low 0.467. Significantly, the inequality coefficient (30.3%) for South Africa is higher than the average for medium HDI countries (25.1%) and equal to the average for sub-Saharan Africa (30.8%).
Here, the policy message is essentially that in aggregate, while the life expectancy, education and standard of living of the population may not have worsened significantly since 2003, there has not been improvement in line with comparator countries, and there is a significant loss of opportunity for human development due to inequality.
reflects that over a five year period, the HDRDI remained essentially static, increasing very slowly with a few downward dips. It largely mimics the GERD/GDP trend for the same period, suggesting that the orientation of the R&D system towards human development has remained static, despite rising inequality, poverty and unemployment.
The policy message is that knowledge intensification to promote human development is growing extremely slowly and on too small a scale and requires a stronger focus in STI policy, with higher levels of R&D investment.
6. In conclusion: An agenda for further research and experimentation
The policy aspiration to create a knowledge economy is intensified by current digital advances, whereby previously unimaginable technological integration between the physical, the digital and the biological is being achieved. The exponential pace and scale of these technological disruptions are provoking a total questioning of global economic growth models, STI policies, and the understanding of systems of innovation. In this context, the need to orient STI policies to human development and growth becomes ever more acute and urgent.
Researchers have warned of the dangers of political ‘misapplications’ of a symbolic indicator like GERD/GDP, which can lead to simplistic forecasts that do not take into account sufficiently the complexity required for effective innovation policies (Carvalho, Citation2018). Castro-Martínez et al. (Citation2009:10) for example, argue that ‘some R&D indicators are no more than input measures and do not necessarily (directly and positively) correlate with the performance of the innovation system’.
Nevertheless, the research is equally clear that many national bodies use the GERD/GDP ratio comparatively with competitor countries, to leverage and influence government resource allocations to STI, in powerful ways (Freeman, Citation1988; Arond & Bell, Citation2010). And it is this kind of usage of the new indicator that is proposed.
We need to be able to report regularly our progress on growing the scale of STI oriented to human development, as an equally significant policy goal. Routinely reporting and comparing HDRDI ratios can serve to shift the policy discourse, to leverage a greater scale of investment in R&D oriented to human development purposes, and away from a concentration on promoting R&D to private benefit as the primary focus.
Clearly, the call is of value largely at the level of symbolic policy. It signals government’s commitment to harness STI towards inclusive human development, and provides an indicator of improvements in the scale of such an endeavour over time.
We propose that a more accurate measure needs to be calculated, which adjusts for income and distributional inequalities, in order to reflect the goal of inclusive development more effectively. A proposal for a method of calculating an inequality adjusted HDRDI is presented in the Appendix. Future research is required to identify – or perhaps create – new datasets that allow for such measures of distribution.
Data limitations are a potential constraint on the uptake of the proposed new indicator, but gaining support for the value of HDRDI may have a positive effect, to spur efforts across Africa to strengthen STI data collection, in alignment with global measurement efforts around the SDGs. The conceptual model of the HDRDI can inform and influence efforts across the continent to strengthen and improve STI measurement. The model points to the need to collect comprehensive data on the socio-economic objectives of R&D more systematically, and to make this data more widely available for comparative purposes, in the interests of STI oriented to inclusive development priorities.
Disclosure statement
No potential conflict of interest was reported by the author(s).
Additional information
Funding
Notes
References
- Anand, S & Sen, A, 1994. Human Development Index: Methodology and measurement. UNDP Human Development Office. Occasional Paper 12.
- Anand, S & Sen, A, 2000. Human development and economic sustainability. World Development 28(12), 2029–49.
- Archibugi, D & Coco, A, 2005. Measuring technological capabilities at the country level: A survey and a menu for choice. Research Policy 34, 175–94.
- Arond, E & Bell, M, 2010. Trends in the global distribution of R&D since the 1970s: Data, their interpretation and limitations. Working Paper 39, Brighton: STEPS Centre.
- AU-NEPAD (African Union–New Partnership for Africa’s Development), 2010. African innovation outlook 2010. AU-NEPAD, Pretoria.
- AUDA-NEPAD, 2019. African innovation outlook 2019. AUDA-NEPAD, Johannesburg.
- Berenger, V & Verdier-Chouchane, A, 2007. Multi-dimensional measures of well-being: Standard of living and quality of life across countries. World Development 35(7), 1259–76.
- Bertelsmann Stiftung and Sustainable Development Solutions Network, 2018. Global responsibilities: Implementing the goals. SDG Index and Dashboard report 2018.
- Bhalla, A & Fluitman, A, 1985. Science and technology indicators and socio-economic development. World Development 13(2), 177–90.
- Bordt, M, Rosa, JM & Boivin, J, 2006. Science, technology and innovation for sustainable development. SIEID, Statistics Canada.
- Bortagaray, I & Gras, N, 2014. Science, technology and innovation policies for inclusive development: Shifting trends in South America. In Crespi, G & Dutrenit, G (Eds.), Science, technology and innovation policies for development. The Latin American Experience. Springer International Publishing, Switzerland, 255285.
- Carvalho, A, 2018. Wishful thinking about R&D policy targets: What governments promise and what they actually deliver. Science and Public Policy 45(3), 373–91.
- Castro-Martinez, E, Jimenez-Saez, F & Ortega-Colomer, F, 2009. Science and technology policies: A tale of political use, misuse and abuse of traditional R&D indicators. Scientometrics 80(3), 827–44.
- Charmes, J, Gault, F & Wunsch-Vincent, S, 2016. Measuring innovation in the informal economy: Formulating an agenda. Paper presented at the OECD Blue Sky Forum III, Ghent, Belgium, 19–21 September.
- Chaturvedi, S & Srinivas, KR, 2012. Science and technology indicators: New issues and challenges. Current Science 102(12), 1640–4.
- Cozzens, S & Sutz, J, 2014. Innovation in informal settings: Reflections and proposals for a research agenda. Innovation and Development 4(1), 5–31.
- Cozzens, S & Thakur, D, 2014. Innovation and inequality: Emerging technologies in an unequal world. Edward Elgar, Cheltenham, UK.
- Dagnino, R, 2012. Why science and technology capacity building for social development? Science and Public Policy 39, 548–56.
- Daniels, C, Ustyuzhantseva, O & Yao, W, 2017. Innovation for inclusive development, public policy support and triple helix: Perspectives from BRICS. African Journal of Science, Technology, Innovation and Development 9(5), 513–27.
- De la Mothe, J, 1992. The revision of international science indicators: The Frascati manual. Technology in Society 14(4), 427–40.
- Department of Science and Technology, South Africa, 1996. White paper on science and technology. DST, Pretoria.
- Diyamett, B & Wangwe, S, 2006. Innovation indicators within Sub-Saharan Africa: A specific case for Tanzania. In Blankely, W, Scerri, M & Molotja, N (Eds.), Measuring innovation in OECD and NON-OECD countries: Selected seminar papers. HSRC Press, Cape Town, 183–98.
- DST, 2018. Draft white paper on science, technology and innovation 2018. DST, Pretoria.
- Foster, C & Heeks, R, 2015. Policies to support inclusive innovation. Working Paper 61, Centre for Development Informatics, University of Manchester.
- Freeman, C, 1988. Quantitative and qualitative factors in national policies for science and technology. In Annerstedt, J & Jamison, A (Eds.), From research policy to social Intelligence: Essays for Stevan Dedijer. Macmillan, Basingstoke, 114–28.
- Gaillard, J, 2010. Measuring research and development in developing countries. Science, Technology and Society. doi:10.1177/097172180901500104
- Godin, B, 2003. The most cherished indicator: Gross domestic expenditures on R&D. Project on the History and Sociology of S&T statistics. Working paper 22. Montreal, Quebec.
- Godin, B, 2006. The knowledge-based economy: Conceptual framework or buzzword?. Journal of Technology Transfer 31(1), 17–30.
- Godin, B, 2015. Innovation contested: The idea of innovation over the centuries. Routledge, New York.
- Grimm, M, Harttgen, K, Klasen, S & Misselhorn, M, 2008. A Human Development Index by income groups. World Development 36(12), 2527–46.
- Harttgen, K & Klasen, S, 2012. A household-based Human Development Index. World Development 40(5), 878–99.
- Hicks, D, 1997. The inequality adjusted human development index: A constructive proposal. World Development 25(2), 1283–98.
- IDEA, Consult, 2008. A time series analysis of the development in National R&D Intensities and National Public Expenditures on R&D. Final Study Report for Specific Assignment. 4:1-02.
- Iizuka, M & Hollanders, H, 2017. The need to customise innovation indicators in developing countries. UNU-MERIT, Working Paper Series #2017–032.
- Kahn, M & Koc, Y, 2016. Developing a thematic set of science, technology and innovation indicators for the sustainable development goals. UNESCO Institute for Statistics, Paris.
- Kasparian, J & Rolland, A, 2012. OECD's ‘Better Life Index': Can any country be well ranked? Journal of Applied Statistics 39(10). doi:10.1080/02664763.2012.706265
- Kruss, G, 2018. Towards an agenda for measuring innovation in emerging African economies: what can we learn from the case of South Africa? International Journal of Technological Learning, Innovation and Development, 10(3–4), 347–365.
- Kruss, G, Adeoti, J, & Nabudere, D, 2012. Universities and knowledge-based development in sub-Saharan Africa: Comparing university–firm interaction in Nigeria, Uganda and South Africa. Journal of Development Studies 48(4), 516–530.
- Land, KC, Michalos, AC & Sirgy, MJ, eds., 2011. Handbook of social indicators and quality of life research. Springer Science & Business Media, Dordrecht.
- Manyuchi, A, 2018. Conceptualising and institutions facilitating ‘use’ of innovation indicators in South Africa’s science, technology and innovation policymaking. African Journal of Science, Technology, Innovation and Development 10(4), 483–92.
- Marković, M, Zdravković, S & Mitrović, M, 2016. An iterative multivariate post hoc I-distance approach in evaluating OECD Better Life Index. Social Indicators Research 126(1), 1–19.
- McGillivary, M, 1991. The human development index: Yet another redundant composite development indicator? World Development 19(10), 1461–8.
- Mizobuchi, H, 2014. Measuring world better life frontier: A composite indicator for OECD better life index. Social Indicators Research 118(3), 987–1007.
- Morlacchi, P & Martin, B, 2009. Emerging challenges for science, technology and innovation policy research: A reflexive overview. Research Policy 38, 571–82.
- Nardo, M, Saisana, M, Saltelli, A, Tarantola, S, Hoffman, A & Giovannini, E, 2005. Handbook on constructing composite indicators. OECD Statistics Working Papers 2005/03.
- Nkwoma Inekwe, J, 2015. The contribution of R&D expenditure to economic growth in developing economies. Social Indicators Research 124, 727–45.
- Noorbakhsh, F, 1998. A modified Human Development Index. World Development 26(3), 517–28.
- OECD, 2012. Innovation and inclusive development: Discussion report. OECD, Paris.
- OECD, 2015a. Frascati Manual 2015. Guidelines for collecting and reporting data on research and experimental development. OECD, Paris.
- OECD, 2015b. Daejeon declaration on science, technology and innovation policies for the global and digital age. http://www.oecd.org/sti/daejeon-declaration-2015.htm.
- OECD, 2017. How's life? 2017: Measuring well-being. OECD, Paris. doi:10.1787/how_life-2017-en
- Osberg, L & Sharpe, A, 1998. An index of economic well-being for Canada. Strategic Policy Human Resources Development Canada, Ottawa.
- Osberg, L & Sharpe, A, 2002. An index of economic well–being for selected OECD countries. Review of Income and Wealth 48(3), 291–316.
- Osberg, L & Sharpe, A, 2011. Moving from a GDP-based to a well-being based metric of economic performance and social progress: Results from the index of economic well-being for OECD. Centre for the Study of Living Standards, Ottawa, Canada.
- Porter, M, Stern, S & Green, M, 2014. Social progress index 2014. Social Progress Initiative, Washington.
- Powell, W & Snellman, K, 2004. The knowledge economy. Annual Review of Sociology 30, 199–220.
- Ranis, G, Stewart, F & Ramirez, A, 2000. Economic growth and human development. World Development 28(2), 197–219.
- Stern, S, Wares, A & Epner, T, 2018. 2018 Social progress index methodology report. Social Progress Imperative, Washington.
- Stern, S, Wares, A, Orzell, S & O'Sullivan, P, 2014. Social progress index 2014. Methodological approach. Social Progress Imperative, Washington.
- Suri, T, Boozer, M, Ranis, G & Stewart, F, 2011. Paths to success: The relationship between human development and economic growth. World Development 39(4), 506–22.
- Sylwester, K, 2001. R&D and economic growth. Knowledge, Technology, & Policy 13(4), 71–84.
- Thomas, H, Fressoli, M & Becerra, L, 2012. Science and technology policy and social ex/inclusion: Analyzing opportunities and constraints in Brazil and Argentina. Science and Public Policy 39, 579–91.
- UNDP, 2018a. Human Development statistics and indicators: 2018 statistical update.
- UNDP, 2018b. Human development indices and indicators. 2018 Statistical Update. http://hdr.undp.org/sites/all/themes/hdr_theme/country-notes/ZAF.pdf.
- United Nations, 2016. Global indicator framework for the Sustainable Development Goals and targets of the 2030 Agenda for Sustainable Development.
- UNU-INTECH, 2004. Designing a policy relevant innovation survey for NEPAD. UNU-INTECH, Maastricht.
- UN Statistical Commission, 2017. Cape Town Global Action Plan for Sustainable Development Data. High-level Group for Partnership, Coordination and Capacity-Building for Statistics for the 2030 Agenda for Sustainable Development.
- World Bank, 2018. Overcoming poverty and inequality in South Africa: An assessment of drivers, constraints and opportunities. World Bank, Washington.