
 ?Mathematical formulae have been encoded as MathML and are displayed in this HTML version using MathJax in order to improve their display. Uncheck the box to turn MathJax off. This feature requires Javascript. Click on a formula to zoom.
ABSTRACT
In this paper, we construct a composite social well-being index to investigate disparities between 30 African countries. We do this because previous inequality studies relied on income measures; however, when it comes to Africa, specifically, income is not an adequate measure to capture well-being. Furthermore, we apply the recentered influence function (RIF) method to regress the variance of social well-being on likely influencing factors. Lastly, we use the Blinder–Oaxaca decomposition technique to investigate the gap between countries with higher, and those with lower levels of social well-being. The results indicate that there are high levels of inequality; however, the inequality in social well-being is less stark than in income. Factors that are significantly related to inequality are employment, gender equality, exports, CO2 emissions, population density, public protests, capital investment, and internet access. The gap that exists between higher and lower social well-being countries is mainly due to the endowment effect.
1. Introduction
Despite progress made towards the reduction of global poverty (more than a billion fewer people were living in extreme poverty in 2015 than in 1990) (World Bank Citation2018), income and well-being inequality are rising between countries (from 1980 to 2016, average incomes in sub-Saharan Africa fell behind the world average, and in Africa, Southern and Central Africa are the most unequal). As argued by the World Bank (Citation2018) and the World Inequality Lab (Citation2018), one of the leading explanations for African countries’ inability to increase well-being includes the overall high levels of inequality in and between countries. These high levels of inequality do not only relate to income, but also to health care, education, services and technology between countries (Helliwell et al. Citation2016, Sachs et al. Citation2018). The high levels of inequality seem to be unjust and lead to protests, uprising and a feeling of exclusion (Wilkinson & Pickett Citation2009, Helliwell et al. Citation2015).
However, measuring inequality in well-being using a single economic indicator (such as real income per person), which is the norm, might provide a distorted picture of the true level of well-being inequality in Africa. The primary reason for this is that in developing countries, with high levels of subsistence farming (65 per cent of African people depend on subsistence farming) goods and services are often not traded on markets and are, therefore, excluded from standard economic measures such as the Gross Domestic Product (GDP) (African Development Promise Citation2020). Additionally, income is a measure of the means and not the ends. Thus, income does not measure the well-being outcomes of policy (Sen Citation1993). Ultimately this could lead governments to formulate inaccurate and inadequate policies creating a loss of confidence in government itself (OECD Citation2013, Stiglitz Citation2017).
Against this backdrop, our primary aim is to compose a more appropriate measure than a single economic measure to determine the level and inequality of well-being among African countries. This has been necessitated by the over-reliance of previous studies (see section 2) on the use of income as a measure of well-being and inequality in this region. Additionally, we use this newly developed measure to explore, at a macro-level, the covariates of inequality in African countries. Lastly, we divide African countries, into subgroups with higher and lower mean levels of social well-being. We compare these subgroups to determine whether an endowment or coefficient effect (the ability to transform an additional unit of endowments into higher well-being) is the primary cause of the observed well-being gap.
The current paper adds to the literature by being the first-known study to construct a composite social well-being index (SWI) at a macro-level, comprising domains of a non-economic nature (ends), explicitly focusing on the needs of Africa.Footnote1 Africa still requires basic necessities, such as shelter, nutrition, health and education, to improve human well-being (African Union Citation2015, AUC/OECD Citation2018). We construct the SWI, drawing inspiration from the capabilities approach (Sen Citation1993) and argue that well-beingFootnote2 is dependent on a combination of functionings (real opportunities) and capabilities (the ability to choose among alternative functionings). Furthermore, the study adds to the relatively small body of literature which focuses on the covariates of inequality in social development in Africa (for comparative studies in income inequality see Leibbrandt et al. Citation2012, Anyanwu et al. Citation2016) and is the first study to decompose the social well-being gap between countries in an endowment and coefficient effect.
The study uses data obtained from the World Bank, United Nations, African Development Bank and the Global Economy database. As we are interested in inequality in the last decade, we pooled data from 2006 to 2016 (the latest period for which many of the variables are available).
Our results indicate high levels of inequality between African countries; however, real income per person reveals higher levels of inequality than the SWI. The covariates that are significantly related to social well-being inequality are: employment levels, gender equality, exports, emission levels, population density, the level of household consumption, public protests, and access to the internet. After decomposing the difference in social well-being, we find that the endowment effect contributes most in explaining the gap between high and low social well-being countries.
The rest of the paper is structured as follows. Section 2 provides a brief literature review, whereas section 3 contains the methodology used. Section 4 describes the data and the selected variables. The results follow in section 5, while the paper concludes in section 6.
2. Literature review
Most studies that focus on distributional patterns, approach them from an economic point of view. For example, Deaton (Citation2013) used income and determined that inequalities are not only rising between countries but also within countries. However, Stiglitz et al. (Citation2009) made it clear that if the aim is achievement in human well-being, studies must not rely on traditional measures of economic well-being in determining the success or failure of policies. This sentiment is echoed by Clark and D'Ambrosio (Citation2017). They argue that income as a measure of well-being in African regions is not appropriate, given the characteristics of these economies.
Looking beyond material inequality (income) in Africa, studies focus on measuring distributional patterns using single non-economic or subjective indicators. These indicators include, for example, health and education or happiness and life satisfaction (see Sahn & Younger Citation2007, Clark & D'Ambrosio Citation2017, Kollamparambil Citation2020 in this regard). Nevertheless, there has been critique against using single non-economic indicators, as they could be closely correlated with economic indicators (Drèze & Sen, Citation1991).
In terms of composite indices, there is a limited number of studies that attempt to identify inequality in well-being for the African region. For example, Sapkota (Citation2010) relied on the Human Development Index (HDI) to explain why SSA has not increased well-being in the age of globalisation. Shimeles and Nabassaga (Citation2017) made use of an asset-based index to determine inequality and found the lack of higher education played a significant role to explain differences between countries. As noted by Asongu (Citation2014), the income component of the HDI moves slower than others, which hampers the reduction of inequality in well-being. The problem with using the HDI as a measure for human well-being is pointed out by McGillivray and White (Citation1993) and Cahill (Citation2005), in that the HDI is closely correlated with the GDP (correlation coefficient of 0.89) so that the index itself could be deemed redundant.
Apart from the above, three indices relate to our newly proposed measure of well-being. They are the Social Progress Index (SPI), the Sustainable Development Goals (SDG) Index and the Africa SDG Index. Established in 2014, the SPI measures the real quality of life, independent of economic indicators for the globe (Porter et al. Citation2017). Unfortunately, with only five years of data and a lack of African representation, we are not able to test distributional patterns with our proposed well-being measure using this data.
In 2016, the SDG Index and Dashboard was launched by the Bertelsmann Stiftung and the Sustainable Development Solutions Network (SDSN). The primary goal of this index and dashboard is to provide an updated assessment of countries’ distance to achieving the SDGs (Sachs et al. Citation2018). The SDG Index and Dashboards Report 2018, clearly show that countries in Africa will struggle to meet the SDGs by 2030 and that inequalities are high and increasing (Sachs et al. Citation2018). Since Africa lags so far behind other countries in reaching the SDGs, the African SDG Index was introduced in 2018, which specifically relates to the achievements in African countries (The Sustainable Development Goals Center for Africa and Sustainable Development Solutions Network (SDGCA & SDSN) Citation2018). The problems with these SDG indices are; (i) that the data is only available for three years and the African index for one year, and (ii) both indices use a wide array of indicators to measure the 17 SDGs and rank countries according to their achievements. Some of these indicators are relevant for developed countries, but not as applicable to Africa's developmental state.
In this study, we attempt to address the abovementioned limitations in the literature.
3. Methodology
3.1. Composite SWI
To construct the composite SWI for Africa, we follow the methodology as put forth in the ‘Handbook on Constructing Composite Indicators’ (OECD Citation2008), Hagerty and Land (Citation2012) and Land (Citation2014).
After selecting appropriate dimensions as well as indicators to be included in the composite SWI (see section 4.2), we normalise the indicators so that all are expressed as percentages.
Next, in those dimensions that have more than one indicator, we create sub-indices, using equal weighting and linear aggregation. To construct the composite SWI, we aggregate the different sub-indices by making use of equal weighting and geometric aggregation. Hagerty and Land (Citation2012) argue that equal weighting has the benefit of simplicity.Footnote3 The choice of geometric aggregation stems from the fact that the components of our composite SWI are ‘non-substitutable’; thus, compensability among them is not likely. According to Mazziotta and Pareto (Citation2017:174) in a non-compensatory or partially compensatory approach, all the dimensions of the composite index should be balanced. Consequently, we use an aggregation method that penalises unbalanced dimensions. The derived SWI is measured on a scale from 1 to 100.
We test the robustness of the composite index in terms of the subjective choices we made regarding (i) normalisation, (ii) weighting and (iii) aggregation. First, we use different normalisation methods, namely the minimum-maximum method and standardisation. We correlate these different normalised indicators using Pearson's correlation coefficient. If these indicators are strongly correlated, we assume our choice of normalisation does not affect the outcome of the composite index. Secondly, to test the choice of weighting and aggregation, we construct alternative composite indices, using different weighting and aggregation methods. The weighting methods we apply are principal component analysis (PCA) and equal weighting. When using equal weighting, we distinguish between linear and geometric aggregation. Once again, we test the robustness of our index by correlating it with the differently derived indices. In the event of strong correlations, we assume our index to be robust to our subjective choices (see Jordá et al. Citation2015).
Lastly, we test the linkages or correlation of our composite index to other published indices and well-being measures as an additional method to validate our index (Hagerty & Land Citation2012, OECD Citation2008). We are limited in our choices, as no other composite SWI exists for Africa. Possible alternative measures for social well-being that we can use as a robustness check are the HDI and SPI. However, the reader must remember that the HDI and SPI both include a measure of income, which is not an appropriate well-being measure for Africa (Clark & D'Ambrosio Citation2017). If the indices are positively correlated and statistically significant, we assume that our composite SWI offers a fair representation of social well-being in Africa (Groh et al. Citation2010).
3.2. Inequality measures
There are many statistics for quantifying the dispersion in distributions; however, not all of these measures perform equally well in measuring the dispersion of bounded indices. Therefore, we follow the research of Kalmijn and Veenhoven (Citation2005), who found pure statistical measures of dispersion, such as the coefficient of variance, standard deviation and interquartile range, give the most satisfactory results.
3.3. Recentered influence function (RIF)
To explore, the covariates of social well-being inequality between African countries, we use a method developed by Firpo et al. (Citation2009), namely RIF regressions. RIF regressions are similar to standard regressions, except that they replace the dependent variable with the RIF for the distributional statistic of interest, which in our analysis is the variance. The influence function represents the relationship of an individual observation to the distributional statistic of interest.Footnote4
Our dependent variable, social well-being, is denoted by SWi and assumes that represents its distribution.
in this instance the variance of SW. A RIF regression aims to determine the relationship between the covariates,
and
and is denoted as follows:
(1)
(1)
The dependent variable is the variance in social well-being. is a vector of independent variables and
is the error term. As a robustness check, we also regress the covariates on the Gini-coefficient of social well-being. However, this is not ideal, as the Gini-coefficient is not as reliable when using bounded variables. However, similar results to those found using the variance of the SW supports our conclusions. To test for endogeneity is a challenge, seeing that we are not employing panel data estimation techniques. There are also no suitable instruments; thus, we are limited to test for correlation between the covariates and the estimated error term. We found the correlation in all instances to be less than r=0.3. Although it is an elementary test, we assume that, even with a margin of error, our results should indicate the significant covariates of SW inequality.
3.4. Blinder–Oaxaca decomposition
We use the Blinder–Oaxaca (BO) decomposition technique to decompose the gap in social well-being between our two subgroups of countries. The purpose is to determine whether the gap is caused primarily by an endowment (characteristics) or a coefficient (returns to the characteristics) effect.
The characteristics portion is related to the mean endowments, for example, access to health care and education, whereas the returns to the characteristics part relates to the differences in the estimated coefficients. Using the BO decomposition allows us to derive both the aggregate and the detailed decomposition of the mean.
Our dependent variable, social well-being, is continuous in nature, though bounded. There is an option to use the non-linear BO decomposition method. However, then we need to recode our dependent variable into an ordered categorical variable appropriate in the estimation of non-linear regressions techniques. This might bias regression results, seeing that specific cut-off points will be subjectively selected. Therefore, as the spread of the SWI approximates a normal distribution (Becchetti et al. Citation2014) and research shows that the results of both non-linear and linear BO methods are similar, we fit linear models in all estimations.
The linear BO decomposition method employs ordinary least squares (OLS) as an estimation technique, of which the standard equation, without differentiating between the two groups (countries with higher (HSW) and lower (LSW) levels of social well-being), is as follows:
(2)
(2) where
refers to the social well-being of country i.
is a vector of explanatory variables of SW,
is the associated parameter vector and
is an error term. The standard BO decomposition then breaks down the difference between countries with HSW and LSW levels of social well-being in the following way:
(3)
(3)
In Equation (3) is the predicted mean social well-being for countries with higher levels of social well-being.
is the mean vector of covariates for countries with HSW which determine said social well-being and
is the vector of estimated returns to the social well-being determinants for countries with HSW (likewise for countries with LSW subscript).
The first term on the right-hand side is that part of the gap in social well-being (evaluated at the mean) that can be assigned to differences in country characteristics (endowment effect). In other words, it is the difference in the social well-being between the two subgroups, due to differences in observable characteristics. The second term is that part of the gap assigned to differences in the returns to characteristics (coefficient effect). This shows the effect that arises from differentials in how the characteristics are associated with social well-being. Thus, the social well-being returns on a change in the endowments. In turn, the contribution of each of the explanatory variables in the X vector to the overall difference in country characteristics can be calculated (and likewise the returns to characteristics).
Decompositions of the above type will be sensitive to whichever subgroup's social well-being level is assumed to be the norm. However, in our application, there is no convincing case to be made for either the subgroup of countries with HSW or those with LSW as the reference group. Therefore, we adopt the technique of Neumark (Citation1995) and Madden (Citation2010) who suggest using the vector of returns obtained from the pooled sample of countries, in which case the decomposition takes on the form:
(4)
(4) where
is the vector of returns obtained from the pooled sample. The first term on the right-hand side of the equation represents the endowment effect, while the next two terms represent the coefficient effect.
4. Data and variables
4.1. Data
We use data from various sources, such as the World Bank,Footnote5 United Nations,Footnote6 African Development Bank,Footnote7 and the Global Economy,Footnote8 and we pool the data for the period from 2006 to 2016. Due to the limitations in data availability, we were restricted to include only 30 of the potential 54 African countries. These countries (figure in section 5.4 and Appendix B) were selected based on data availability; therefore, the sample of countries was not randomly selected. The countries not included in the sample might be those with lower levels of well-being; therefore, we acknowledge that our results might be biased. Thus, our findings on inequality between the countries might be more severe, given that those countries with lower well-being might be those excluded.
However, within this subset of countries, there are both high and low-income countries. The sample includes some of the poorest (Burundi, Niger) and the wealthiest (Mauritius, Algeria) countries for the year 2016. Furthermore, we represent each region in Africa, West, East, North, Central, and Southern African countries (in Eastern Africa the countries in the Horn of Africa are excluded, due to a lack of data). Although our sample does not include all the countries in Africa and is not representative, it is still informative of the social well-being inequality amongst African countries.
4.2. Selection of variables
4.2.1. Selection of dimensions included in the SWI
Improvements in well-being in African communities still rely heavily on access to basic needs associated with nutrition and services (water, electricity and sanitation) (SDGCA & SDSN Citation2018, African Union Citation2015, AUC/OCED Citation2018) as well as developmental needs such as education and health (see sections 1 & 2).
The composite SWI includes four dimensions consisting of various measuring indicators (see for descriptive statistics). We recode all variables so that a lower number indicates a worse outcome than a higher number. Thus, in some instances, we use the inverse of the indicator.
Table 1. Descriptive statistics of the variables in the SWI in raw format (2006–2016).
Therefore, the domains included in the SWI are as follows:
Nutrition: We use the prevalence of undernourishment as a percentage of the total population. We derive the inverse; thus, 100 minus the prevalence of undernourishment.
Health: We use life expectancy at birth and the under-five mortality rate. We express life expectancy as a percentage of the maximum (that is 76 years in Algeria), and the under-five mortality rate as a number out of 1000 live births, which we transformed into a percentage. We calculated the inverse of the under-five mortality rate by using 100 minus the mortality rate; indicating those children that survived past the age of 5. Following the methodology used in the HDI to derive an index within a dimension, we made use of equal weighting and calculated the arithmetic mean (UNDP Citation2015).
Education: We use mean years of schooling. We base estimates for mean years of schooling on the duration of schooling at each level of education. To normalise this indicator, we expressed it as a percentage of the maximum years of education (10.1 years in South Africa). We would have appreciated the opportunity to add additional variables such as adult literacy rate, but unfortunately, there is a significant lack of data on this. Additionally, we acknowledge that we do not capture the quality of education in this domain, as there is no measure such as the OECD’s Programme for International Student Assessment (PISA) available for African countries.
Basic services: We use the percentage of the population that has access to basic drinking water, basic sanitation and electricity. We derive the index by calculating the arithmetic mean of the three indicators.
4.2.2. Selection of the covariates
In terms of the covariates included in the RIF regression and the BO decomposition (), we considered the four pillars of the SDGs (Helliwell et al. Citation2012). Under the first pillar, focusing on ending extreme hunger, we consider employment (Clark & D'Ambrosio Citation2017), consumption (Stiglitz et al. Citation2009), exports (Sala-i-Martin Citation1997, Sachs & Warner Citation1997) and capital investment (Barro et al. Citation1995). Under the second pillar of environmental sustainability, we choose CO2 emissions (Martinez & Mlachila Citation2013) and population density (Greyling & Rossouw Citation2016). The third pillar represents social inclusion and stresses that every society should benefit from technology regardless of gender. Therefore, we include variables such as internet access (UNESCO Citation2014) and gender equality (UN Women Citation2014, Sachs et al. Citation2018). Lastly, the fourth pillar focuses on good governance and we choose public protest (representing a democratic way of voicing demands with political, economic or social motives) to represent this pillar (Bardhan Citation2006).
Table 2. Descriptive statistics of the covariates.
5. Results
5.1. Composite SWI
To construct our composite SWI, we follow the methodology as outlined in section 3.1. The derived composite index is measured on a scale from 1 to 100, with 1 being the minimum and 100 being the maximum social well-being.
We test for sensitivity to the normalisation of variables, weighting and aggregation of our SWI. shows that all indices, using different weighting schemes, are highly correlated. Based on these results, we conclude that our composite SWI is robust to the subjective choices made regarding normalisation, weighting and aggregation.
Table 3. Correlation between alternative composite social well-being indices.
As an additional validation of our composite SWI, we correlate it to previously published indices namely the HDI, the SPI and a single measure of economic well-being, namely real GDP per person (see ). We find that these measures are positively and significantly correlated. However, as income is a component of each of these alternative measures and not a good measure of human well-being in the African context, we believe that the newly constructed SWI will give more robust results in the analysis of human well-beingFootnote9 (Groh et al. Citation2010).
Table 4. Correlation between measures of well-being.
5.2. Social well-being inequality vs economic well-being inequality
presents descriptive statistics and the results for the composite SWI and real GDP per person. Based on the coefficient of variance, which is used to compare variables with different scales, we note that the income variable (means) (1.16) has a much wider spread than the SWI (ends) (0.15), indicating higher levels of inequality depicted by income than by social well-being. However, the disparities in social well-being are still acute. We see this in the wide range of the SWI with a minimum value of 46.62 (Niger) and a maximum of 92.08 (Algeria).
Table 5. Comparison of inequality measures.
From this initial result, we can infer that to measure well-being inequality between countries in Africa; one cannot rely on results generated by single measures of economic (material) well-being. If the goal is to measure progress in well-being, we need to consider a multidimensional well-being measure, which focuses on the ends and not a pure income indicator. Therefore, in the rest of the paper, we use the SWI.
5.3. RIF results
presents the RIF estimation results. The following covariates are statistically significant and have a decreasing effect on the variance of social well-being: employment opportunities for people in Africa, gender equality, and exports. On the other hand, emission levels, population density, public protests, which are related to weak governance, capital investment, and internet access, have an increasing effect. We discuss the RIF results and the developmental implications of these results in more detail in Appendix A.
Table 6. RIF results.
Based on the RIF results, we can now address the third research question to determine whether only an endowment effect explains the gap in social well-being between HSW and LSW countries or whether the coefficient effect is also at play.
5.4. Blinder–Oaxaca decomposition
presents a map of the two subgroups of countries, namely those countries with HSW and those with LSW. We analyse the gap in social well-being between these two subgroups of countries to answer the third research question. (For a full description of the two subgroups and their associated SWI scores, refer to Appendix B).
Figure 1. Two subgroups of African countries; those with higher, and those with lower levels of social well-being. Source: Created by the authors on mapchat.net.
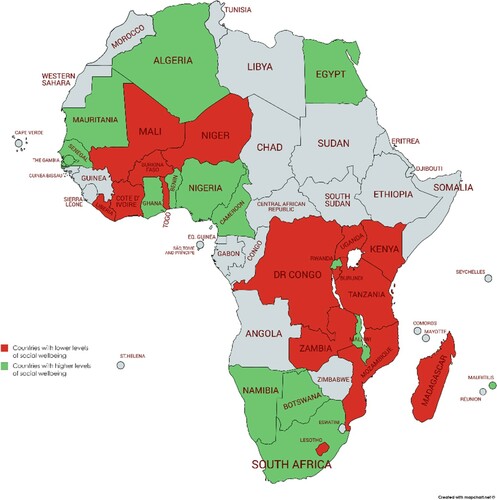
shows the BO decomposition results. The predicted mean social well-being scores for our sample of HSW and LSW countries are 75.164 and 61.299, respectively. Thus, yielding a social well-being gap of 13.865 or a difference of 23 per cent. We divide the social well-being gap into three parts; (i) endowment (characteristic), (ii) coefficient and (iii) interaction term.
The endowment effect: This is the difference in the outcome attributable to group differences in levels of a set of country characteristics between the HSW and the LSW groups. For our sample, it implies that the social well-being of LSW countries could increase by 11.3 if they had the same characteristics (endowments) as the HSW countries.
The coefficient effect: This effect arises from differentials in how the characteristics are associated with social well-being. In other words, it is the social well-being return on a change in the endowment (difference in social well-being when the endowment changes by 1 per cent). This portion would persist even if the LSW group were to attain the same mean levels of endowments as the HSW group and refers to the efficiency with which a country can convert a change in endowments to social well-being. For our sample, the coefficient effect explains 6.52 of the gap in social well-being.
The interaction term measures the simultaneous effect of differences in country endowments (characteristics) and coefficients. In our sample, the interaction term is not significant, but it is negative. Thus, it contributes to reducing the gap in the means by 3.92.
Table 7. Blinder-Oaxaca decomposition.
shows that the characteristics (endowment effect) that contribute to statistically significant differences between the two subgroups include: population density, the growth in household consumption, internet access, and employment. It stands to argue that if these characteristics in the LSW countries were to increase, it could reduce the social well-being gap.
According to , the population density should increase in LSW countries to narrow the gap in social well-being. This is because the population density in these countries is, on average, relatively lower than in the HSW countries, and the potential benefits have not yet been fully exploited. However, this poses a real problem to LSW countries, because higher population density contributes to higher levels of CO2 emissions (see discussion in Appendix A). African countries also rely heavily on fossil fuels to generate energy and increasing population density could increase Africa's contribution to global warming.
The growth in household consumption expenditure and employment opportunities should also increase. Seeing that African countries experience the most substantial migration flow from rural to urban centres, and with productivity in urban centres being three times as high as that of rural areas, this seems a viable policy area for governments to focus on to increase the consumption of households and employment levels (Hatch et al. Citation2019).
It is interesting to note that, according to the BO decomposition results, LSW countries should increase employment opportunities to have higher levels of social well-being. Yet, from the descriptive statistics in Table 9 (Appendix B), we note that LSW countries’ employment rates are higher than those of HSW countries. These are seemingly contradictory results. However, the answer lies in the second part of the BO decomposition, namely the coefficient effect. The reader will notice that the employment variable is negative (coefficient effect), thus decreasing the gap. This implies that HSW countries are more successful than LSW countries in converting one additional unit of employment into higher levels of social well-being (refer to our discussion in Appendix B on employment which was related to the spread of social well-being among African countries). Well-developed social welfare systems and policy measures that provide access to free (or subsidised) education, health care and basic services contribute to higher levels of social well-being in people, even when they are unemployed. The problem here is mainly one of feasibility.
Another area that should also increase is access to the internet, which is not surprising since it links up with higher levels of computer literacy, education, better economic integration, and directs governments to the UNESCO (Citation2014) mandate (see full discussion in Appendix A).
If one considers the coefficient effect, shows, that the differences in population density and capital investment are statistically significant. Population density's coefficient effect indicates that it is not merely the level of population density in the LSW countries that needs to increase, but also how it translates to social well-being. Higher population density must occur in the correct location, for the right reason and with the right policy in place. Skills and knowledge drive urbanisation, as well as fulfilling a need in industry development. Government policy associated with amenities, health, and educational services must be able to keep pace with urbanisation to achieve higher levels of social well-being. Although there is much variation across Africa, countries that experienced the highest levels of migration from rural to urban areas from 2007 to 2011 tended to subsequently also exhibit more significant gains in household consumption for the period from 2012 to 2017 (Hatch et al. Citation2019).
The coefficient effect regarding capital investment (as a percentage of GDP) shows that, even if the levels are the same in the two subgroups, the gap in social well-being will remain. Governments in HSW countries are more effective in turning one additional unit of capital investment into higher levels of social well-being than LSW countries. Possible reasons for the difference might be the likelihood of corruption and weak institutions that plague some African nations. According to Transparency International (Citation2019), three countries (Burundi, Republic of Congo and Mozambique), which form part of our LSW subgroup, are on the watchlist since their political leaders still need to demonstrate visible commitments to anti-corruption. On the other hand, Nigeria, Botswana, and South Africa (HSW countries) are all deemed ‘important countries to watch’, given their promising political developments. Corruption inhibits the efficiency and effectiveness of government policies, including the proper delivery of public monies to their intended ends (Warf Citation2017). Therefore, anti-corruption measures and the formulation of strong democratic institutions need to be a priority for LSW countries to create the effective use of capital investment.
Taking all of the above into consideration, five possible policy initiatives could improve social well-being in our LSW countries to catch up with HSW countries. First, increasing the population density in the right locations to get the most significant gains in social well-being. Second, increasing household consumption, for example, by tax breaks or transfer payments. Third, expanding the level of internet access. Fourth, creating more employment opportunities, for example, by encouraging foreign direct investment to create jobs. In addition, formulating anti-corruption strategies and strengthening institutions to improve the effectiveness of capital investment should receive attention.
6. Conclusions
In this paper, we constructed a composite measure of social well-being, specially adapted for the African context. After utilising an array of inequality measures, we found that there are severe inequalities among African countries. However, a single economic measure cannot capture the diversities of the inequalities and could give the wrong impression. The newly constructed SWI gives a more precise indication of the inequalities.
In further analyses, we used the composite SWI to establish which covariates determined social well-being inequality across African countries, making use of RIF regressions. The results showed that the following variables are statistically significant determinants of inequality and have a decreasing effect: employment opportunities for people in Africa, gender equality, and exports. On the other hand, emission levels, population density, public protests, capital investment, and internet access are significant and positively related to the variance in social well-being. Any increase in these variables contributes to higher inequality in social well-being. Thus, if equal societies contribute to higher levels of development, then African governments will need to formulate policy initiatives to steer the factors mentioned above in the correct direction (either increasing or decreasing as required) to reduce inequalities.
Furthermore, the BO decomposition technique allowed us to determine that the most substantial part of the social well-being gap, between countries with HSW and LSW, was due to the endowment effect. Upon further analysis, we found that an increase in the characteristics of LSW countries, such as population density, household consumption, internet access, and more employment opportunities, could reduce the social well-being gap. Lastly, the coefficient effect results revealed that population density and capital investments were significantly different in the two groups. It implied that even if population density and capital investments were at the same level in the two subgroups, social well-being would continue to differ. This could be because LSW countries do not have the same institutional capacity to translate changes in these characteristics into higher levels of social well-being.
Taking all of the above into consideration, it is clear that Africa is facing a conundrum of sorts. To increase equality in Africa, and for LSW countries to catch up with their counterparts, governments will have to implement an array of policies. One practical measure to increase social well-being could be for governments to increase capital investment in sustainable agriculture. There is a growing demand for food due to the high population growth rates, and therefore, the rural market has unexploited opportunities. By providing employment opportunities in the agricultural sector, population density would increase in the correct location. Such an initiative could attract unemployed youth by ensuring better working conditions, which would then also filter through to higher household consumption. Investment in sustainable agriculture could also ensure the development of rural areas through increased internet saturation, which unlocks pathways to higher levels of education.
The message to African governments is clear: policies directed at the sustained improvement in well-being equality should see policymakers promote sustainable growth and implement anti-corruption measures. These should be implemented while protecting and promoting social well-being through the delivery of developmental policies such as access to technology and greater gender equality.
Certain shortcomings of this study, which should be addressed in future research, may be overcome by including a larger sample of African countries as data availability increases. Our study may exhibit some selection bias, in that those countries with a lack of data might also suffer from lower social well-being.
Disclosure statement
No potential conflict of interest was reported by the author(s).
Notes
1 Happiness or life satisfaction are important subjective measures of well-being, but given that many African countries only have access to objective indicators, we focus on objective indicators so that our index could help formulate future policymaking.
2 We define well-being as those aspects of life that society collectively agrees are important for a person’s quality of life and welfare.
3 Also see Arellano and Bover (Citation1995) and Tabachnick and Fidell (Citation2007).
4 For a discussion of RIF regressions, see Firpo et al. (Citation2009) and for applications, see Kollamparambil (Citation2020) and Becchetti et al. (Citation2014).
8 The data sourced by Global Economy includes, but is not limited to the following authorities; the World Bank, the United Nations, the International Monetary Fund, the U.S. Energy Information Administration, UNESCO, the World Economic Forum, and many others.
9 See table 10 in Appendix C for the driving factors of inequality on the dimension indices included in the SWI.
10 Public protests represent a democratic way of voicing demands. Public protests, are defined as strikes or any type of demonstration with political, economic or social motives, and are tracked on a daily basis via news reports by journalists and press agencies across Africa and verified by AFP and Reuters. Each relevant event is counted and then weighted based on such factors as intensity, duration, number of casualties, etc. This indicator combines 4-value variables (with a scale of 0 to 3: 0: non-occurrence, 1: occurrence but weak intensity, 2: medium intensity and 3: strong intensity)
References
- Adusah-Poku, F, 2016. Carbon dioxide emissions, urbanisation and population: Empirical evidence in Sub-Saharan Africa. Energy Economic Letters 3(1), 1–16.
- African Development Bank, the African Union Commission (AUC), and the UN Economic Commission for Africa (ECA), 2016. Africa Regional Integration Index Report, 2016. https://www.integrate-africa.org/.
- African Development Promise, 2020. Building Pathways to Economic Independence. https://www.africadevelopmentpromise.org/.
- African Union, 2015. ‘“Agenda, 2063. The Africa We Want. First Ten-year Implementation Plan 2014-2023. A Shared Strategic Framework for Inclusive Growth and Sustainable Development’. http://www.un.org/en/africa/osaa/pdf/au/agenda2063first10yearimplementation.pdf.
- Anyanwu, JC, Erhijakpor, AEO & Obi, E, 2016. Empirical analysis of the Key Drivers of income inequality in West Africa. African Development Review 28(1), 18–38.
- Arellano, M & Bover, O, 1995. Another look at the instrumental variable estimation of error-components models. Journal of Econometrics 68, 29–51.
- Asongu, S, 2014. African development: beyond income convergence. South African Journal of Economics 82(3), 334–353.
- AUC/OECD, 2018. Africa's development Dynamics 2018: growth, jobs, and inequalities. AUC, Addis Ababa/OECD Publishing, Paris.
- Bardhan, P, 2006. Institutions and development. In Clark, D (Ed.). The Elgar Companion to development studies. Edward Elgar Publishing, Cheltenham, UK, 2–56.
- Barro, RJ, Mankiw, GN & Sala-i-Martin, XX, 1995. Capital mobility in neoclassical models of growth. The American Economic Review 85(1), 103–115.
- Becchetti, L, Massari, R & Naticchioni, P, 2014. The drivers of happiness inequality: suggestions for promoting social cohesion. Oxford Economic Papers 66(2), 419–442.
- Bussmann, M, 2009. The effect of trade openness on women's welfare and work life. World Development 37(6), 1027–1038.
- Cahill, MB, 2005. Is the human development index redundant? Eastern Economic Journal 31(1), 1–5.
- Clark, A & D'Ambrosio, C, 2017. Living conditions and well-being. Evidence from African countries. WIDER Working Paper 2017/209.
- Deaton, A, 2013. The great Escape. health, Wealth, and The Origins of inequality. Princeton University Press, Princeton, NJ.
- De Haan, N & Sugden, F, 2015. Including women and the poor in water management systems. Brief for the Global Sustainable Development Report 2015.
- Department of Economic and Social Affairs (DESA). (2008). Achieving sustainable development and promoting development Cooperation. Dialogues at the economic and social Council, United Nations. United Nations Publications, New York. ISBN: 978-92-1-104587-1
- Drèze, J & Sen, A, 1991. Hunger and public action. Oxford University Press, Oxford.
- Duflo, E, 2012. Women empowerment and economic development. Journal of Economic Literature 50(4), 1051–1079.
- Firpo, S, Fortin, NM & Lemieux, T, 2009. Unconditional quantile regressions. Econometrica 77(3), 953–973.
- Greyling, T & Rossouw, S, 2016. Non-economic quality of life and population density in South Africa. Social Indicators Research 134(3), 1051–1075.
- Groh, AP, von Liechtenstein, H & Lieser, K, 2010. The European Venture capital and Private Equity country attractiveness indices. Journal of Corporate Finance 16(2), 205–224.
- Hagerty, M. R. & Land, K. C. (2012). Issues in composite index Construction. In Land, KC (Ed) The well-being of America's children: developing and improving the child and youth well-being index. Springer, New York, 143–160.
- Hatch, G, Becker, P & Van Zyl, M, 2019. The Dynamic African Consumer Market: Exploring Growth Opportunities in Sub-Saharan Africa. https://www.researchgate.net/publication/265430688_The_Dynamic_African_Consumer_Market_Exploring_Growth_Opportunities_in_Sub-Saharan_Africa.
- Helliwell, JF, Huang, H & Wang, S, 2016. The distribution of world happiness, in World Happiness Report 2016, pp. 8-49, United Nations.
- Helliwell, JF, Layard, R & Sachs, J (Eds.), 2012. In World happiness Report 2012. Sustainable Development Solutions Network, New York.
- Helliwell, JF, Layard, R & Sachs, J (Eds.), 2015. In World happiness Report 2015. Sustainable Development Solutions Network, New York.
- Jha, CK & Sarangi, S, 2015. Women and corruption: What positions must they hold to make a difference? Journal of Economic Behavior & Organization 151, 219–233.
- Jordá, V, Trueba, C & Sarabia, JM, 2015. Evolution of global inequality in human well-being: a sensitivity analysis. International Journal of Computational Economics and Econometrics 5(1), 108–125.
- Kalmijn, W & Veenhoven, R, 2005. Inequality of happiness in nations. Journal of Happiness Studies 6, 357–369.
- Kollamparambil, U, 2020. Happiness, happiness, inequality, and income dynamics in South Africa. Journal of Happiness Studies 21, 201–222.
- Land, KC, 2014. Composite index Construction. In Michalos, AC (Ed.), Encyclopedia of quality of life and well-being research. Springer, Dordrecht, 1152–1156.
- Leibbrandt, M, Finn, A & Woolard, I, 2012. Describing and decomposing post-apartheid income inequality in South Africa. Development Southern Africa 29(1), 19–34.
- Madden, D, 2010. Gender difference in mental well-being: a decomposition analysis. Social Indicators Research 99, 101–114.
- Martinez, M & Mlachila, M, 2013. The quality of the recent high-growth episode in Sub-Saharan Africa. International Monetary Fund Working Paper, No. 13/53.
- Mazziotta, M & Pareto, A, 2017. Synthesis of indicators: the composite indicators approach. In Maggino, F (Ed.), Complexity in society: from indicators Construction to their Synthesis. Springer, Cham, 159–191.
- McGillivray, M & White, H, 1993. Measuring development? UNDP's human development index. Journal of International Development 5(2), 183–192.
- Neumark, D, 1995. Employers’ discriminatory behaviour and the estimation of wage discrimination. Journal of Human Resources 23, 279–295.
- Nussbaum, MC, 2000. Women and human development: The capabilities approach. Cambridge University Press, Cambridge.
- OECD, 2008. Handbook on Constructing Composite Indicators. Methodology and User Guide. http://www.oecd.org/els/soc/handbookonconstructingcompositeindicatorsmethodologyanduserguide.htm.
- OECD, 2013. Trust in government, policy effectiveness, and the governance agenda. In Government at a glance 2013. OECD Publishing, Paris. https://www.oecd-ilibrary.org/docserver/gov_glance-2013-6-en.pdf?expires=1556232425&id=id&accname=guest&checksum=10CE0326D305569308EF042036C62B6F
- Porter, ME, Stern, S & Green, M, 2017. SPI 2017. Social Progress Imperative, 2017. https://www.socialprogress.org/assets/downloads/resources/2017/2017-Social-Progress-Index.pdf.
- Rotberg, RI, 2003. Failed states, collapsed states, weak states: Causes and indicators. In RI Rotberg (Ed.), State failure and state weakness in a time of terror. World Peace Foundation, Cambridge, 1–28.
- Sachs, JD, 2015. Africa's demographic transition and economic Prospects. In Monga, C & Lin, JY (Eds.), The Oxford Handbook of Africa and Economics: Volume 2: Policies and Practices. Oxford University Press, New York, 431–448.
- Sachs, JD, Schmidt-Traub, G, Kroll, C, Lafortune, G & Fuller, G, 2018. SDG index and Dashboards Report 2018. Bertelsmann Stiftung and Sustainable Development Solutions Network (SDSN), New York.
- Sachs, JD & Warner, AM, 1997. Sources of slow growth in African economies. Journal of African Economies 6(3), 335–376.
- Sahn, D.E & Younger, SD, 2007. Inequality and poverty in Africa in an era of globalisation: Looking beyond income to health and education, Research Paper, UNU-WIDER, United Nations University (UNU), No. 2007/74, ISBN 978-92-9230-027-2.
- Sala-i-Martin, XX, 1997. What have we learned from recent empirical growth research? I just ran two million regressions. The American Economic Review 78(2), 178–183.
- Sapkota, JB, 2010. Globalisation’s convergence effect on human quality of life (QOL) in Asia: Evidence from the KOF index of globalisation. Asian Regional Integration Review 2(1), 1–28.
- Sen, AK, 1993. Capability and well-being In Nussbaum, M. & Sen, AK. (Eds) The quality of life. Claredon Press, Oxford (UNU-WIDER), 30–53.
- Shimeles, A & Nabassaga, T, 2017. Why is inequality high in Africa? African Development Bank Group Working Paper, No. 246.
- Stiglitz, JE, 2017. The Measurement of Economic Performance and Social Progress. Presentation. International Economic Association World Congress, Mexico City, 19 June 2017.
- Stiglitz, JE, Sen, A & Fitoussi, J, 2009. Report by the Commission on the Measurement of Economic Performance and Social Progress. https://www.economie.gouv.fr/files/finances/presse/dossiers_de_presse/090914mesure_perf_eco_progres_social/synthese_ang.pdf.
- Tabachnick, BG & Fidell, LS, 2007. Using multivariate statistics. 5th ed. Allyn & Bacon/Pearson Education, Boston, MA.
- The Sustainable Development Goals Center for Africa and Sustainable Development Solutions Network, 2018. Africa SDG Index and Dashboards Report 2018. Kigali and New York: The Sustainable Development Goals Center for Africa and Sustainable Development Solutions Network.
- Transparency International, 2019. 2018 Corruption Perceptions Index – Results, available at https://www.transparency.org/cpi2018.
- United Nations (UN), 2018. The Sustainable Development Goals Report, 2018. https://unstats.un.org/sdgs/files/report/2018/TheSustainableDevelopmentGoalsReport2018-EN.pdf.
- United Nations Development Program (UNDP), 2015. Training Material for Producing National Human Development Reports. Revised by Kovacevic, M. and Calderon, C., March 2015. http://hdr.undp.org/sites/default/files/hdi_training.pdf.
- United Nations Educational, Scientific and Cultural Organization (UNESCO), 2014. UNESCO Education Strategy, 2014–2021. http://unesdoc.unesco.org/images/0023/002312/231288e.pdf.
- UN Women, 2014. The World Survey on the Role of Women in Development, Gender equality and sustainable development. https://www.unwomen.org/en/digital-library/publications/2014/10/world-survey-2014.
- Warf, B, 2017. Geographies of African corruption. PSU Research Review 1(1), 20–38.
- Wilkinson, RG & Pickett, KE, 2009. Income inequality and social Dysfunction. Annual Review of Sociology 35, 493–511.
- World Bank, 2018. Poverty and Shared Prosperity 2018: Piecing Together, the poverty Puzzle. World Bank, Washington, DC.
- World Inequality Lab, 2018. World Inequality Report 2018. https://wir2018.wid.world/files/download/wir2018-full-report-english.pdf.
Appendices
Appendix A
A discussion on the developmental and economic implications of the variables that significantly explain the inequality in social well-being.
From the results in (section 5.3), it stands to argue that when the rate of employment increases across African countries, the variance in social well-being inequality will decrease. Poorer nations stand to benefit more from increasing returns on factors of production (labour), than the wealthier countries, which might lead to a more equal spread of social well-being (also see section 5.3 in this regard). African governments have a great deal of scope for effective policy initiatives to increase employment opportunities for the continent.
Higher levels of equality among African countries can also be achieved through increased exports. There is a considerable difference between exports recorded among African countries, with Burundi exporting 8 per cent of GDP per year, on average, compared to the Republic of the Congo that exports 76 per cent of GDP, on average, per year. Therefore, to reduce inequality in Africa, countries with lower levels of exports should strive to increase their export ratios. However, African countries must be aware of the dangers of depending on a single export product, which in the African context is often natural resources or primary products. The policy should not only focus on increasing exports, but also on diversifying exports to include secondary and tertiary products, as well as services.
Our results on the gender equality variable echo those of Duflo (Citation2012) and Nussbaum (Citation2000). To make the most significant impact on social well-being through economic development, societies must empower and invest in women, thereby ensuring greater gender equality. Using the indicator, the number of females in parliament, as a measure of gender equality, high levels of gender inequality among African countries are revealed. For example, in Nigeria, only 9 per cent of parliament is female and in Mali 13 per cent. In contrast, in Senegal and South Africa, there is 64 per cent and 66 per cent female representation, respectively. According to the Gender Inequality Index, Sub-Saharan Africa has a value of 0.569 (0 equals perfect equality, and 1 equals perfect inequality) compared to the OECD, which has a much more equal gender society with a value of 0.186 for the year 2017 (UNDP 2018). Bussmann (Citation2009) argues that gender equality could have spillover advantages, such as an increased level of trade openness and higher development. Lastly, in a cross-country analysis of over 125 countries, Jha and Sarangi (Citation2015) found that corruption is lower in countries where a greater share of parliamentarians are women.
Together with our results regarding increased export levels, it is clear why the United Nations have a mandate to formulate policies strengthening and broadening women's universal rights. For example, in Africa, which still relies on the agricultural sector (Adusah-Poku Citation2016), improving women's access and rights to water plays a critical role in its productive use in agriculture. Additionally, including women in water management decisions and supporting female farmers increases agricultural productivity. It also helps reduce gender discrimination and offers opportunities for women to gain confidence and control over their lives, which enhances their productive economic potential (De Haan & Sugden Citation2015). Therefore, to have higher levels of equality in Africa, gender disparities should be addressed imminently by policymakers.
On the other hand, emission levels, population density, public protests, capital investment, and internet access are significant and are positively related to the variance in social well-being. Any increase in these variables contributes to a wider spread of social well-being and therefore, higher levels of inequality.
To achieve a more equal distribution in social well-being, CO2 emissions and population density must decrease. A problem arises as a nexus exists between these two variables and economic growth. We know that a positive relationship exists between economic growth, population growth, and higher levels of CO2 emissions (Adusah-Poku Citation2016). Seeing that Africa has one of the highest population growth rates in the world (2.7 per cent in the year 2017 compared to the world average of 1.2) it is clear that this region will face pressures on land to meet food demands. Ceteris paribus, its share of global CO2 emissions over the coming decades will increase (Adusah-Poku Citation2016), which is in contradiction to the goal of sustainable development.
This is a problem since the average population density in the sample is 106 people per square kilometre, with a wide range from only three people in Botswana and Namibia to 483 in Rwanda and even higher still in Mauritius with 620. Nonetheless, the average population density in Africa is significantly higher than the OECD's 37 and the USA's 35 people per square kilometre. If Africa has any chance to increase the well-being of its people, it needs to get population growth under control. However, Africa's delayed demographic transition to low mortality and low fertility poses a severe risk. As Sachs (Citation2015) argues, a low-fertility trajectory has the characteristics of a lower population growth rate. Lower population growth will lead to a lower youth dependency ratio and a higher ratio of arable land to population, rate of urbanisation, level of schooling, level of human capital, total factor productivity, and GDP per person. Ultimately, accelerating the demographic transition would make it possible to limit the increase in Africa's future population substantially, and thereby accelerate urbanisation, schooling, technological advancement, and economic growth without an increase in CO2 emissions.
On average, for the period 2006–2016, the public protestFootnote10 coefficient was 2.5 in African countries. However, this number varies significantly among the countries, with South Africa recording a coefficient of 14 and Gambia only 0.02. Public protests correlate highly with the level of corruption (+), property rights (−), government effectiveness (−) accountability (−) and political stability (−) (Rotberg Citation2003, DESA Citation2008). A weak performance in any of these indicators contributes to higher levels of inequality among countries. Thus those countries that are governed well have much higher levels of social well-being than those that are not.
As discussed, in greater detail in section 5.3, capital investment plays a significant role in reducing the inequality in social well-being. It is not as easy as merely increasing the capital investment as a percentage of GDP. It is the effectiveness of the government, which will determine whether and by how much it decreases inequality between countries’ social well-being. For the African countries in our sample, the average capital investment as a percentage of GDP is 24 per cent over the period, and it also varies significantly between countries such as Niger's 13 per cent and Mauritania’s 44 per cent.
Access to the internet is on average, for all African countries in the sample, 10.2 per cent of the population over the period. There is vast inequality when it comes to internet access, with 1.2 per cent of the people in Niger and 33 per cent in Mauritius having access. Internet access, which links up with higher levels of computer literacy and education, could extend greater opportunities to individuals through developments in the areas of information and communication technology (ICT). The ability of some African countries to take advantage of these developments, while others do not, have an increasing effect on social well-being inequality. If African countries that lag behind could invest and develop this sector, it would allow Africa as a whole to not only increase development, but also fulfil the mandate that was set by the United Nations Educational, Scientific and Cultural Organization (UNESCO Citation2014). The organisation supports member states in using ICT in innovative ways to accelerate the pace and quality of the progress made.
To summarise, the factors that play a role in the unequal distribution of social well-being are employment opportunities for people in Africa, gender equality, exports of products, emission levels, population density, public protests, which are related to weak governance, capital investment, and internet access. Addressing these factors could contribute to more equal levels of social well-being across the African continent.
Appendix B
A detailed description of subgroups
provides the countries as well as their SWI scores for the two subgroups used in the Blinder-Oaxaca decomposition (also seen in , section 5.2). shows that nearly half of the countries belonging to the lower social well-being (LSW) group comes from West Africa, with almost the same number from East and Southern Africa and only one country from Central Africa. According to SDGCA & SDSN (Citation2018), the Economic Community of West African States’ (ECOWAS) main challenges include health, basic infrastructure, gender equality and energy.
For East Africa, basic infrastructure is the main challenge followed by health, peace and justice, hunger and energy. Additionally, only modest progress has been made towards gender equality and economic growth (SDGCA & SDSN Citation2018). The best-performing country in the LSW subgroup is Kenya that also scored top place according to the Africa Regional Integration Index (AUC/ECA Citation2016) underlying the importance of regional relationships to achieve development in terms of well-being.
LSW countries have significant differences in, for example, real GDP per person and population size. However, their social well-being scores are closely dispersed (standard deviation of 6.1), with a mean social well-being score of 61.3. The countries with the lowest and highest income in this group, are Burundi (US$748) and Tanzania (US$5542), respectively. Interestingly, these countries show quite a reversed ranking if social well-being is considered, with Burundi having a SWI of 68 and Tanzania 59. This echoes our argument that income gives an inaccurate indication of the well-being “outcome” in African countries.
Those countries with higher levels of social well-being (HSW) represent all areas of Africa. Southern Africa is a diverse region, comprising a mix of upper-middle-income and low-income-countries. The main challenges of the Southern African Development Community (SADC) are health, nutrition, basic infrastructure and peace and justice (SDGCA & SDSN Citation2018).
Northern African countries perform better on nutrition, although gender equality is still a critical issue with all countries projected not to meet this goal by 2030. Other main challenges include peace and justice, and lack of strong institutions. All countries in North Africa, except Libya, are on track to meet the poverty goal by the deadline, but record only moderate progress across health and basic infrastructure (SDGCA & SDSN Citation2018).
Table 8 African countries, according to subgroup.
Unfortunately, Central Africa is the worst-performing region of the continent. This region's main challenges include health, peace and justice, and basic infrastructure. Central Africa occupies a critical position on the continent as it shares boundaries with all the other regions, and therefore plays an integral part in facilitating the necessary regional partnership for this continent. Nonetheless, of all five regions, this one scores lowest in partnership and regional integration. Of concern is the regression of this region in three goals: water and sanitation, cities, and peace and justice (SDGCA & SDSN Citation2018).
HSW countries have a mean social well-being score of 75.16, and it varies between Algeria scoring 91.03 and Rwanda scoring 70.87, representing a 28-percentage difference. These countries have a mean real GDP per person (PPP) of US$7 038.43 and, as we found for the lower social well-being countries, it varies significantly. Malawi has a real GDP person of US$1 088 while Mauritius reports theirs at US$18 864, which is 17 times more than that of Malawi. Although this is a very diverse group of countries, especially considering income levels, we notice that the social well-being levels in these countries are similar, once again indicating that results given by income measures can present a distorted version of well-being.
We include the same variables used in the RIF estimations for the Blinder-Oaxaca decomposition analysis. In , we give the mean and standard deviation of the variables per subgroup, thus countries with higher (HSW) and lower social well-being (LSW). From the descriptive analysis, we notice that there are considerable differences in the levels of household consumption and internet access between the two groups. HSW countries have significantly higher levels of consumption expenditure, as well as internet access, than the LSW countries. These differences likely contribute to the gap in social well-being between these subgroups of countries. The Blinder-Oaxaca decomposition analysis will allow us to investigate this possibility further.
Table 9 Descriptive statistics of the subgroups of countries used in the Blinder-Oaxaca decomposition analysis.
Contrary to expectations (also see Appendix A), we find that the employment level of countries with HSW is significantly lower than those countries with LSW. This could be an indication of government policy towards the provision of basic services, education, and health care. Often one will find that in the countries with HSW, governments subsidise or even provide free basic services, education and health care. Unfortunately, we cannot say the same about countries with LSW. The results on the Blinder-Oaxaca decomposition (section 5.4) provide more detailed explanations of the observed differences in the mean levels of social well-being between these two subgroups of countries.
Appendix C
Table 10 Driving factors of inequality in the dimension indices included in the SWI.