
ABSTRACT
Regional integration is making steady progress in Africa and a key objective is to improve the prospects for industrialisation by expanding the regional market. The paper draws on a combination of trade data analysis and industry case studies to better understand the links and synergies between regional value chains and regional integration. The trade data and case studies of two diverse sectors (garments and food retailing) demonstrate the expansion and diversity of regional trade and regional value chains in Ssouthern Africa. This increasingly diverse composition of regional exports is suggestive of an opportunity to further enhance industrial development through intra-regional trade. From a political economy perspective, the long term sustainability of Southern African regionalism will require that the benefits are widely spread. In turn this requires the recognition of the importance of regional industrial policy, which takes account of the dynamics driving global and regional value chains and facilitates regional linkages.
1. Introduction
Regional integration is making steady progress in Africa and a key objective is to improve the prospects for industrialisation by expanding the regional market (African Development Bank, Citation2019). But there is a long way to go in converting overarching agreements into actual free, regional trade. The difficulties of achieving full scale regional integration are well known. While there are huge benefits for the region as a whole, these are unevenly distributed especially at the sectoral level. Policy makers driving the process need to be able to demonstrate widespread gains to get buy in by all participants including economic agents. Indeed, in most successful examples of regional integration, economic stakeholders have been major drivers and there are strong links and synergies between regional integration and the development of regional value chains (RVCs).
The familiar narrative on African trade is that it is characterised by dependence on raw material exports, low levels of regional integration, poorly developed RVCs and, in the case of intra-regional trade in southern Africa, a very lopsided trade balance in favour of South Africa. However, on closer examination a more nuanced picture emerges. Firstly, intra-regional exports are far more focused on manufactured goods than is the case for exports in general. Secondly, levels of intra-SADC trade are rising as a share of total trade (i.e. trade is becoming more regionalised) and there is evidence of the emergence of RVCs. Thirdly, there are clear emerging examples of dynamic export growth of manufactured goods to South Africa from the other countries of the region. To some extent these developments are also indicative of emerging RVCs.
This paper explores these issues. Section two establishes a framework for understanding RVCs and their link to regional integration. Section three uses aggregate trade data to provide an overview of SADC trade patterns and participation in regional and global value chains. In section four these developments are then analysed in two sectors: the apparel industry and the food sector and its associated retail chains. Section five concludes.
2. Understanding global and regional value chains and their link to regional integration
Global value chains (GVCs) and RVCs are essentially about global and regional linkages, and hence exports and imports play an important role in fostering industrial employment (Kaplan & Morris, Citation2016). They are driven by lead firms exercising power (i.e. governance) over chain activities ensuring suppliers meet standards required to deliver appropriate products and processes into final markets, economic efficiency, as well as social and environmental consumer demands.
Less explored in the literature is the relationship between RVCs, GVCs and regional integration. RVCs are differentiated by having critical constituent linkages located in a region. Their key defining characteristics involve particular ways of exporting into external markets, building cross border supply chains, and expanding lead firm FDI to create specific sourcing patterns. In the broadest conception this encompasses both investment and market linkages located in a region. This usually requires a regional economic hub playing the critical role of driving regional investment and end markets for regional lead firms and suppliers.
RVCs therefore involve some of the following characteristics: (1) Firms sourcing cross-border regional inputs, assembling them, and exporting to lead firms in global markets. This grows regional integration through regional supply chain linkages and creates scale economies. (2) Firms sourcing cross-border regional inputs or final products, and supplying a lead firm in an economic hub in the regional market. This grows regional integration through expanding the regional market for final products and regional supply chains for intermediate goods. (3) Regional lead firms creating subsidiaries in another country in the region (or small firms simply relocating there) and supplying markets in the regional economic hub. This expands regional integration, encompassing regional investment as well as regional supplier sourcing.
Therefore, insofar as RVCs enable the movement of goods, people and capital across borders, they substantially facilitate regional integration. If RVCs establish access to larger markets (global or regional) enabling firms to achieve scale and expand the volume of output they aid simple regional integration. When RVCs promote learning and build dynamic, specialised capabilities (of managers and workers) within firms enabling complex production activities they deepen regional integration. Inasmuch as RVCs create backward, forward and horizontal linkages of value addition between firms across borders contributing to complex structural change they extend the breadth of regional integration. Hence regional integration is often integrally intertwined with RVC expansion.
3. Intra-regional trade flows in Southern Africa
This section uses recent trade data to present a background overview of trade integration in southern Africa. Its objective is to analyse the extent to which southern African economies, defined here as members of SADC, have been integrated into the global and regional economy. The first part draws on gross export and import data. However, with the fragmentation of production and the emergence of global value chains (GVCs) as a key driver of export performance, conventional trade statistics can be a misleading measure of the value produced by a country. Consequently, the second part of this section draws on valued added trade data.
3.1. Intra- and extra- Southern African trade in goods
The story of SADC’s share of world trade in the second half of the twentieth century was one of declining world market share (Amjadi et al., Citation1996). From 2000, however, the value of exports from SADC countries rose, largely in response to the global commodity price boom. From a level of just under US$50 billion in 2000, SADC exports rose to US$225 billion 2011, but then declined to US$168 billion in 2017 with the collapse in commodity prices. Trends in the share of SADC in world exports followed a similar trend.Footnote1
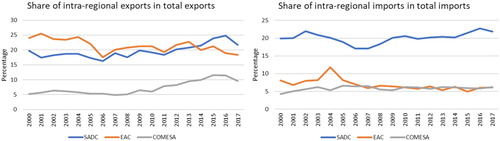
shows that regional trade within SADC also grew strongly during this period, both in value terms and as a share of total exports, rising from 20% in 2000 to 25% in 2016, with particularly strong increases from 2011. This growth in exports was driven by relatively strong growth of the region as well as the reduction of tariff barriers with the implementation of the free trade agreement from 2000 (IMF, Citation2018:20).Footnote2 Looking at imports, intra-SADC trade shares fell initially to the mid-2000s, but subsequently rose reaching 23% in 2016. The post-2000 period is therefore one characterised by rising importance of southern Africa in world trade as well as increasing integration in the regional market.
Figure 1. SADC share of world trade.
Notes: Regions are Common Market for Eastern and Southern Africa (COMESA), East African Community (EAC) and Southern African Development Community (SADC). South African exports to Botswana, Lesotho, Namibia and eSwatini are estimated for the 2000–2009 period using their average share in total South African exports over the 2010 and 2011 period. Shares are based on the aggregated value of trade for the region. Source: Author’s illustrations based on IMF DOTS, accessed January 2019.
Looking within the regions, trade performance varies substantially across countries. presents the share of total exports sold into the southern African region for SADC countries over the years 2000 and 2017. The share of exports sold into the SADC region rose for almost all countries, reflecting widespread integration across Southern Africa. Contrary to concerns regarding low levels of regional integration, trade for many countries is highly regionalised, even compared to the highly integrated Asian and European regions. For instance, intra-SADC export shares exceed 30% for Lesotho, Malawi, Namibia, eSwatini, DR Congo and Zimbabwe.
Table 1. Intra-Southern African exports as share of total exports.
The data for imports presented in reveal a more diverse pattern of changes in the share of imports being sourced from the SADC region with fewer countries experiencing rising shares over the period 2000–17. However, the dependency on imports from the region is higher compared to exports, with 9 of the countries sourcing more than 30% of their total imports from SADC partners in 2017. Overall, patterns of integration are mixed across the region, suggesting caution in using aggregate levels of intra-regional trade shares as reflective of country-level performance.
Table 2. Intra-Southern African imports as share of total imports.
Substantial asymmetries in intra-regional trade flows are also present. As the dominant economy in the region, South Africa is the major source of intra-regional exports as well as the primary regional market for other SADC country exports. Indeed, South Africa supplied 88% of other SADC member imports from the region in 2000 (). This share fell to 71% in 2017 as SADC countries diversified imports to other SADC member countries and the rest of the world.
Two further insights emerge from the asymmetry in economic size and trade flows of South Africa. Firstly, although South Africa is a major market for goods from the region, it still only sources a relatively low share of its total imports from the region (7% in 2017) although this has grown rapidly from a tiny base. In contrast, a relatively high proportion of its total exports (23% share in 2017) are sold to the region.Footnote3 Consequently, South Africa runs a large trade surplus with the region although this has stabilised at around US$14 billion over the post-2010 period. Secondly, levels of integration into the region are relatively low once South Africa is excluded as a destination or source market. The moderate levels of regional integration found for the region thus primarily reflect SADC country trade patterns with South Africa.
A further distinctive feature of regional trade in SADC is that the product composition of exports is oriented more towards manufactured goods compared to the region’s exports to the rest of the world. presents the share in the value of total intra- and extra-SADC trade accounted for by Manufacturing, Fuels, Food, Ores & metals and Other products. Manufactured goods make up half of intra-SSA exports, compared to slightly less than a quarter for exports to outside of SADC. Exports to countries outside of SADC are dominated by Fuels (Angola) and Ores & metals. Country level analysis reveals similar patterns with manufacturing accounting for higher shares of exports to the region than the rest of the world for nearly all SADC countries.
Figure 2. Composition of intra- and extra-SADC trade in goods 2015 (%).
Notes: Mirror data is used for Comoros, Lesotho & eSwatini. The SITC Revision 2 product 667 (Pearls, Precious and Semi-Prec. Stones) is included in Ores & Metals to reflect the commodity nature of this product. Share composition based on total value of SADC trade. Source: Author’s calculations using UNComtrade data.
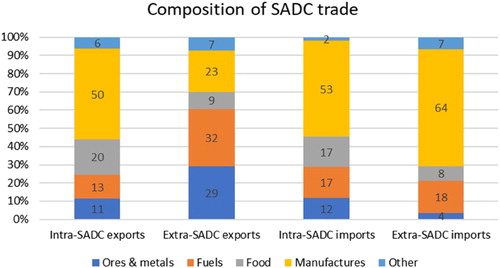
This composition of regional exports is suggestive of an opportunity to enhance industrial development through intra-regional trade. Further, with the rising importance of GVCs in driving manufacturing exports, there is a potential to leverage off regional trade to build and deepen RVCs.
3.2. SADC country participation in global value chains and regional value chains
While trade in goods across regions is illustrative of the extent to which markets are integrated, the challenge posed by the data is that it cannot easily be used to unpack how firms across countries are integrated into production networks, either GVCs and/or RVCs. The gross value of exports does not represent the local value added as production, particularly of manufactures, frequently requires the use of imported intermediate inputs. This is an example of backward vertical integration whereby foreign value added is embodied in a country’s exports. In addition, a country can also participate in GVCs or RVCs by being a supplier of inputs used in third countries for further exports. This is commonly referred to as indirect value added or forward integration (Koopman et al., Citation2010; De Backer & Miroudot, Citation2013).
To evaluate SADC participation in GVCs, this section draws upon the UNCTAD-Eora Global Value Chain Database (Lenzen et al., Citation2013) as it provides the most comprehensive coverage of value added exports across African countries (45 countries in SSA) up to 2018. The data are not without their limitations with missing input-output tables for some African countries imputed. Further, the data do not establish the nature of the relationships between firms that constitute the supply chains, implying that the trade flows cannot necessarily be assumed to reflect value chains. We therefore only use this data only as indicative of SADC country participation in value chains.
Two key indicators are used. The first indicator is a measure of backward integration measured as the share of foreign value added (FVA) in gross exports. The indicator is likely to be higher if exporters are involved in more downstream activities. As argued by Farole (Citation2016), backward integration provides access to quality inputs that can contribute towards downstream competitiveness and productivity spillovers through access to global frontier technologies. The second indicator is a measure of forward integration (indirect value added) and is calculated as the domestic value added embodied in exported intermediate inputs used to produce other countries’ exports (DVX) expressed as a ratio of gross exports. High levels of forward integration in developing countries can often be associated with the export of resources, with firms located upstream in the value chain.Footnote4
presents the mean forward and backward indicator for selected regions, including SADC, for 2015. Surprisingly, the level of GVC integration, as measured by the sum of the two indicators, is on average high amongst SADC countries compared to the world average and even when compared against the ASEAN region. The data suggest that SADC countries do not lag others in terms of their integration into global value chains.
Figure 3. GVC participation decomposed into forward and backward integration 2015.
Note: Backward integration is calculated as the foreign value added share in gross exports. Forward integration is calculated as the domestic value added embodied in intermediate inputs used in other country exports as a share of gross exports. Values reflect the average across countries within each group. Source: Author’s calculations using the UNCTAD-Eora Global Value Chain Database.
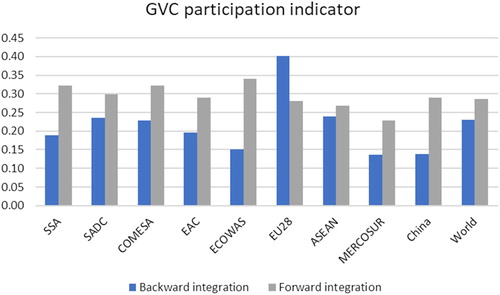
The figure illustrates several additional features about GVC participation by SSA and SADC countries. Advanced economies (EU 28) tend to locate in downstream activities and have higher levels of backward integration, a finding corroborating that of Del Prete et al. (Citation2017). SADC (and SSA) countries, in contrast, are on average located more upstream with relatively high shares of their value-added exports embodied as intermediate inputs in other countries’ exports (forward linkage). This reflects the resource-intensive composition of the regions exporters.
To compare GVC participation across SADC countries further, presents the backward integration indicators for each SADC country. These indicators are further decomposed to show the origin or destination (SACU, rest of SADC (RSADC) and rest of world (ROW)) of the value added in the backward integration indicators. The components associated with SACU and RSADC are thus an indicator of the contribution of SADC RVCs in each country’s GVC participation.
Figure 4. Backward integration into SADC and rest of world by SADC country, 2015.
Notes: SACU denotes Southern African Customs Union, RSADC denotes SADC excluding South Africa and ROW denotes rest of world. The data for Zimbabwe has been excluded as it shows unrealistic levels of integration, that are also apparent when looking at the disaggregated product data. Source: Author’s calculations using the UNCTAD-Eora Global Value Chain Database.
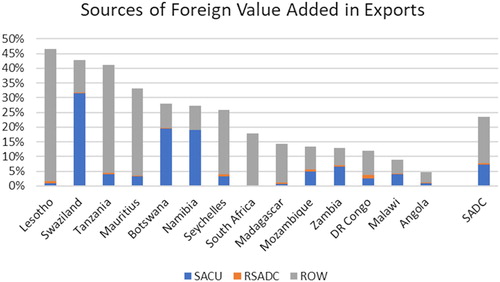
Looking at , Lesotho, eSwatini, Tanzania and Mauritius all have strong backward integration linkages with foreign value added making up between 33 and 47% of the gross value of exports. These countries tend to have low indicators of forward integration pointing to a more downstream location in the value chain. On the other extreme are Angola and Malawi with foreign value added shares of less than 10% and relatively high measures of forward integration reflecting the resource composition of their exports.
The source of foreign value added also differs across SADC countries. On average, foreign value added sourced from the region comprises 11% of the value of gross exports across SADC countries (), although this almost entirely reflects imports from South Africa. The regional value added share in gross exports is very high for Namibia, eSwatini and Botswana (20–30% of gross exports) reflecting the importation by these countries of intermediate inputs from South Africa for the production of final goods for consumption in the South African market.Footnote5
In contrast, the regional value added share in exports for South Africa is low suggesting that firms in South Africa, the regional hub, are failing to develop or draw on RVCs to enhance their export performance.
The forward linkages into SSA are very low with the indirect value added from SADC countries into the SSA region making up on average only 2% of each country’s gross exports. This is indicative of ‘thin’ or short RVCs where inputs from the region are used to produce final goods for consumption purposes (either domestically or exported).
Broadly, the data suggests that while SADC countries are well integrated into GVCs, their role is primarily that of exporters of resources. There is also some evidence of strong regional linkages with high shares of regional value added embodied in exports of several SADC countries. However, as found with the analysis of gross exports, South Africa is the main source of this foreign value added.
4. Regional trade and the development of value chains at the sectoral level
The aggregate picture presented above illustrates a number of interesting developments in terms of regional trade and nascent RVCs in southern Africa. But it is important to investigate this question at the sector level because the dynamics across sectors are so different. For instance in the apparel sector, discussed below, exports from the region to South Africa have expanded rapidly along with the emergence of significant RVCs. In the automotive sector, which is not discussed here, regional value chains are hardly apparent and virtually all regional trade consists of exports from South Africa to its Southern African neighbours. Below we investigate two sectors which are important in terms of both existing and prospective regional trade.
4.1. The apparel and textile industries
Since 2000 several SSA countries (notably Madagascar, Lesotho, Kenya, eSwatini and Ethiopia)Footnote6 have developed and expanded export-oriented apparel industries aimed mostly at developed country markets in the US and EU. This was driven by a number of factors including favourable global trade policy regulations and preferential trade agreements (Kaplinsky & Morris, Citation2008; Staritz, Citation2011). shows the increase in apparel exports to the world from selected SSA countries, as well as shifts in the composition of apparel exporters.
Table 3. Apparel exports from selected SSA countries to the US and EU (US$m).
demonstrates that this dramatic jump in global apparel exports is a result of preferential trade access to the US and EU markets post 2000. It also demonstrates the impact of the end of the MFA (31 December 2004) and the 2008 global crisis, as well the emergence of new export patterns.
AGOA with its single transformation rules of origin had a greater initial impact on stimulating apparel export sectors in Kenya, Lesotho and eSwatini. Mauritius and MadagascarFootnote7 had a different trajectory exporting to both the US and the EU. Mauritius was already an established apparel exporter and AGOA/EBA trade access consolidated its position rather than kick-starting it. Ethiopia emerged as an apparel exporter around 2012 as a direct result of AGOA/EBA preferential access (Morris et al., Citation2016).
Driving this initial apparel export growth in SSA were lead Asian transnational firms, already well connected within GVCs, that established subsidiary plants in Kenya, Lesotho, eSwatini, Madagascar and Mauritius (Staritz et al., Citation2015; Morris et al., Citation2016). Large, locally owned export oriented firms in Mauritius emerged out of this dynamic with some significance in the later period for the growth of southern African regionalism. In addition, a significant group of previously French citizens who had lived in Madagascar for a generation or more established a deeply embedded apparel export industry. Ethiopia’s export industry emerged as a result of aggressive industrial policy aimed at attracting global buyers, Asian transnational apparel producers and encouraging integration along its apparel value chain (Staritz et al., Citation2019).
Successful as it was in stimulating an apparel export industry, very little of this first wave of entry into GVCs entailed using regional suppliers or feeding into regional markets. However, the phasing out of the MFA and the 2008 global economic crisis with its concomitant decline in exports to these markets shook up the export apparel industry in Southern African countries. It produced a substantial change in Africa’s apparel export structure, restructured its sole focus on the US\EU markets, and led to the rise of a regional end market structure (Staritz et al., Citation2015).
This new regionalism has been driven by a number of forces (Morris et al., Citation2016). Preferential access to the South African apparel market changed the manner in which RVCs facilitated regional integration. Free trade membership of the South African Customs Union (SACU) with no rules of origin requirement substantially expanded exports of apparel from Lesotho and eSwatini to South Africa (Morris & Staritz, Citation2017). Likewise SADC’s preferential trade access requiring only two stage conversion rules of origin allowed Mauritian and Madagascan exports tariff free entry into the South African market (Morris & Staritz, Citation2014). highlights the rapid growth of such regional exports and this new found southern African regionalism.
Table 4. Apparel exports to South Africa (US$m).
Within a decade, total regional apparel imports into the South African market rose tenfold from US$52 million US$541 million, amounting to 18.5% of total SSA apparel exports. Essentially the regional export take off occurred around 2010 (for eSwatini, Lesotho and Madagascar), although Mauritius had earlier established a foothold in the South African market. Apparel exports from eSwatini and Lesotho jumped from insignificance to $57 m and $44 m respectively in 2010, rising progressively to $189 m and $129 m by 2017, to the extent that eSwatini ceased to export to US in any significant manner despite re-entry into AGOA.
Apparel exports from Mauritius to South Africa started already in 2006 ($21 m) rising steadily to $148 m by 2012 but then declined to $115 m by 2017. Significantly neither Ethiopia nor Kenya have been able to export to South Africa, primarily because they are not members of SADC and hence are unable to take advantage of tariff free entry to this regional market.
Apart from the importance of preferential trade policy in stimulating the South African market emerging as a regional economic hub, there are other RVC drivers facilitating the rapid growth of this process of regional integration. When the South African government imposed quotas on Chinese apparel imports in 2006, the buyers in the domestic retail chains very rapidly sought to diversify their import sources in order to manage risk (Reed, Citation2012). Hence they also began to look at apparel exporting firms in the region as new potential suppliers. Moreover this shift to regional suppliers was reinforced as some retailers have adopted quick response frameworks and hence partial sourcing to shorten lead times.
The drivers of greater Southern African regionalism go beyond the shifting glances of retail buyers. The other key driver lay in the patterns of firm ownership and the nature of direct foreign investment in the apparel exporting industries in the region. A substantial shift in firm ownership and the emergence of regional FDI substantially restructured the apparel industry and export patterns in these countries.
Three major ownership types of export-oriented firms can be identified in apparel GVCs and RVCs in southern Africa – transnational investors, regional investors, and diaspora investors. The different apparel exporting countries demonstrate major differences in the mix of these firm ownership types. These different characteristics are manifested in various levels of regional and local embeddedness (Morris et al., Citation2016), with differential effects on value chain and upgrading dynamics. Embeddedness refers to three dimensions: societal (rooted in domestic/regional social and economic relations), territorial (geographically extended relations anchoring firms within regional institutional relations), and networked (firms operating within networks/value chains relationships) (Morris et al., Citation2016).
Transnational investors are primarily based in East Asia (Hong Kong, Taiwan, Korea), but more recently in China, India and the Middle East. Their local plants have very little autonomy and activities are generally limited to basic assembly and CMT (cut-make-trim). The primary drivers for them to invest in SSA were (labour) costs, preferential access primarily to the US market, and special FDI incentives. These transnationals are locked into US value chains, and given their product profile have neither the interest nor capability to expand into the regional market.
Regional investors have emerged as major drivers of apparel exporting in southern Africa. The emergence of large locally owned lead firms in Mauritius signalled a regional investment and sourcing shift. These Mauritian firms not only sourced apparel and fabric locally in Mauritius but also from Madagascar. Moreover, they invested in the Madagascan economy setting up subsidiary plants and used these to export primarily to the EU but also into the regional market (Morris & Staritz, Citation2014). Another major regional investment shift has occurred through South African investment in the Lesotho and eSwatini apparel industry. From the middle of the 2010s onwards a significant number of South African firms sought to escape what they regarded as a restrictive domestic labour regime and relocated their apparel production (Morris et al., Citation2016; Morris & Staritz, Citation2017).
There are also a group of locally owned and embedded firms but with strong diaspora cultural and value chain linkages to external markets who export both to the EU and South Africa. They are most prevalent in Madagascar where owners with strong ancestral linkages to France have established close links to European markets and buyers and export the vast majority of their production to the EU. Since these diaspora firms produce similar product as required by the South African market, they have also become locked into this new regionalism (Morris & Staritz, Citation2014).
SACU and SADC preferential trade access and rules of origin create an enabling environment for the emergence of regional investors and end markets, but the value chain drivers of these processes lie in regional value chain dynamics. Ownership and embeddedness of firms in RVCs creates socio-political drivers of governance structures, end market shifts, and upgrading dynamics. Hence the regional policy challenge lies in mechanisms to support regionally embedded firms and build their capabilities.
4.2. Can the ‘retail revolution’ advance ‘developmental regionalism’ in Southern Africa?
This section examines prospects for regional value chains in agricultural processing, which are widely regarded as having considerable potential. The SADC Industrialisation Action Plan approved by the SADC Summit in 2017 identifies agro-processing as a key sector for ‘the development of a vibrant agricultural sector that will stimulate domestic and regional production of essential inputs, and improved investment in productive agro-industry value chains’ (SADC, Citation2017). Processed food is widely traded but the trade is mainly one way. In 2017, South Africa exported to the continent five times as much as it imported. Of South Africa’s total agricultural imports of $13.5 billion in 2018, only 8.1% were sourced from the region (Black et al., Citation2020).
The prospects for agro-processing RVCs are explored by considering how retail chains can become catalysts for supplier development and upgrading in RVCs and a force for effective implementation of the four pillars of ‘developmental regionalism’ (Ismail, Citation2018).Footnote8 The role of supermarket chains illustrate the possibilities for supplier development (local industrialisation), upgrading in RVCs, investment in cross-border infrastructure, and good governance (local stakeholder participation, regulation, private sector-government partnerships through a retailers’ charter).
Altenburg et al. (Citation2016) argue that the playing field for small producers in developing countries is very uneven as the large, more technologically sophisticated multinational retailers enter the market making it difficult for these businesses to compete. But ‘supermarketisation’ of value chains can also give rise to positive outcomes by increasing productivity, providing more choice to consumers and improving food safety.
These diverse outcomes are evident in southern African countries as well (das Nair & Chisoro, Citation2016; Nickanor et al., Citation2017). The real issue is how developing countries are able to leverage the presence of these retailers to modernise their retail markets and increase productivity, quality and consumer standards. Host countries need to also ensure that their policies and engagement with the retailers results in the building of local supply capacity enabling local firms to upgrade and participate in regional and global supply chains.
The buying power of South African retailers and stringent conditions imposed on suppliers has also come under increasing scrutiny by researchers (das Nair & Chisoro, Citation2015, Citation2016, Citation2017) and the South African Competition Commission (Cheadle, Citation2017).
South Africa’s retailers have been expanding across the continent. Shoprite has a large network of 250 stores in the rest of Africa and is followed by Spar and Pick n’ Pay (). Woolworths has more than 86 stores throughout the rest of Africa and 33 franchise stores in these countries.
Table 5. South African supermarkets in Africa; revenue and number of stores, 2015.
The access gained by South African food exporters to the retailers has provided a potential platform for the expansion of regional agro-food value chains but the developmental issue that arises is the question of domestic supplier development. The supermarket chains have a longer term interest in the development of local suppliers as a means of diversifying their supply base. Also many of their trucks return empty from north of the border back to South Africa and the lack of return loads is an important driver of high intra-regional freight rates (Vilakazi, Citation2018). However, supplier development is fraught with problems. The retail chains prefer to deal with large suppliers and are reluctant to partner with smaller firms. Exacting standards and certification, large volume requirements and competitive pricing make supplying the large chains difficult for local suppliers. A lack of finance is a further constraint. It also appears that local suppliers overrate their own capabilities and fail to fully understand the procurement criteria of the retail chains (Phiri & Ziba, Citation2019).
Also, South African retailers have also been meeting significant ‘soft’ and ‘hard’ barriers in some parts of Africa, particularly further to the north. Hard barriers refer to physical infrastructure and utilities, such as poor road, rail and port infrastructure and low levels of electrification. Soft barriers refer to complex government regulations, such as customs, and barriers to imports and exports (Nickanor et al., Citation2017). More recently, South African retailers have faced barriers in the form of local content requirements, import restrictions and indigenisation legislation, in several southern African countries, such as Zambia, Zimbabwe, Botswana and Namibia (das Nair & Chisoro, Citation2016).
These factors led to the South African government engaging the South African retailers on their regional expansion. The initiative taken by the South African government sought to build an understanding with the retailers on their outward expansion into the region and the need to play a positive role in their host countries in support of the ‘developmental regionalism’ approach of the South Africa government and SADC.
4.3. South African retailers in Namibia
All the large South African retail chains have a significant presence in Namibia; with Shoprite, Pick n Pay and Spar being the major players. The overwhelming share of fresh food and vegetable products on the retail shelves have historically come from South Africa. This has also been the case for most processed food products (Nickanor et al., Citation2017). Unlike many other African countries, in Namibia, the supermarkets are the main source of fresh and frozen produce and small and medium businesses in the food and beverage sector face intense competition from the large retail chains. While some large suppliers have been able to take advantage of the presence of large retailers (mainly in the beef and vegetables sector) in Namibia, the bulk of small businesses and farmers have not been successful (Nickanor et al., Citation2017).
These conditions in the Namibian food and retail sector prompted the Government of Namibia to launch the National Horticulture Development Initiative in 2002 with the objective of ‘increasing the local production of fruit and vegetables and … reduce … dependence on imported horticultural fresh produce’ (EPA Monitoring, Citation2017).
The Namibian Retail Charter was launched in March 2016. The Charter aims to stimulate local manufacturing, facilitate meaningful job creation, reduce unemployment, and deliver enduring changes in consumption patterns. Task teams were assembled for fast moving consumer goods; clothing and apparel; and building materials and hardware (Namibia Economist, 24 March Citation2016).
In partnership with the retailers, the Namibian Trade Forum (NTF) is also establishing a Barcode Centre to provide accreditation for GSI Barcodes, and building a supplier development programme. The Namibian Retail Charter is voluntary and the CEO of the NTF admits that this is a challenge for Namibian suppliers. However, she believes that the Charter has helped to raise awareness and understanding of the nature of the retail sector in Namibia (New Era, 21 June Citation2018).
Interviews undertaken in NamibiaFootnote9 indicate that the Retail Charter is a valuable instrument that the NTF has used to build partnerships between the retailers and local suppliers. Interviews with Woolworths in South AfricaFootnote10 confirm the constructive nature of the partnership that was built between the retailer and the NTF in Namibia. Woolworths took up the challenge to source about 50% of its fruit and vegetables from local suppliers and achieved this target over a period of three years. This project has resulted in Woolworths building partnerships with seven local suppliers who have been able to meet the ‘high standards of food safety, hygiene and quality that are fundamental requirements for the production of Woolworths Foods’.Footnote11 This account of the efforts undertaken by Woolworths in Namibia to support local suppliers was confirmed by the officials representing the NTF.
4.4. Implications for retailers and governments
The ongoing AfCFTA negotiations provide an opportunity for South Africa and the other governments of the region to engage with their stakeholders on how to ensure that regional integration in Southern Africa could create a win-win outcome by building the capacity of small and medium sized manufacturers, businesses and farmers, in host countries. In this way retailers can become major catalysts for regional integration in Southern Africa. For the retailers, building local capacity, offers the opportunity to develop new sources of supply for both their local and regional supply chains. While this single Namibian example does not indicate a more generalised shift in sourcing patterns, it does demonstrate that constructive collaboration between the retailers and suppliers supported by government can deliver significant results. Clearly, if such initiatives are implemented in a heavy handed way they become forms of protection and obstruct regional integration. But a balanced approach can encourage effective long term supplier development in South Africa’s neighbouring countries. Indeed, there are many other such examples of successful supplier development across the region. In some cases these have been led by firms themselves or by development agencies (Black et al., Citation2020).
5. Conclusion
This paper paper draws on a combination of trade data analysis and industry case studies to better understand the links between RVCs and regional integration. The macro trade data provide a picture of the incipient development of RVCs in southern Africa, evident for example, in the much higher content of manufactured goods in intra-regional (compared to extra-regional) exports and the growing exports to South Africa from the rest of the region. Viewing these developments through a sectoral prism indicates that there are important developments taking place which both demonstrate the benefits of regional integration to date but also powerfully support the case for ongoing steps to dismantle barriers between the countries of the region. From an industrialisation perspective, this presents an opportunity to drive industrialisation through the development and participation of SADC countries in regional and global value chains.
The emergence of this ‘new regionalism’ in southern Africa, highlights a number of key points. Preferential regional trade access (e.g. SADC, SACU) is critical but so is preferential access to export markets (AGOA, EBA, EU). In the apparel sector, significant capacity was created by exporting into the EU and the US. A second wave of regional investment has fuelled upgrading and exports into South Africa. Embedded ownership and regional FDI has been important for the growth of apparel RVCs and, via the spread of supermarket chains, could be starting to play a similar role in the food sector. South Africa needs to improve access of final goods into its market, which in many cases remain constrained by restrictive rules of origin.
Regional integration can be boosted by strong private sector pressure on governments. For this to happen, private sector players need to have strong commercial interests in regional market access and the lowering of other barriers together with improved cross border infrastructure. This is more likely to be the case where there is strong development of RVCs. But governements also need to play their role in partnership with other stakeholders in promoting the development of suppliers so that they can access regional value chains. The best modes of achieving this is an important area for future research. The long term sustainability of southern African regionalism therefore depends on the recognition of the importance of regional industrial policy, which takes account of the dynamics driving global and RVCs and facilitates regional linkages across all these sectors. Also, it needs to ensure that the benefits are widely spread.
Acknowledgments
Comments on the paper by John Page and two anonymous reviewers are gratefully acknowledged. This work was funded by UNU-WIDER.
Disclosure statement
No potential conflict of interest was reported by the authors.
Additional information
Funding
Notes
1 South African authorities changed their submission of trade statistics to better reflect trade with Botswana, Lesotho, Namibia and eSwatini from 2010. Trade with these countries made up 11.6% of South African exports and 2.5% of South African imports between 2010 and 2011. These shares are used to impute South African exports and imports to these countries over the period 2000–2009.
2 Gravity model estimates for this paper using 2015 data obtained from UNComtrade and CEPII (http://www.cepii.fr/CEPII/en/cepii/cepii.asp), reveal the importance of distance, productivity capacity and market size (GDP), trade agreements in the form of regional trade agreements or common monetary areas, contiguity of borders and logistics in destination markets as critical determinants of intra-SSA trade flows.
3 There are wide discrepancies in the value of exports to South Africa reported by SADC countries and the value of imports from SADC reported by South Africa. The latter was valued at US$6.2 billion in 2017, compared to US$11.3 billion for the former.
4 The sum of these two indicators are commonly used as an indicator of GVC participation (Aslam et al., Citation2017).
5 The high backward linkages (also into the region) for eSwatini may reflect the exports of fizzy drink concentrate to the region that uses large quantities of regionally sourced sugar.
6 Mauritius remains the second largest SSA apparel exporter but its exports have declined since 2000.
7 The exclusionof Madagascar from AGOA (2009–14) and Eswatini (2015–17) led to a radical decline in apparel exports to the US. On regaining AGOA access Madagascar’s apparel exports recovered dramatically by 2018.
8 For a more critical view of ‘developmental regionalism’, see Scholvin (Citation2018).
9 Interviews with the CEO of the NTF, Ms Ndiitah Nghipondoka-Robiati, and the Director of the Agriculture Trade Forum (a subsidiary body of the Namibian Trade Forum), Anton Faul were undertaken in August, 2018.
10 Interview, Vaughan van Eden, project manager for Namibia, who oversaw the supplier development programme.
11 Interviews.
References
- African Development Bank, 2019. African economic outlook, 2019. African Development Bank, Abidjan.
- Altenburg, T, Kulke, E, Hampel-Milagrosa, A, Peterskovsky, L & Reeg, C, 2016. Making retail modernisation in developing countries inclusive. A development policy perspective (Discussion Paper 2/2016). German Development Policy Institute, Bonn.
- Amjadi, A, Reincke, U & Yeats, A, 1996. Did external barriers cause the marginalization of Sub-Saharan Africa in world trade? (Policy Research Working Paper 1586). World Bank, International Trade Division, Washington, DC.
- Aslam, A, Novta, N & Rodrigues-Bastos, F, 2017. Calculating trade in value added (International Monetary Fund Working Paper WP/17/178). International Monetary Fund, Washington, DC.
- Black, A, Edwards, L, Gorven, R & Mapulanga, W, 2020. Agro-processing, value chains, and regional integration in Southern Africa (WIDER Working Paper 2020/36). UNU-WIDER, Helsinki.
- Cheadle, H, 2017. Grocery retail sector market enquiry, competition commission of South Africa. http://www.compcom.co.za/retail-market-inquiry/.
- das Nair, R & Chisoro, S, 2015. The expansion of regional supermarket chains. Changing models of retailing and implications for local supplier capacity in South Africa, Botswana, Zambia and Zimbabwe (WIDER Working Paper 2015/114). UNU-WIDER, Helsinki.
- das Nair, R & Chisoro, S, 2016. The expansion of regional supermarket chains and implications for local suppliers. A Comparison of findings from South Africa, Botswana, Zambia and Zimbabwe (WIDER Working Paper 2016/169). UNU-WIDER, Helsinki.
- das Nair, R & Chisoro, S, 2017. The expansion of regional supermarket chains: Implications on suppliers in Botswana and South Africa (WIDER Working Paper 2017/26). UNU-WIDER, Helsinki.
- De Backer, K & Miroudot, S, 2013. Mapping global value chains (OECD Trade Policy Papers 159). OECD Publishing, Paris.
- Del Prete, D, Giovannetti, G, & Marvasi, E, 2017. Global value chains participation and productivity gains for North African firms. Review of World Economics 153, 675–701.
- EPA Monitoring, 2017. Namibia’s retail sector charter and the strengthening of local supply chains. http://epamonitoring.net/namibias-retail-sector-charter-and-the-strengthening-of-local-supply-chains/.
- Farole, T, 2016. Factory Southern Africa?: SACU in global value chains - summary report. World Bank, Washington, DC.
- IMF, 2018. Sub-Saharan Africa: Regional economic outlook: Domestic revenue mobilization and private investment. International Monetary Fund, Washington, DC.
- Ismail, F, 2018. A ‘developmental regionalism’ approach to the AfCFTA (Working Paper). Trade and Industrial Policy Strategies (TIPS). http://tips.org.za/research-archive/trade-and-industry/item/3542-working-paper-a-developmental-regionalism-approach-to-the-afcfta.
- Kaplan, D & Morris, M, 2016. The expansion of South African based supermarkets into Africa: Likely future trajectory and the impact on local procurement and development. University of Cape Town, School of Economics, PRISM, Cape Town.
- Kaplinsky, R & Morris, M, 2008. Do the Asian drivers undermine export-oriented industrialization in SSA? World Development 36(2), 254–73.
- Koopman, R, Powers, W, Wang, Z & Wei, S, 2010. Give credit where credit is due: Tracing value added in global production chains (NBER Working Paper 16426). National Bureau of Economic Research, Cambridge, MA.
- Lenzen, M, Moran, D, Kanemoto, K & Geschke, A, 2013. Building Eora: A global multiregional input-output database at high country and sector resolution. Economic Systems Research 25(1), 20–49.
- Morris, M & Staritz, C, 2014. Industrialization trajectories in Madagascar’s export apparel industry: Ownership, embeddedness, markets, and upgrading. World Development 56, 243–57.
- Morris, M & Staritz, C, 2017. Industrial upgrading and development in Lesotho’s apparel industry: Global value chains, foreign direct investment, and market diversification. Oxford Development Studies 45(3), 303–20.
- Morris, M, Staritz, C & Plank, L, 2016. Regionalism, end markets and ownership matter: Shifting dynamics in the apparel export industry in Sub Saharan Africa. Environment and Planning A: Economy and Space 48(7), 1244–65.
- Namibia Economist, 2016. Birth of retail charter announced. https://economist.com.na/16286/retail/birth-of-retail-charter-announced/.
- New ERA, 2018. Namibia: Bar Code Centre needed to boost local products on local shelves. https://neweralive.na/2018/06/21/barcode-centre-needed-to-boost-local-products-on-retail-shelves/ Accessed 21 June 2018.
- Nickanor, N, Kazembe, L, Crush, J & Wagner, J, 2017. ‘The supermarket revolution and food security in Namibia’, African Food Security and Urban Network (AFSUN). Urban Food Security Series No 6. http://www.osf.org.za/wp-content/uploads/2018/05/AFSUN-Supermarkets-Revolution_Final-Report-Dec-2017-Open-Society-Foundation-for-South-Africa-OSF-SA-Publications.pdf.
- Phiri, M & Ziba, F, 2019. Expansion of regional supermarkets in Zambia: Finding common ground with local suppliers. In S Scholvin, A Black, J Diez & I Turok (Eds.), Value chains in Sub-Saharan Africa: Challenges of integration into the global economy. Springer.
- Reed, L, 2012. The changing dynamics of the South African clothing value chain and the role for industrial policy: A case study of the China quotas. PhD thesis, University of Cape Town, Cape Town, South Africa.
- SADC, 2017. Action plan for SADC industrialization strategy and roadmap. https://www.sadc.int/files/4514/9580/8179/Action_Plan_for_SADC_Industrialization_Strategy_and_Roadmap.pdf.
- Scholvin, S, 2018. Developmental regionalism and regional value chains: Pitfalls to South Africa’s vision for the Tripartite free trade area. Africa Spectrum 53(3), 115–29.
- Staritz, C, 2011. Making the cut? ‘Low-income countries and the global clothing value chain in a post- quota and post-crisis world. World Bank, Washington, DC.
- Staritz, C, Plank, L & Morris, M, 2019. A different path of industrial development? Ethiopia’s apparel export sector. In S Scholvin, A Black, J Diez & I Turok (Eds.), Value chains in Sub-Saharan Africa: Challenges of integration into the global economy. Springer, 79–94.
- Staritz, C, Morris, M & Plank, L, 2015. Clothing global value chains and Sub- Saharan Africa: Global exports, regional dynamics, and industrial development outcomes (Draft Policy Briefing Paper). Commonwealth Secretariat, Trade Division, London.
- Vilakazi, T, 2018. The causes of high intra-regional road freight rates for food and commodities in Southern Africa. Development Southern Africa 35(3), 388–403.