
ABSTRACT
The burden of vision impairment due to uncorrected refractive error (needing spectacles) in Mozambique is known to be significant. To improve the planning and provision of eye health services, a better understanding of how vision is valued by patients is needed. The willingness to pay (WTP) for improved vision through correcting refractive error was investigated in Nampula, Mozambique, using stated choice and bidding game methodologies. The mean WTP values were found to be 388.92 Meticals (US$13) for stated choice and 469.89 Meticals (US$16) for the bidding game. The mean WTP values for rural dwellers were found to be lower than responses from those living in urban areas. If avoidable vision impairment is to be addressed in Mozambique, the cost of services must not be a barrier and the construction of a sustainable spectacle system that delivers for both rural and urban patients must be a priority.
1. Introduction
The global burden of blindness and vision impairment (VI) remains high. A systematic review and meta-analysis found that there are an estimated 36 million people in the world who are blind, 216.5 million who have moderate to severe vision impairment, and 188.5 million who have mild VI (Bourne et al., Citation2017). In addition, an estimated 826 million people have near VI because of a lack of, or inadequate, vision correction (Fricke et al., Citation2018). As the world’s population continues to grow and life expectancy increases, prevalence of VI will increase, with people living in low-income countries likely to be disproportionately affected by vision impairment. The International Agency for the Prevention of Blindness estimate that the Africa region has proportionately 73% more blind and visually impaired people than any other region (IAPB, Citation2019). Refractive error (RE) is a condition when the eye does not clearly focus light on the retina. Uncorrected refractive error (URE) refers principally to the conditions of myopia, hyperopia, and astigmatism. Presbyopia is a related, and age dependent, inability to focus clearly on near objects (Thompson et al., Citation2014).
Mozambique has relatively low economic development, life expectancy, educational attainment and income levels (UNDP, Citation2016). It has a population of nearly 30 million people (World Bank, Citation2018). A study involving 3,453 participants found that the prevalence of URE (excluding presbyopia) in Mozambique was estimated at 2.6% (95%, CI 2.1–3.2%), and was found to be the primary cause of vision impairment, responsible for 64.5% of cases. Most cases of RE can be addressed with spectacles. However, none of the participants with URE (excluding presbyopia) in Mozambique had appropriate spectacles. Based on participants who were aged 35 years and older, presbyopia prevalence in Mozambique was estimated to be 25.8% (95%, CI 12.0–30.5%). Of the participants identified as having presbyopia, only 2.2% had their vision adequately corrected (Loughman et al., Citation2015).
A study of the barriers to utilisation of refractive services in Mozambique found cost to be the most significant barrier, with 35.52% of a sample of 1,631 participants identifying it as a problem (Thompson et al., Citation2015). In order to develop a sustainable system that is responsive to the financial and other needs of Mozambicans, the current study aims to provide information on how vision is valued, by gaining an understanding of the willingness to pay (WTP) for refractive services by Mozambicans.
WTP methodology was first developed for the environmental sector in the 1960s (Davis Citation1963). It has since been adapted for many other sectors and contexts, ranging from water services in Botswana; household waste collection in Malawi; and markets for indigenous natural food in Botswana, South Africa and Namibia (Mbata, Citation2006; Faria et al., Citation2011; Ndau & Tilley, Citation2018). The theoretical foundation of WTP is based on consumer demand theory (Bala et al., Citation1999). It is used to measure outcomes in monetary units by eliciting the maximum amount a person is willing to pay to receive a given outcome, after assessment of all possible advantages and disadvantages (Maxwell et al., Citation2008). It establishes the maximum amount of resources that a person would be willing to give up so that the person receiving the service considers him/herself to be just as well off with fewer resources as they would have been forgoing the service and retaining their resources (Frick & Baruwa, Citation2007).
WTP to address visual impairment has been seriously under-researched, especially in low-income countries. The earliest identified instance of WTP being used to assess perceived value of restoring vision with spectacles in a low-income setting was in a study in Timor-Leste. The majority of participants were found to be unwilling to pay as little as US$1 for spectacles. Women and rural dwellers were less likely to be willing to pay US$1 for spectacles than other groups. The need for spectacles was found to be greatest among people who had the least resources to pay for them. Based on these findings, an equitable cross-subsidisation spectacle system was recommended to address this lack of willingness to pay for eye health services (Ramke et al., Citation2007).
As cost is known to be a significant barrier to the utilisation of eye health services, to develop sustainable health systems that address avoidable blindness and vision impairment, a better understanding of the preferences of the population is needed. Evidence is needed about patient demand for eye health services to inform policy decisions. In Mozambique, this evidence is currently lacking. To address this, the general research objective of this study was to assess how eye health is valued in the low-income setting. The specific research objective was to understand specifically the WTP for refractive services in Mozambique.
2. Methods
A community-based cross-sectional study was conducted using two stage cluster sampling. Clusters were defined by the administrative level of ‘bairro’, meaning neighbourhood. There are 395 bairros in Nampula Province (INE, Citation2015). 19 bairros were selected for enumeration using a systematic random sampling method with probability proportional to size (PPS). A minimum of 60 participants were included per cluster. The calculation of sample size was based on several aspects including the required precision of the estimate and confidence levels. The sample of this study was set at a level to far exceed the necessary sample size required for the validation of the methodology. The sampling was conducted in a manner that each individual participating has the same participation weight and an equal probability of selection; therefore it is a self-weighting sample.
Participants were selected at random from the study area by means of door to door sampling. VI status (real or perceived) did not determine inclusion, on the basis that people with VI would be represented in the sample in proportion to the prevalence of VI (Labelle & Hurley, Citation1992). To be included, participants needed to be at least 16 years of age, residing permanently at the address and actively involved in making financial decisions in the household. The matriarch or the patriarch of the household was targeted as their responses were deemed to be more likely to be accurate in the context of the household budget (Congdon et al., Citation2008, du Toit et al., Citation2008).
Participants completed a questionnaire by means of a face-to-face interview, to ensure protocol compliance and to improve accuracy of responses (Olsen & Smith, Citation2001). The translation of the questionnaire from English into Portuguese was independently verified. A team of data collectors interviewed the participants in Portuguese or the regional language Makua.
The dwelling location of each participant was assessed as urban, semi-rural or rural by data collectors, based on household access to treated water and electricity supply, population density and the presence of surfaced roads. Just over a third of Mozambicans live in urban areas (CIA, Citation2018). It was decided that a third of participants would be selected from each location type.
A series of background questions on demographics, financial situation and employment status were presented to participants. Visual Acuity (VA) was assessed by either a qualified optometrist or by an optometry student enrolled at Universidade Lúrio, who was under the supervision of a qualified optometrist. Participants were grouped according to accepted VI categories based on their measured VA (Bourne et al., Citation2013). Questions were asked to establish any self-perceived problems with their vision. Participants were divided into those with or without VI (tested or perceived).
All participants were given a brief introduction to URE and informed how it could impact on their life in terms of limiting education, productivity and social interactions. They were asked to imagine that they had VI due to URE. They were informed that VI could be identified through a short, pain free examination – which does not involve surgery. The participant was informed that a pair of spectacles (which would last for an estimated four years if well maintained) would correct VI. WTP values were ascertained using two methods – stated choice and a bidding game.
For stated choice, each participant was simply asked what they would pay for the eye exam and the spectacles. It is recognised that stated choice responses may deviate from real market values due to hypothetical bias. To counter this, prior to administrating the stated choice questionnaire, a technique called ‘cheap talk’ was employed, whereby interviewers describe in as much detail as possible the hypothetical scenario, including the purpose of the study and that the study is hypothetical. Participants are told of the importance of providing an accurate WTP response and asked to think very carefully about value, and compare their response to the cost of real items they may consume or purchase (Özdemira et al., Citation2009; Lang et al., Citation2012).
The second methodology employed was the bidding game, which has been shown to be suitable for use in low-income contexts with prevalent informal economies, as it is based on the notion of haggling and negotiation, mimicking the everyday transactions to which participants may be accustomed to (Donaldson et al., Citation2006; Onwujekwe et al., Citation2008). Bidding game methodologies can be vulnerable to starting point bias, whereby responses are influenced by the start values presented by the researcher. To counter this, participants were presented with one of four starting bids followed by pre-specified algorithms. The algorithms subjected all participants with the same negotiation process, whereby three further bids were presented to each participant, the value of which was determined by a positive or negative response to the bid before (Frew et al., Citation2004). Each participant had an equal opportunity to arrive at the same final value at the end of the bidding process, regardless of the starting bid. At the end of the bidding process, the participant was asked if they were satisfied with the final bid, or to confirm what their final bid would be. Responses for the bidding game methodology were analysed to establish if there was any starting point bias. In addition, a scope analysis was undertaken to check internal validation analysis of WTP responses for both methodologies. This involved testing to see if WTP values increased with additional benefits being offered (Maxwell et al., Citation2008).
After training the data collectors, a pilot study was conducted. Responses from 60 participants (equivalent to >5% of the total participants expected to be enumerated) were recorded. At the time of data collection (October 2013), US$1 was worth 29.53 Meticals. The pilot revealed that the vast majority of families earned less than 2,000 Meticals a month, which was less than had been expected. After considering the financial situation of the participants, it was clear that the original starting bids for the bidding game were set too high and needed to be adjusted accordingly (Lang et al., Citation2012). Starting bids were set at 2,000 Meticals or below.
Data was collected from 1,144 participants. Four participants were found to be blind and were excluded from the analysis on the grounds that an eye test and spectacles would not improve their VA, thus invalidating WTP values given. Three participants started the interview but did not want to answer questions on WTP and were excluded. After data collection had been completed, the relationships between WTP values and other variables were explored through statistical analysis. Effect size was calculated using an effect size calculator (UCCS, Citation2019). A Spearman’s rank correlation test was used to assess the relationship between WTP and the variables of age and price paid for spectacles. Independent sample T tests were used to analyse the variables of sex, spectacle ownership, personal income, and family income. One-way ANOVA tests were used to analyse the association between WTP and the variables of location, employment status, and education. For each variable the assumption of homogeneity of variance was violated; therefore the Welch F-ratio was reported, followed by a Games Howell Post Hoc test. For the scope analysis an independent sample T test was also used to analyse the variance in stated WTP values from participants with different scope question responses. Multivariate analysis was used, with WTP (both stated and final bid) as the dependent variable, as a means to simultaneously consider all independent variables (age, sex, spectacle ownership, personal income, family income, location, employment status, level of education, VI category and VI status) in a regression model.
3. Results
The demographic characteristics of participants are displayed in . A total of 1,137 responses were included from urban (33.5%), semi-urban (30.9%), and rural (35.6%) areas. 701 participants (61.7%) were literate. The vast majority of participants (77.7%) had a personal income of less than 2,000 Meticals suggesting they lived below the poverty line. Most participants (67.5%) were self-employed. The number of participants who were found to have actual VI is shown in .
Table 1. Demographic characteristics of study participants.
Table 2. Profile of vision impairment among participants, classified according to measured VA.
A total of 315 participants (27.7%) had actual VI and were aware they had a problem. Only 19 participants (1.7%) had actual VI and were unaware of the problem. A total of 455 participants (40%) had no actual or perceived VI. As many as 348 participants (30.6%) perceived they had VI, although the VA test indicated they did not. It was not investigated as to why such a high number of participants reported having VI when they did not. Possible explanations include that their eye problem was not severe enough to cross the designated threshold; that they experience periodic vision problems caused by factors including dust, poor light etc; that participants may have had the misconception that they would gain in some way by reported an eye problem. Further research is needed to explore this unexpected result.
In total 665 participants (58.5%) had actual or perceived VI. Of these, 286 participants (43%) stated that they knew where to get their eyes tested and 578 of them (86.9%) did not have spectacles. One participant with no actual or perceived VI responded that they had spectacles. Of the 87 participants with spectacles, 76 of them provided information on how much they cost. The mean cost was 645.20 Meticals (SD. 1399.723). Some people got them for free. The maximum price that was paid was 8,000 Meticals. Of the 71 participants who provided information relating to where spectacles were sourced 35 people (49.3%) had bought them on the street, 13 people (18.3%) had received them through Universidade Lúrio optometry clinic, 10 people (14.1%) had received them through the hospital and 7 people (9.9%) had got them through a high street optician. The remaining 8.4% of people reported sourcing their spectacles from church, as a gift, borrowed, the capital city (Maputo) or from abroad.
The mean stated WTP value was 388.92 Meticals (SD. 602.092). The mean final bid WTP value was 469.89 Meticals (SD. 666.240). As shown in , a general trend was observed whereby the stated choice WTP value was similar to the final bid WTP value. The greatest variation was 4,800 Meticals between the final bid and the stated choice. The mean stated WTP and final bid WTP values and standard deviations for several variables are displayed in .
Figure 1. WTP variance between the two methodologies.
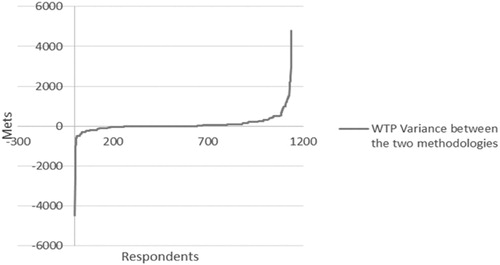
Table 3. Stated choice and final bid willingness to pay values according to demographic characteristics.
The mean values for both stated choice and bidding game methodologies are found to be skewed by outlying values. Eight of the stated choice values were equal or above 3,000 Meticals, with the highest value being 8,000 Meticals. For the bidding game values, 11 of the final bids were equal or above 3,000 Meticals, with the highest final value also being 8,000 Meticals.
indicates how many of the responses were below, equal to or above the mean. 67% of responses for the stated choice and 66.7% of responses for the final bid were below the mean. Around a third of the people interviewed were willing to pay above the mean value for both stated choice and the bidding game.
Table 4. Response variance from mean WTP values.
The results of a Spearman’s rank correlation test indicated that there was a non-significant relationship between age and stated WTP and the final bid WTP. Although only 76 participants had previously had spectacles, it was found that there was a positive monotonic relationship between the cost of previous spectacles and both stated WTP and the bidding game WTP.
The results of independent sample T tests indicated that the mean stated choice and final bid WTP values for males was significantly higher compared to females (p = <0.01 for both). Participants with spectacles were found to have a higher mean for both stated choice and final bid WTP (p = <0.01 for both), compared to participants without spectacles.
Participants with a personal or a family income of less than 2,000 Meticals had significantly lower mean stated choice and final bid WTP values (p = <0.01 for both), compared to participants with a personal or family income of more than 2,000 Meticals.
One-way ANOVA tests revealed a statistically significant relationship between both the stated means and the final bid means and location. Also a statistically significant relationship was found between employment status and both the stated WTP value and final bid means. Posthoc analysis revealed that the stated WTP and final bid values were both statistically significantly different when comparing employed and self-employed participants (p = <0.01 for both), employed and unemployed participants (p = <0.01 for both), and employed and retired participants (p = <0.05 for both).
Statistically significant differences were found between education level and both the stated WTP and final bid. Posthoc analysis revealed that the differences in both stated WTP and final bid means were statistically significant for paired comparisons across all education levels (p = <0.01 for all).
One-way ANOVA tests found there was no statistically significant difference between stated or final bid WTP means across people with different levels of VI.
For the scope analysis (which tested participants’ WTP values against varying theoretical periods of longevity, quantities and cost of spectacles) 867 participants (76.3%) gave a positive response to two or more of the questions. The means for the scope analysis are displayed in .
Table 5. Scope analysis to investigate if, when additional benefits were offered, WTP values increased (positive response) or not (negative response).
The results of an independent sample T test indicate that the difference in stated WTP values by participants with different scope responses was significant. Using the same test to analyse the variance in final bid WTP values, the results indicate that there was also a significant difference in variance from participants with different scope responses.
The mean final bid WTP values for the four starting bids are displayed in . No statistically significant difference was found between the final bid means and the starting bids. The lack of a clear correlation between starting bids and final bids is shown in .
Figure 2. Association between starting bids and final bids.
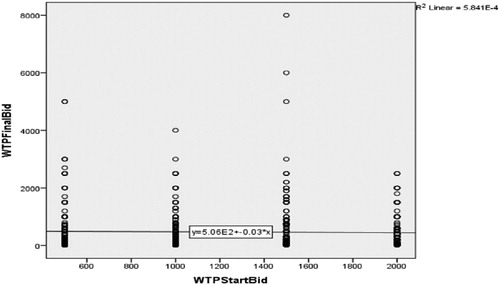
Table 6. Final bid WTP values according to starting bid.
Multivariate analysis was used as a means to simultaneously consider all the other independent variables in a regression model. The dependent variable was WTP (both stated and final bid) and the independent variables were age, sex, spectacle ownership, personal income, family income, location, employment status, level of education, VI category and VI status (actual or perceived). The results for the two models are presented in . When considering the model diagnostics both models adequately fit the data though the model for WTP final bid seem to offer slightly better fit. The empirical findings of the two models reveal qualitatively similar results.
Table 7. Multivariate analysis to assess relationships between WTP and several variables simultaneously.
The multivariate analysis indicates that WTP declines with age and that this relationship was statistically significant. Compared to males, the WTP of females was lower (75.5 for stated WTF and 135.6 for final bid) and this too was statistically significant. Compared to participants with no secondary schooling, the WTP of participants with a degree was considerably higher (by 746 for stated WTP and by 822 for the final bid) and was statistically significant.
The difference between participants with no secondary education and those with a secondary education was found to be statistically significant for stated choice WTP but not for final bid WTP. Compared to those participants who are employed, self-employed participants have a low WTP. Participants who are unemployed or retired were found to be less willing to pay than those who are employed, but this was not statistically significant.
While household income was found to have a strong positive statistical relationship with both WTP values, personal income has only a weak positive relationship that was not statistically significant. With regards to geography, compared to participants from urban locations, those from rural locations have a low WTP, which was statistically significant at the 5 per cent level. All of the remaining independent variables tested in these two models, including actual and perceived VI, were found to not be significant.
4. Discussion
Participants who took part in this study were fairly balanced, in terms of gender and geographic location. The range of dependent children was found to be varied, indicating the variety of family situations in Mozambique. Stated literacy was high. The vast majority of participants reported having never finished secondary school. Relatively few participants had formal employment and more than three quarters of participants earned less than 2,000 Meticals a month (approximately US$2 a day, which is just over the World Bank International Poverty Line threshold of US$1.90) (World Bank, Citation2015).
Of the 665 participants with actual or perceived VI, only 43% of these knew where to get their eyes tested. Further investment is needed in advertising eye clinics and the services they provide. Half the people who had had spectacles had bought them on the street, thus missing the opportunity for a full ocular health check from a trained professional, who is integrated into the health system. If affordable and good quality eye health services are not available, people will continue to purchase spectacles from street vendors. People with more disposable income reported either accessing eye health services in the capital city Maputo or in neighbouring South Africa, which are both options unavailable to the vast majority of the population. Public services must aim to address the needs of those members of society that are disadvantaged.
The mean final bid WTP value was found to be 20% higher than the mean stated WTP value, with the negotiation process leading to higher reported WTP values. Only for participants with severe VI was the mean stated WTP value found to be higher than the mean final bid WTP (288.06 compared to 255.00). It is not clear why this was the case, and possibly caused by outlying values. Using a methodology that mirrors everyday market transactions, which people are familiar with, has been shown to enhance the realism of the analysis (Donaldson et al., Citation2006). Haggling techniques allowed participants to engage with the valuation process and arrive at their true WTP value (Onwujekwe et al., Citation2008).
Our finding that participants who already had spectacles were willing to pay more for eye care services is interesting. Having previously experienced the benefit of corrected VI, their WTP values were higher. Increased advocacy about the social, economic and health benefits of eye health may increase the value people assign to this simple intervention. While, the price people had paid in the past for spectacles influenced how much they would be willing to pay in the future, some caution should be applied to this finding, as only 76 participants were found to previously own spectacles. A study using a larger sample could test if this finding holds at scale.
The results indicated that participants with higher incomes were associated with higher WTP values for both methodologies. A positive association between income and WTP has been shown in other contexts (Onwujekwe et al., Citation2008). This would suggest that as financial resources become more accessible, people become more willing to invest money in accessing health services. However, some caution is needed when interpreting these findings, as the assumption that WTP is synonymous with ability to pay is challenged on the grounds that the opportunity costs associated with making decisions on health care spending may not be predictable (Russell, Citation1996). Further research is needed to establish the price elasticity of eye health and refractive services in particular.
With regards to location, for both methodologies the WTP value was highest for those living in urban areas and lowest for those living in rural areas. Similar findings were reported in Timor-Leste (Ramke et al., Citation2007). This confirms the regional variations in resource distribution, which must be addressed if a successful universal eye health service is to be achieved.
For both WTP methodologies, males were found to respond with significantly higher values than females. This may reflect females taking a more conservative approach to household budgeting. Further research is needed to better understand household both expenditure and decision making with regards to accessing health services (including eye health services) in Mozambique.
Internal validation analysis of WTP responses can increase confidence in their legitimacy. In the current study, WTP values were validated through a scope analysis to investigate whether WTP values increase with additional benefits (Maxwell et al., Citation2008). Participants were asked three questions to test their WTP values against varying theoretical periods of longevity, quantities and cost of spectacles. For example, participants were asked if they would be willing to pay double their WTP value if the spectacles lasted twice as long. They were also questioned about their WTP for value added spectacles in the form of varifocals. Three quarters of participants responded positively to the scope analysis questions, indicating that as the longevity, quantity or utility of the spectacles increased, so did their WTP. One quarter of participants did not offer to increase their WTP value in relation to increased benefit. With sensitivity to changes in scope being observed in three quarters of responses, the methodology is validated and the WTP values are found to be robust (Kartman et al., Citation1996; Maxwell et al., Citation2008). In addition, analysis of the responses for the bidding game methodology indicate that there was no evidence of any starting point bias.
Two methodological limitations were noted after the research was completed. Although bairro size was incorporated into the study design, population density of bairros was not considered. As the population of each bairro varies from under a hundred people to several thousand, if more time and resources were available, the number of people sampled from each cluster would correlate to the population of each bairro. Secondly, as the bidding game WTP methodology was undertaken directly after the stated choice methodology, it is possible that the responses to the first methodology influenced the responses to the second.
5. Conclusions and policy implications
The results of this study indicate that in a society where the majority of people live below the poverty line, after participants assessed all possible advantages and disadvantages, there is a willingness to pay for services and treatments that lead to improved vision, despite a general lack of resources.
Any system developed to address URE in Mozambique needs to be responsive to the financial situation of the general population. If a universally accessible eye health system is to be developed, the needs of the most marginalised must be considered. Attention must be paid by policy makers to those members of society who are least able to pay for eye health services, as the need for spectacles is likely to be greatest among people without the resources to procure them. A system whereby services for those who are unable to pay are subsidised by those who have the means to pay could provide a solution. Careful consideration of pricing structures is needed as if the price is too high then it could be a barrier, but if the price is too low, then limited resources allocated to fund eye health services will become stretched. Policy makers will need to pay particular attention to the needs and means of people who live in rural areas, those without formal employment and those without an adequate education, as they are likely to be the least able to afford eye health services.
Acknowledgments
The authors would like to thank Rajith Lakshman from the Institute of Development Studies for assistance with the statistical analysis, and Sandra Baxter formally of the Institute of Development Studies for managerial support. Thanks also to Jorge Ferrão formally of Universidade Lúrio and all the Optometry Department staff and students for supporting the data collection in Mozambique. Stephen James Thompson. The Social and Economic Impact of Refractive Error in Mozambique. Doctoral Thesis, Technological University Dublin. Retrieved from https://arrow.tudublin.ie/cgi/viewcontent.cgi?article=1179&context=sciendoc.
Disclosure statement
No potential conflict of interest was reported by the author(s).
Additional information
Funding
References
- Bala, M, Mauskopf, J & Wood, L, 1999. Willingness to pay as a measure of health benefits. Pharmacoeconomics 15, 9–18.
- Bourne, R, Price, H, Taylor, H, Leasher, J, Keeffe, J, Glanville, J, Sieving, P, Khairallah, M, Wong, T, Zheng, Y, Mathew, A, Katiyar, S, Mascarenhas, M, Stevens, G, Resnikoff, S, Gichuhi, S, Naidoo, K, Wallace, D, Kymes, S, Peters, C, Pesudovs, K, Braithwaite, T & Limburg, H, on behalf of the Vision Loss Expert Group, 2013. New systematic review methodology for visual impairment and blindness for the 2010 global burden of disease study. Ophthalmic Epidemiology 20(1), 33–39.
- Bourne, R, Flaxman, S, Braithwaite, T, Cicinelli, M, Das, A, Jost, J, Keeffe, J, Kempen, J, Leasher, J, Limburg, H, Naidoo, K, Pesudovs, K, Resnikoff, S, Silvester, A, Stevens, G, Tahhan, N, Wong, T & Taylor, H, on behalf of the Vision Loss Expert Group, 2017. Magnitude, temporal trends, and projections of the global prevalence of blindness and distance and near vision impairment: A systematic review and meta-analysis. Lancet Global Health 5(9), 888–897.
- Central Intelligence Agency, 2018. The world fact book – Mozambique. Central Intelligence Agency, Langley. https://www.cia.gov/library/publications/the-world-factbook/geos/mz.html Accessed 21 December 2018.
- Congdon, N, Zheng, M, Sharma, A, Choi, K, Song, Y, Zhang, M, Wang, M, Zhou, Z, Li, L, Liu, X & Lam, D, 2008. Prevalence and determinants of spectacle nonwear among rural Chinese secondary schoolchildren. Archives of Ophthalmology 126(12), 1717–1723.
- Davis, R, 1963. Recreation planning as an economic problem. Natural Resources Journal 3, 239–249.
- Donaldson, C, Mason, H & Shackely, P, 2006. Contingent valuation in health care. In A Jones (Ed.), The Elgar companion to health economics. Edward Elgar Publishing, Cheltenham, pp. 425–436.
- du Toit, R, Ramke, J, Palagyi, A & Brian, G, 2008. Spectacles in Fiji: Need, acquisition, use and willingness to pay. Clinical and Experimental Optometry 91(6), 538–544.
- Faria, M, Mabaya, E & Jordaan, D, 2011. Markets for marama beans in Southern Africa: Linking sustainable products with sustainable livelihoods. Development Southern Africa 28(4), 477–492.
- Frew, E, Wolstenholme, J & Whynes, D, 2004. Comparing willingness-to-pay: bidding game format versus open-ended and payment scale formats. Health Policy 68, 289–298.
- Frick, K & Baruwa, E, 2007. The paradox of economic tools promoting equitable access to self sustainable services for the poorest – increased inequality. Tropical Medicine and International Health 12(7), 799–801.
- Fricke, T, Tahhan, N, Resnikoff, S, Papas, E, Burnett, A, Ho, S, Naduvilath, T & Naidoo, K, 2018. Global prevalence of presbyopia and vision impairment from uncorrected presbyopia: Systematic review, meta-analysis, and modelling. Ophthalmology 125(10), 1492–1499.
- IAPB, 2019. Africa. IAPB, London. https://www.iapb.org/iapb-regions/africa/ Accessed 5 July 2019.
- Instituto Nacional de Estatistica, 2015. Population/total population Nampula. Instituto Nacional de Estatistica, Maputo. http://www.ine.gov.mz/ Accessed 3 July 2019.
- Kartman, B, Stalhammar, N-O & Johannesson, M, 1996. Valuation of health changes with the contingent valuation method: A test of scope and question order effects. Health Economics 5(6), 531–541.
- Labelle, R & Hurley, J, 1992. Implications of basing health-care resource allocations on cost-utility analysis in the presence of externalities. Journal of Health Economics 11(3), 259–277.
- Lang, H-C, Chang, K & Ying, Y-H, 2012. Quality of life, treatments, and patients’ willingness to pay for a complete remission of cervical cancer in Taiwan. Health Economics 21(10), 1217–1233.
- Loughman, J, Nxele, L, Faria, C, Thompson, S, Ramson, P, Chinanayi, F & Naidoo, K, 2015. Rapid assessment of refractive error, presbyopia and visual impairment and associated quality of life in Nampula, Mozambique. Journal of Visual Impairment & Blindness 109(3), 199–213.
- Maxwell, W, Waycaster, C, D’Souza, A, Meissner, B & Hileman, K, 2008. A United States cost-benefit comparison of an apodized, diffractive, presbyopia-correcting, multifocal intraocular lens and a conventional monofocal lens. Journal of Cataract Refractive Surgery 34(1), 855–1861.
- Mbata, J, 2006. Estimating household willingness to pay for water services in a rural economy: The case of Kanye in southern Botswana. Development Southern Africa 23(1), 29–43.
- Ndau, H & Tilley, E, 2018. Willingness to pay for improved household solid waste collection in Blantyre. Malawi. Economies 6(54), 1–21.
- Olsen, J & Smith, R, 2001. Theory versus practice: a review of ‘willingness-to-pay’ in health and health care. Health Economics 10, 39–52.
- Onwujekwe, O, Fox-Rushby, J & Hanson, K, 2008. Construct validity of the bidding game, binary with follow-up, and a novel structured haggling question format in determining willingness to pay for insecticide-treated Mosquito nets. Medical Decision Making 28(1), 90–101.
- Özdemira, S, Johnson, R & Hauber, B, 2009. Hypothetical bias, cheap talk, and stated willingness to pay for health care. Journal of Health Economics 28, 894–901.
- Ramke, J, du Toit, R, Palagyi, A, Brian, G & Naduvilath, T, 2007. Correction of refractive error and presbyopia in Timor-Leste. British Journal of Ophthalmology 91, 860–866.
- Russell, S, 1996. Ability to pay for health care: concepts and evidence. Health Policy and Planning 11(3), 219–237.
- Thompson, S, Naidoo, K, Harris, G, Ferrao, J & Loughman, J, 2014. The development of a public optometry system in Mozambique: A cost benefit analysis. BMC Health Services Research 14(1), 422–430.
- Thompson, S, Naidoo, K, Gonzalez, C, Harris, G, Chinanayi, F & Loughman, J, 2015. Barriers to utilisation of refractive services in Mozambique. Optometry and Vision Science 92(1), 59–69.
- UCCS, 2019. Effect size calculator. University of Colorado, Colorado Springs. http://www.uccs.edu/~lbecker/ Accessed 3 July 2019.
- United Nations Development Programme, 2016. Human development report – human development for everyone. United Nations Development Programme, New York.
- World Bank, 2015. World Bank forecasts global poverty to fall below 10% for first time; Major hurdles remain in goal to end poverty by 2030. World Bank, Washington, DC. http://www.worldbank.org/en/news/press-release/2015/10/04/world-bank-forecasts-global-poverty-to-fall-below-10-for-first-time-major-hurdles-remain-in-goal-to-end-poverty-by-2030 Accessed 22 January 2019.
- World Bank, 2018. Mozambique country profile. World Bank, Washington, D.C. https://data.worldbank.org/country/mozambique Accessed 21 December 2018.